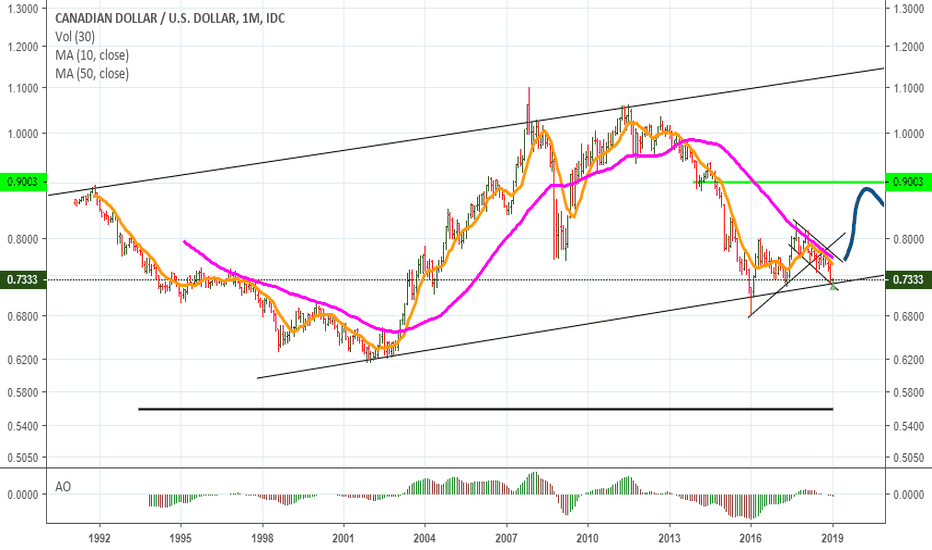
Predictions and analysis
Stop loss: $0.7551 Risk Reward: 2.75 Target $0.7079
A potential breakout to the higher 1.36 levels are a possibility. We will have to see a clean breakout of the 1.35200 Resistance to spike us to the 1.36 levels. We are going to hit a Fibonacci Level regardless, so if price doesn’t hit the 61.80% Fib we can see it fall with the purple trend line to bounce off the 50% Fib level.
Looks the triangle broke and that trend line as well. No real follow through yet, so it could bounce up a bit first. If this happens, it should not break the red zone. That would complete a retest of the triangle. A break of the green support, should increase the chances a lot of dropping towards the 1.330 Previous analysis:
Triggered into this short trade on USD/CAD Risking 25 pips Targeting 110 pips *Not FINANCIAL Advise*
cadusd has broken ascending trendline and made a bearish flag pattern. Waiting for price to break out so I can enter.
cad usd is bullish at the moment with 4hr/1hr zones being respected, waiting for price to reject weekly zone so we can look for shorts.
cadusd made a h&s pattern while making a xabcd pattern + reaching resistance zone.
Ran monthly model on CADUSD per request from follower to see if momentum model could time currencies. brschultz
CADJPY is approaching our first resistance at 83.43 (50% Fibonacci retracement , 100% Fibonacci extension, horizontal pullback resistance )where we might see a drop in price to our first support at 81.34 ( 38.2% Fibonacci retracement , horizontal swing low support ). Stochastic (89,5,3) is also approaching resistance and we might see a corresponding drop in...
Probable Gartley Pattern Formation occuring here get ready to Short.....
relative historical uptrend with a reversion to the mean from here $TSX $HXU.ca
=> Here we are tracking risk-off for the US mid term elections and using CADJPY as a strategic hedge. => This is because of Canada primarily funding its deficit through portfolio inflows and with tightening liquidity conditions we see less investment into Canada for the foreseeable future. => Later this month we have a BoC hike priced in as well as another 2...
Hi Guys, today we're looking at the trading pairs CADUSD (USDCAD) side by side. If you have been following you will have seen the chart we posted on Crude oil and calling for a reversal at the 42 dollar area and it has respected this request and the 200 SMA on the 2 month chart with lots of historical support. With the rise in crude prices expected we can now look...
Hello traders, BOC will increase interest rate, DEC job report will be better due to more jobs because the holidays, also sales will be better, oil prices is getting higher soon. We expect Trend is going down from 0.9220 NOW to 0.88 In a month. Trade safe, if it goes up high to 0.93 Then give it another sell from there, it will come back. Manage your lot size...
CAD dollar showing slight uptrend since early 16'. break out watch of triangle $SPY $EWC
Break of the upwards trend line, we have a gap as well that will probably work as an resistance. But i first want to see some rejection around the current level. So wait and see how things turn out before getting into a position here. So probably at least a few hours more before i get in, maybe even tomorrow. Previous analysis:


