#CAKE/USDT – Potential Recovery Setup Amid BNB Ecosystem Stren#CAKE
The price is moving in an ascending channel on the 1-hour frame, adhering well to it, and is heading for a strong breakout and retest.
We have a bearish trend on the RSI indicator that is about to be broken and retested, which supports the upward breakout.
There is a major support area in green at 2.70, representing a strong support point.
We are heading for consolidation above the 100 moving average.
Entry price: 2.74
First target: 2.82
Second target: 2.90
Third target: 2.99
Don't forget a simple matter: capital management.
When you reach the first target, save some money and then change your stop-loss order to an entry order.
For inquiries, please leave a comment.
Thank you.
Cakebtc

CAKEUSDT Forming Bullish MomentumCAKEUSDT is currently showing strong bullish momentum, indicating a potential shift in market sentiment toward the upside. The pair has been gradually building strength after consolidating at lower levels, suggesting that sellers are losing control and buyers are stepping in with confidence. This momentum pattern is often a signal that accumulation has been taking place and a breakout rally could soon follow, especially as trading volume continues to show steady growth and increasing participation.
Over the past few sessions, CAKEUSDT has maintained a positive structure with higher lows forming consistently, which reflects strong buying interest and improved investor confidence. The coin’s recent price behavior aligns with the broader market recovery, adding to the bullish case. With expectations of a 50% to 60% potential gain, traders may look for continuation signals confirming upward pressure and a possible breakout above key resistance zones.
Investor sentiment appears optimistic as interest in CAKE continues to grow across the market. The combination of rising volume, positive momentum indicators, and renewed confidence suggests that CAKEUSDT could be gearing up for a sustained bullish trend. As long as price action holds above support levels, the probability of an extended upward move remains high.
✅ Show your support by hitting the like button and
✅ Leaving a comment below! (What is You opinion about this Coin)
Your feedback and engagement keep me inspired to share more insightful market analysis with you!

#CAKE/USDT : Trying to break horizontal resistance#CAKE
The price is moving within an ascending channel on the 1-hour frame, adhering well to it, and is on track to break it strongly upwards and retest it.
We have support from the lower boundary of the ascending channel, at 2.58.
We have a downtrend on the RSI indicator that is about to break and retest, supporting the upside.
There is a major support area in green at 2.55, which represents a strong basis for the upside.
Don't forget a simple thing: ease and capital.
When you reach the first target, save some money and then change your stop-loss order to an entry order.
For inquiries, please leave a comment.
We have a trend to hold above the 100 Moving Average.
Entry price: 2.61
First target: 2.63
Second target: 2.66
Third target: 2.71
Don't forget a simple thing: ease and capital.
When you reach your first target, save some money and then change your stop-loss order to an entry order.
For inquiries, please leave a comment.
Thank you.

CAKEUSDTThe price of $CAKUSDT has been in an uptrend but recently dropped from its high to a correction level at $3.260. Right now, it has pulled back to $2.610, which looks like a great area to buy. This price is a good spot because it’s where the price might bounce back up, making it a smart entry point for a trade.

CAKEUSDT | Green Zone Holding StrongCAKEUSDT has solid support around the green box levels. These zones have shown clean reactions in the past, and structure still favors buyers holding the line.
If price dips into that area again with low timeframe confirmation, it could offer a high-probability entry.
No hype, just structure and discipline.
📌I keep my charts clean and simple because I believe clarity leads to better decisions.
📌My approach is built on years of experience and a solid track record. I don’t claim to know it all but I’m confident in my ability to spot high-probability setups.
📌If you would like to learn how to use the heatmap, cumulative volume delta and volume footprint techniques that I use below to determine very accurate demand regions, you can send me a private message. I help anyone who wants it completely free of charge.
🔑I have a long list of my proven technique below:
🎯 ZENUSDT.P: Patience & Profitability | %230 Reaction from the Sniper Entry
🐶 DOGEUSDT.P: Next Move
🎨 RENDERUSDT.P: Opportunity of the Month
💎 ETHUSDT.P: Where to Retrace
🟢 BNBUSDT.P: Potential Surge
📊 BTC Dominance: Reaction Zone
🌊 WAVESUSDT.P: Demand Zone Potential
🟣 UNIUSDT.P: Long-Term Trade
🔵 XRPUSDT.P: Entry Zones
🔗 LINKUSDT.P: Follow The River
📈 BTCUSDT.P: Two Key Demand Zones
🟩 POLUSDT: Bullish Momentum
🌟 PENDLEUSDT.P: Where Opportunity Meets Precision
🔥 BTCUSDT.P: Liquidation of Highly Leveraged Longs
🌊 SOLUSDT.P: SOL's Dip - Your Opportunity
🐸 1000PEPEUSDT.P: Prime Bounce Zone Unlocked
🚀 ETHUSDT.P: Set to Explode - Don't Miss This Game Changer
🤖 IQUSDT: Smart Plan
⚡️ PONDUSDT: A Trade Not Taken Is Better Than a Losing One
💼 STMXUSDT: 2 Buying Areas
🐢 TURBOUSDT: Buy Zones and Buyer Presence
🌍 ICPUSDT.P: Massive Upside Potential | Check the Trade Update For Seeing Results
🟠 IDEXUSDT: Spot Buy Area | %26 Profit if You Trade with MSB
📌 USUALUSDT: Buyers Are Active + %70 Profit in Total
🌟 FORTHUSDT: Sniper Entry +%26 Reaction
🐳 QKCUSDT: Sniper Entry +%57 Reaction
📊 BTC.D: Retest of Key Area Highly Likely
📊 XNOUSDT %80 Reaction with a Simple Blue Box!
📊 BELUSDT Amazing %120 Reaction!
📊 Simple Red Box, Extraordinary Results
📊 TIAUSDT | Still No Buyers—Maintaining a Bearish Outlook
📊 OGNUSDT | One of Today’s Highest Volume Gainers – +32.44%
I stopped adding to the list because it's kinda tiring to add 5-10 charts in every move but you can check my profile and see that it goes on..

CAKE : Like a delicious cakeHello friends
Given the entry of buyers and the creation of higher price floors and ceilings, now in the price pullback in the support areas marked with Fibonacci, there are points that can grow the price to the specified limits and in these areas I buy.
*Trade safely with us*

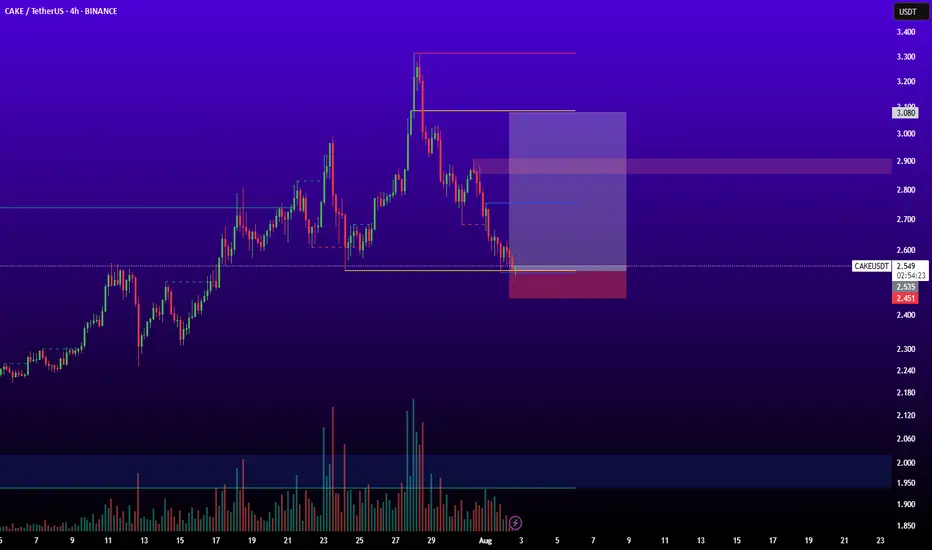
CAKEThis idea is best for person that control risk management.
entry: 2.535
sl: 2.450
tp: 2.700 - 2.900 - 3.080
#CAKE/USDT#CAKE
The price is moving within a descending channel on the 1-hour frame and is expected to break and continue upward.
We have a trend to stabilize above the 100 moving average once again.
We have a downtrend on the RSI indicator that supports the upward move with a breakout.
We have a support area at the lower limit of the channel at 2.29, acting as strong support from which the price can rebound.
Entry price: 2.30
First target: 2.35
Second target: 2.40
Third target: 2.46

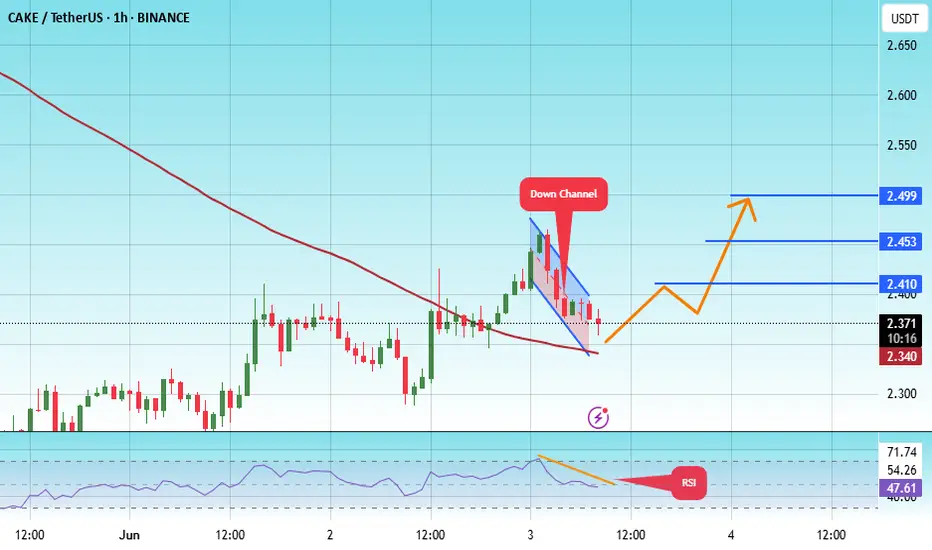
#CAKE/USDT#CAKE
The price is moving within a descending channel on the 1-hour frame, adhering well to it, and is heading towards a strong breakout and retest.
We are experiencing a rebound from the lower boundary of the descending channel, which is support at 2.35.
We are experiencing a downtrend on the RSI indicator that is about to break and retest, supporting the upward trend.
We are heading towards stability above the 100 Moving Average.
Entry price: 2.38
First target: 2.41
Second target: 2.45
Third target: 2.50
#CAKE/USDT#CAKE
The price is moving within a descending channel on the 1-hour frame, adhering well to it, and is heading for a strong breakout and retest.
We are seeing a bounce from the lower boundary of the descending channel, which is support at 2.65.
We have a downtrend on the RSI indicator that is about to be broken and retested, supporting the upward trend.
We are looking for stability above the 100 Moving Average.
Entry price: 2.72
First target: 2.82
Second target: 2.92
Third target: 3.06

CAKE is flying in its skyCAKE is just started to fly. This is just a begin to its parabola. I need to tell again that if Bitcoin remains above 100k in the following weeks, a powerful fundamental news from Pancakeswap team will send CAKE price to the moon. Remember that the Pancakeswap version 4 is scheduled to be launched at 2025, Q3.
In my opinion, CAKE will be one of the pioneer and highly gained coins at the following altseassion. May be a life changing opportunity ...
-------------------------------------
Share and follow me for further updates.

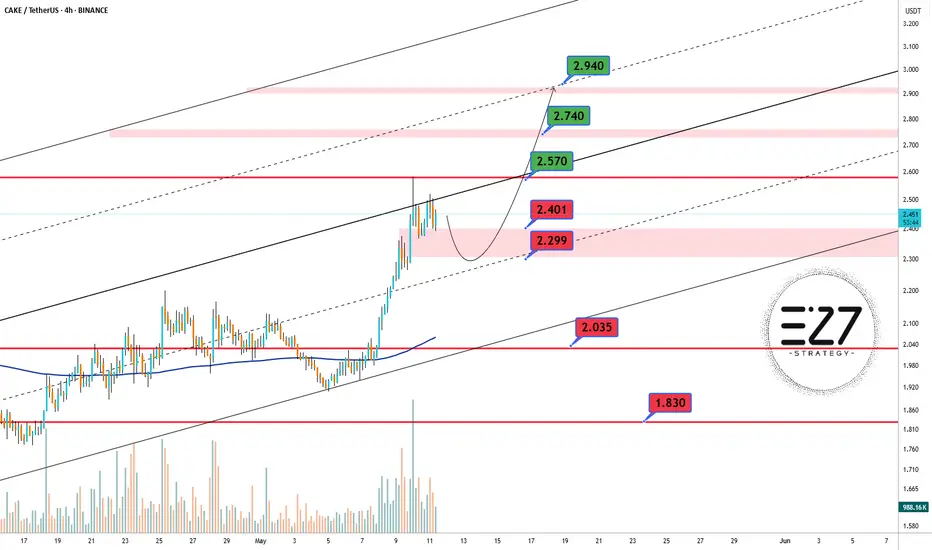
CAKEUSDT Pump📊 On the 4H BINANCE:CAKEUSDT chart, price has broken above the mid-term channel resistance and is currently pulling back. If the support zone holds, there’s potential for continuation toward higher resistance levels. A bullish reaction from the 2.299 USDT area could validate the next leg up.
🔄 If the correction deepens, the highlighted pink zone offers a strong re-entry opportunity. Key targets on the upside include 2.570, 2.740, and potentially 2.940 USDT if momentum continues.
✅ Key Support Levels:
🟥 2.401 USDT
🟥 2.299 USDT
🟥 2.035 USDT
🟥 1.830 USDT
🚫 Key Resistance Levels:
🟩 2.570 USDT
🟩 2.740 USDT
🟩 2.940 USDT
Urgent: Pancakeswap about to go Hyper-Bullish (CAKEBTC)Pancakeswap grew 6,000% vs Bitcoin back in early 2021. It took exactly 105 days, a little more than three months. Full blown bullish action. Amazing growth.
CAKEBTC. This growth happened between January and April 2021. The orthodox end of the previous bull market for Bitcoin was April 2021. So if we can extrapolate the data from the past and project it into the present market, we could say that this bull run would happen at the same time as Bitcoin produces its bull run.
It is a bit hard to explain. Let's try a different method.
Between April 2021 and February 2025 there is a clear and very strong downtrend on this pair, CAKEBTC. The pattern goes completely awry after February 2025. Volume goes off the chart. The highest buying-volume since 2021 and the pattern changes from lower lows to sideways and slowly higher.
In short, the bottom is in after almost four years.
After the bottom is in there can be nothing other than growth. The urgent happening is that growth will not be ordinary, CAKEBTC (and CAKEUSDT) will produce extraordinary growth, based on the market and this chart.
This is the best I can do. And it is my job which I love.
I can alert you of the event before it happens. It is your job to extract maximum profits from this situation. It is your job to take advantage of this situation. It is your job to win and win big.
You have my support.
You can do this brother-sister.
Namaste.

CAKE retesting done. Ready to fly?As we discussed earlier, NASDAQ:CAKE retested the resistance line successfully. Now it is ready to fly. If Bitcoin remains above 100k in the following weeks, we look forward to powerful fundamental news from Pancakeswap team (e.g. launching Pancakeswap V4) to send NASDAQ:CAKE price to the moon. Fill your bags and get ready ...
-------------------------------------
Share and follow me for further updates.

CAKE is retestingAfter a successful breakout of triangle pattern from the top side, CAKE is now going to retest the resistance line.
So far so good.
Golden long is coming soon ...
-------------------------------------
Share and follow me for further analyses.

CAKEUSDT, its my favorite coin ...Hello everyone
Everything was shown on chart
if you have any question and need help send us messages
Thank you
AA

CAKEUSDT – Patience Pays, Wait for the Blue Box!CAKEUSDT – Patience Pays, Wait for the Blue Box!
“Chasing price is how retail traders get trapped—smart money waits for the perfect entry!”
🔥 Key Insights:
✅ Bullish Structure, But Overextended – Price needs a proper retrace.
✅ Blue Box = Ideal Buy Zone – This is where smart money steps in.
✅ FOMO Kills Accounts – The best trades feel uncomfortable because they require waiting.
💡 The Smart Plan:
Wait for Price to Reach the Blue Box – No chasing, let the trade come to us.
CDV & Volume Profile Must Confirm the Entry – We need proof buyers are stepping in.
LTF Market Structure Break = Final Green Light – Precision beats randomness.
“Discipline prints money. Wait for the blue box, take the high-probability trade, and win!” 🚀🔥
A tiny part of my runners;
💼 STMXUSDT: 2 Buying Areas
🐢 TURBOUSDT: Buy Zones and Buyer Presence
🌍 ICPUSDT.P: Massive Upside Potential | Check the Trade Update For Seeing Results
🟠 IDEXUSDT: Spot Buy Area | %26 Profit if You Trade with MSB
📌 USUALUSDT: Buyers Are Active + %70 Profit in Total
🌟 FORTHUSDT: Sniper Entry +%26 Reaction
🐳 QKCUSDT: Sniper Entry +%57 Reaction

Cake 70% profitFrom the data provided, CAKE's price has shown significant volatility. Starting around 2.027 in January, it surged to 3, indicating a strong bullish trend 🚀. However, it later corrected to around 2.110, suggesting a potential support level 📉.
The signals in the chart hint at a possible buying opportunity at support levels, especially if the price holds above 2.110 🛑. If it drops below this level, it might indicate a continued downward trend 📊.
Given the high volatility, traders should exercise caution and use risk management tools like stop-loss orders 🛡️. Staying updated with market news and developments can also aid in making informed trading decisions 📰💡.

CAKEUSDT | Massive Upside PotentialThe blue box on the chart represents a potential demand zone, where buyers might be stepping in to accumulate CAKE tokens. This area often indicates a region where the price has previously shown signs of strong support or reversal, suggesting that buyers are willing to purchase aggressively at this level.
Key Observations Supporting Buyer Accumulation:
Volume Increase in the Zone: A noticeable uptick in trading volume within this zone suggests active participation, likely from buyers. Increased volume at such levels often confirms accumulation.
Price Rejection Wicks: If the candles show long wicks rejecting lower prices, it indicates that selling pressure is being absorbed by buyers.
Historical Significance: If this blue box aligns with a previously tested support zone or a Fibonacci retracement level, it reinforces its strength as an accumulation area.
Market Sentiment: Look for signs of a broader market recovery or bullish sentiment in the overall crypto space, which could encourage accumulation in CAKE.
Indicators Alignment: Tools like RSI being in oversold territory or bullish divergence can further confirm that buyers are gaining control in this zone.
What to Watch Next:
Breakout Confirmation: A strong bullish candle breaking above the resistance of the zone confirms the buyer's dominance.
Retest of the Zone: If the price revisits this area after breaking out and holds above it, it solidifies this zone as a demand level.
I keep my charts clean and simple because I believe clarity leads to better decisions. Trading doesn’t have to be overly complicated, and I enjoy sharing setups that have worked well for me.
My approach is built on years of experience and a solid track record. I don’t claim to know it all, but I’m confident in my ability to spot high-probability setups. It’s all about learning and growing together as traders, and I’m here to share what I see.
The markets can confirm what the charts whisper if we’re paying attention. I hope these levels help you as much as they’ve helped me in the past. Let’s see how this plays out!
Why follow me ?
🐶 DOGEUSDT.P: Next Move
🎨 RENDERUSDT.P: Opportunity of the Month
💎 ETHUSDT.P: Where to Retrace
🟢 BNBUSDT.P: Potential Surge
📊 BTC Dominance: Reaction Zone
🌊 WAVESUSDT.P: Demand Zone Potential
🟣 UNIUSDT.P: Long-Term Trade
🔵 XRPUSDT.P: Entry Zones
🔗 LINKUSDT.P: Follow The River
📈 BTCUSDT.P: Two Key Demand Zones
🟩 POLUSDT: Bullish Momentum

CAKE ROADMAP (1W)It seems that the CAKE token has likely completed a diatonic structure on higher timeframes and has transitioned into an ABC or potentially a more complex pattern.
Wave C of this new structure could initiate within the highlighted green zone. Wave C is anticipated to be bullish.
However, if a 3-day candlestick closes below the specified invalidation level, this analysis will no longer hold valid.
For risk management, please don't forget stop loss and capital management
When we reach the first target, save some profit and then change the stop to entry
Comment if you have any questions
Thank You

Signal for CAKESignal for CAKE/USDT 🎯
Entry Point (Buy):
📉 1.912 - 1.930
This is the suggested buy range based on support and the ascending channel.
Take Profit Targets (TP):
🎯 TP-1: 1.929
🎯 TP-2: 1.952
🎯 TP-3: 1.974
🎯 TP-4: 2.000
Stop Loss (SL):
❌ 1.895
If the price breaks below this level, it's recommended to close the position.
🚀 Summary:
The price is in an uptrend inside an ascending channel, and entry at the current support levels could lead to potential profit if the targets are hit. If the support fails, the stop loss will limit the downside risk.

CAKE : buy in low Analysisfor CAKE/USDT
Author: ahmadarz
In this analysis, we are reviewing the CAKE/USDT pair. According to the provided chart, the price is at the lower support area of the trading range, and the entry point is specified.
Key Points:
- Entry Point: 1.943
- Target Prices (TP):
- TP-1: 1.966
- TP-2: 1.989
- TP-3: 2.014
- TP-4: 2.042
- TP-5: 2.087
- Stop Loss (SL): 1.917
- Explanation: The best position to enter a buy trade is in this support area. Target prices are specified sequentially, and the stop loss is determined in case the support area is breached.
Caption:
🔍 Analysis of CAKE/USDT: The price is in the lower support area of the trading range. The entry point is set at 1.943, and target prices are specified. 📈
Warning: This trading signal is based solely on technical analysis, and the trader is responsible for any decisions made.

CAKE looks bearishFrom where we placed the red arrow on the chart, it seems that the CAKE correction has started and wave A has ended and we have entered wave B.
Wave B is a zigzag diamond pattern.
We are looking for sell/short positions in the red range.
Closing a daily candle above the invalidation level will violate the analysis
For risk management, please don't forget stop loss and capital management
When we reach the first target, save some profit and then change the stop to entry
Comment if you have any questions
Thank You
