EUR USD Bullish Trend in 1 HR TF OANDA:EURUSD In the 1 Hr TF, we see the Bullish Trend starting. The Hammer and Bullish engulfing candle shows on charts that is good sign for go Upside movement. Or break the previous H.H more confirmation to the Upside.
Candlestickpattern
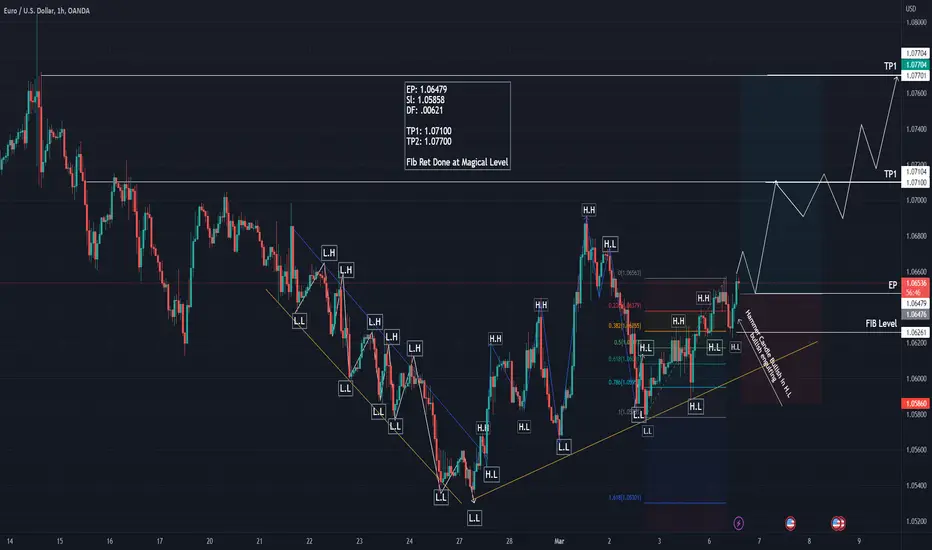
GBP USD BULLISH TREND IN 1 HR TF OANDA:GBPUSD In the 1 Hr TF, we see the Bullish Trend starting. The Hammer candle shows on charts that is good sign for go Upside movement. Fib Ret Level also Done at Magical Number.

SPX: About to Correct? Next Key Points to Watch.• The SPX hit its resistance at 4,060, and now it seems it is losing strength;
• In the daily chart, we see a Shooting Star candlestick pattern, that if triggered, could take the index to lower levels;
• In the 1h chart, the SPX is correcting, and the next support is the 21 ema, which is ascending;
• The 21 ema in the 1h chart is almost at the same price the 21 ema in the daily chart is, making this a dual-support area;
• If the index loses this dual-support, I see a sharper correction to the 50% Fibonacci’s Retracement, near the 4k. The 4k is an important psychological key point for the index as well.
Remember to follow me to keep in touch with my daily analysis!

EURUSD before Powell Today is the first of two days of Jerome Powell press conferences.
Depending on the comments, it is possible that we will see larger swings that will provide new opportunities.
At this stage we have no deals and are not looking for new entries.
We are looking at buying opportunities in EURUSD after a correction or after a break and test of 1.0700.
We will search for new trades only after confirmation!
In an impulse decline, no buys are sought!

bull/bear idea If price breaks resistance at 22,590 I will open a long trade with 1% risk of my account value to try to make 3%.
If price breaks support at 22,240 I will open shorts risking 1% of my account value to try to make 3%.

Gaining Uptrend Momentum!The candlestick indicates a divergence signal due to buying interest from the traders. Hence, making a significant price movement in the stock price and closing above the MA line.
The MACD and RSI indicators indicate a divergence signal, thus, conforming to the candlestick trendline.
Precaution for a price correction between 5% to 10% from the recent high peak due to a short position from the traders.
Let's save MIKROMB in the WL and watch out for significant price movement with volume.
R 0.200
S 0.165

GBP JPY Bearish Trend Starts in 1 Hr TFOANDA:GBPJPY We can see Bearish Trend start in 1 Hr TF. Shooting Star Showing good sign for rejection

AUDCHF Bearish Trend 1 HR TFOANDA:AUDCHF Bearish Trend 1 HR TF . You can see that Bearish trends continue in this pair. I'm Expecting AUDCHF create new L.L. Shooting Star Create in 1 Hr TF

SPX: Bullish Reaction Above Golden Cross.• The SPX is doing a very powerful reaction above a critical support level;
• First, as seen in the daily chart, it hit the 3,949 support, and it is doing a powerful reaction. Last Thursday it did a Bullish Engulfing, and las Friday, it broke the 21 ema and the 4k;
• In the weekly chart, it is doing a Hammer candlestick pattern, a bullish reversal pattern that works 60% of the time (according to Bulkowski – Encyclopedia of Candlestick Charts);
• In addition, this Hammer appeared just above the purple line, which was a previous resistance when the SPX was inside a Descending Channel;
• Moreover, this Hammer appeared above the 200 ma, after the index made a Golden Cross (the 50 ma broke the 200 ma upwards);
• All these signs indicate that although the index may look overbought short-term wise, it has decent chances of maintaining the bullish bias mid/long-term speaking, especially if look at the weekly chart;
• I’ll keep you updated on this.
Remember to follow me to keep in touch with my daily analysis!

An important week for EURUSD Several impactful news coming up this week that will determine the trend.
We’re monitoring the opportunities for starting an up trend but there is still no grounds for entry.
Upon another decline back to 1,0550 we will watch for a reaction and this could be the first opportunity.
EURUSD is currently on an important resistance and we’re watching for a pullback.

258pips of profits that you had missedIf you have missed the Bearish ABCD Pattern, you would have missed 258pips of profits. One of two ways you can do this is to wait for the market retest at 1.7979 and ensure an RSI Divergence with a 3-bar reversal before engaging the trade.

If you miss the Crab, read thisIf you missed the Bullish Crab Pattern on the 4-hourly chart(right), the Bullish Gartley Pattern could be the next best thing that could happen for you.
A retest to 0.9126 on the Bullish Gartley Pattern(left) could get you back on track.

Trendline meetsOn the Daily Chart (right), we have the potential Bullish Flag Pattern forming. If Flag Pattern didn't happen, a retest on the support line at 1.1937 with an RSI Divergence gives traders who are looking for a buying opportunity a push to enter the trade.
On the 4-hourly chart(left), the parallel channel meets at the same price region of the daily chart at 1.1932, which definitely brings me interest in waiting for a retest and waiting for a buying opportunity.

USDCADHi guys!"
USDCAD has been examined in different dimensions:
1- Strong supply and demand levels that I identify with my own indicator and system.
2- The structure of recently formed waves
3- Current market momentum
4- The structure of classical and price patterns
In this idea, I identified the direction of the market in different ways and in the second step, I analyzed the potential of continuation or reversal. Usually, paying attention to the trend and strength of the trend can greatly increase the accuracy of the analysis.
In general, I tried to describe the continuation of the movement in the simplest possible way in the diagram.
⚠️ Disclaimer:
This is a personal opinion and you are responsible for any trading decisions.

Opportunity to buy some Gold$1824.47 is a Great price for me to engage the Gold on a buying opportunity, especially a Bullish Shark Pattern has shown me an opportunity to get involved.
Normally I don't like to engage the trade on a Friday evening(SGT), but a trade like this with RSI Divergence it's hard to say no.

EURUSD has no strength to reverse Yesterday we commented on possible EURUSD reversal.
The possible entries were upon breakout of 1,0700 or after a correction.
Non of them were confirmed and a decline followed, showing us that EURUSD does not have the strength to reverse the trend now.
In this case it’s more likely to see breakout of the bottom at 1,053.
The next supply level is 1,0440.

SHUSHI USDT Bearish trend 1 HR TFBINANCE:SUSHIUSDT In the 1 Hr TF, we see the bearish Trend starting. The bearish engulfing candle shows on charts that is good sign for down side movement.
Or break the previous H.L more confirmation to down side.

A possible EURUSD trend reversal Yesterday we saw a momentum move in the EURUSD, which broke above the previous high of 1.0645.
Thus, we have higher bottoms and higher tops of H1.
All sales should be closed and we are looking at buying opportunities.
The reversal has not yet been confirmed and there is no need to rush into new trades.
There will be suitable opportunities during a correction or after a break and test of 1.0700.

QNT USDT Bullish Trends in 1 HR TF.BINANCE:QNTUSDT Bullish trend start in QNT USDT in 1 Hr TF. Bullish Candle stick Pattern shows QNT Break the Higher High.

Bullish Trends Start in 1 HR TF for TRB USDTBINANCE:TRBUSDTPERP
Bullish Trend starts in the 1 Hr TF. In this case, the bullish engulfing candle shows that buyers are dominating the market and pushing the price upward. TRB tries to break previous H.H levels.
EP 18.32
SL 17.27
DF 1.05
TP1 19.37
TP1 20.42

XAUUSD (GOLD) PERFECT BEARISH SETUPOANDA:XAUUSD
HI , TRADER'S ..As we predicted , market reached our TP
now market is trading in support and resistance zone
1823$ to 1845$ range , Market can stay in this range for couple of day's
Sell at resistance and buying at support recommended
❤️ Please, support my work with follow ,share and like, thank you! ❤️


Sales on EURUSDYesterday EURUSD made another move towards 61,8 and pulled back.
These were the first selling opportunities.
We’re now expecting a small correction and another decline.
The first target is breakout of the previous low at 1,0537.
Upon reaching that level it’s recommended to lower the risk.
The ultimate goal remains unchanged and we expect reaching 1,0440.
