🔎 A Look Inside The Candlestick Chart📍What Is a Candlestick?
The formation of the candle is essentially a plot of price over a period of time. For this reason, a one minute candle is a plot of the price fluctuation during a single minute of the trading day. The actual candle is just a visual record of that price action and all of the trading executions that occurred in one minute.
[b📍Who Discovered the Idea of Candlestick Patterns?
It is commonly believed that candlestick charts were invented by a Japanese rice futures trader from the 18th century. His name was Munehisa Honma.
Honma traded on the Dojima Rice Exchange of Osaka, considered to be the first formal futures exchange in history.
As the father of candlestick charting, Honma recognized the impact of human emotion on markets. Thus, he devised a system of charting that gave him an edge in understanding the ebb and flow of these emotions and their effect on rice future prices.
📉Bearish Candle
🔹 Open Price: A bearish candlestick forms when the opening price of a currency pair is higher than the closing price of the previous candlestick.
🔹 High and Low Price: During the candlestick's time frame, the price moves higher than the opening price and then declines to form a lower low than the previous candlestick.
🔹 Body: The body of the bearish candlestick is colored red and represents the difference between the opening and closing price. The longer the body of the candlestick, the stronger the bearish sentiment.
🔹 Upper Shadow: The upper shadow of the candlestick represents the highest price achieved during the candlestick's time frame. The longer the upper shadow, the greater the bearish pressure.
🔹 Lower Shadow: The lower shadow of the candlestick represents the lowest price achieved during the candlestick's time frame. The shorter the lower shadow, the stronger the bearish sentiment.
📈Bullish Candle
🔹 Open Price: A bullish candlestick forms when the opening price of a currency pair is lower than the closing price of the previous candlestick.
🔹 High and Low Price: During the candlestick's time frame, the price moves lower than the opening price and then rises to form a higher high than the previous candlestick.
🔹 Body: The body of the bullish candlestick is colored green and represents the difference between the opening and closing price. The longer the body of the candlestick, the stronger the bullish sentiment.
🔹 Upper Shadow: The upper shadow of the candlestick represents the highest price achieved during the candlestick's time frame. The shorter the upper shadow, the greater the bullish pressure.
🔹 Lower Shadow: The lower shadow of the candlestick represents the lowest price achieved during the candlestick's time frame. The longer the lower shadow, the greater the bullish sentiment.
👤 @AlgoBuddy
📅 Daily Ideas about market update, psychology & indicators
❤️ If you appreciate our work, please like, comment and follow ❤️
Candlesticksignals

GBP JPY Long Trade Setup in in Hr TF. OANDA:GBPJPY long Trade Setup Support & Resistance Level. GBP JPY Bullish Candle show in chart. Showing Some Good Strength toward move price upwards.


EURCAD LongWe have a bullish market structure, where the price managed to make 3 touches of ascendinding trend line and closed above daily support level.
Currently i'm waiting for the price to retrace the 1.465 level which is also a 4h-50% of fibonacci retracement tool to take long position after getting candlestick signal for confirmation.

GBP USD BULLISH TREND IN 1 HR TF OANDA:GBPUSD In the 1 Hr TF, we see the Bullish Trend starting. The Hammer candle shows on charts that is good sign for go Upside movement. Fib Ret Level also Done at Magical Number.

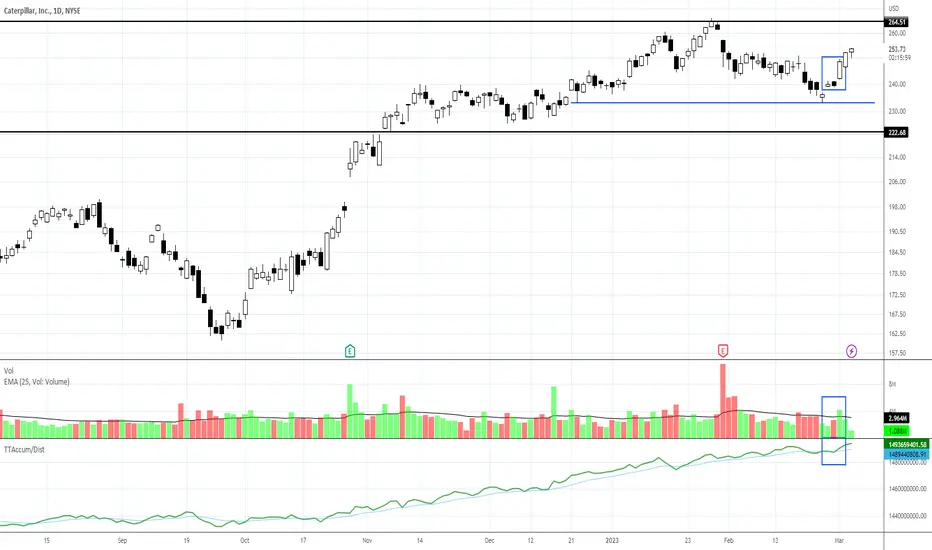
CAT: Range Bound Swing TradingCAT developed one of the entry signals I teach this week. The stock rebounded from testing the lows of the trading range. Hybrid indicators suggest large-lot buying is triggering in the lows of the range.
Point gain potential may be limited by the sideways trading range developing, but swing trading can be done within the range if you can catch the entry early in the upswing from the lows and plan to exit near the highs.
This trading range will need to compress near the highs to sustain a breakout to the upside.
Magic of Morning Start Pattern on Higher TF - Bank NiftyMorning & Evening Star gives magical results. Early identification in BNF long move was visible on daily TF, if we could have spotted it right! What a move later on!

MCXMCX made bullish pin bar candle on daily charts & its trading above yesterday's close with good volumes.
Could be bought with mentioned stoploss & target.

📊 Candlestick CheatsheetCandlestick charts are commonly used in trading to analyze market trends and make trading decisions. Candlesticks can be categorized as bullish or bearish, depending on whether the price has increased or decreased over a given period.
It is important to note that while candlestick patterns can be useful in predicting market movements, they should not be used in isolation, and other indicators and analysis should also be considered. It is also important to have a clear understanding of the market and its underlying fundamentals before making any trading decisions.
🔹 Rails
The rails pattern is a two-candlestick pattern that typically occurs during a downtrend. The first candle is a long red candle, followed by a long green candle that opens below the previous day's close but closes above it, creating a rail-like pattern.
🔹 Three White Soldiers
The three white soldiers pattern is a bullish pattern that consists of three consecutive long green candles with small or no wicks. It typically occurs after a downtrend and suggests a reversal in the market's direction.
🔹 Three Black Crows
The three black crows pattern is a bearish pattern that consists of three consecutive long red candles with small or no wicks. It typically occurs after an uptrend and suggests a reversal in the market's direction.
🔹 Mat Hold
The mat hold pattern is a five-candlestick pattern that occurs during a bullish trend. It consists of a long green candle, followed by three small candles with lower highs and higher lows, and ending with another long green candle.
🔹 Pinbar
The pinbar pattern is a single candlestick pattern that has a long tail or wick and a small body. The tail should be at least two times the length of the body. The pattern suggests a reversal in the market's direction.
🔹 Engulfing
The engulfing pattern is a two-candlestick pattern that occurs when the second candle's body completely engulfs the previous candle's body. A bullish engulfing pattern occurs during a downtrend and suggests a reversal in the market's direction, while a bearish engulfing pattern occurs during an uptrend and suggests a reversal in the market's direction.
🔹 Morning Star
The morning star pattern is a three-candlestick pattern that typically occurs after a downtrend. It consists of a long red candle, a small candle, and a long green candle, with the small candle gapping down from the previous day's close. The pattern suggests a reversal in the market's direction.
🔹 Evening Star
The evening star pattern is the opposite of the morning star pattern and typically occurs after an uptrend. It consists of a long green candle, a small candle, and a long red candle, with the small candle gapping up from the previous day's close. The pattern suggests a reversal in the market's direction.
👤 @algobuddy
📅 Daily Ideas about market update, psychology & indicators
❤️ If you appreciate our work, please like, comment and follow ❤️

CADCHF: potential long moveHere is my view on CADCHF-
1.A long position can be made now as we broke the DTL and now price is retesting it again + 4H 50EMA. It is riskier because the price has not yet broken the daily 50EMA and the current resistance zone (~0.69200), but it gives a slightly better entry for a long position
2.If you want to be more conservative, just wait for a breakout of the current resistance zone and Daily 50EMA and the retest of it for entry
Here is how daily looks like:

AUDCHF long setup This is a very good looking setup, we have POI with:
1. Already reversed trend, now we have series of HHs and HLs
2. daily 50EMA
3. 61.80% fib level of previous leg
4. Structure
As aways, candle rejection is needed for entries, so if the price makes consolidation at this level, I will for sure jump in longs.

EURUSD: upcoming bearish moveLike GOLD, I think EU will break the ATL and the daily 50EMA and continue downward. I think so because of what the last few daily candles are showing and the 4H chart already shows a breakout and retest of ATL, so maybe at this point a slightly riskier short position could be made or just wait for a breakout to confirm the direction of the price for more conservative entry ;)
Here is what the 4H looks like:

DXY: PREPARE FOR THIS !!! Guys listen now, DXY is sitting on a veeery delicate level and any significant move will heavily determine the direction of every USD involved pair.
So first let me put down the important indicators and levels:
1. On 103.800 lays Daily 50EMA right above the current price
2. On 104.100 lays Weekly 50EMA slightly above the current price
-We can say that they are pretty damn close
3. Price is sitting on current major S/R zone
4. There is also 61.8 % fib level of previous leg
After clearing this you see why the price is in a very tight zone so this week we will most likely see a breakout on either side so get ready because we might see some pretty good moves after that.
So what's my POV: I expect to see a bullish breakout and continuation, because everything suggests that in my opinion. Of course we can see a bounce from the current level and continuation to the downside.
I will make sure to update everything here ;)

AUDUSD possible long moveAN offers a really good long setup. The confluences are:
1.ascending channel
2.break and retest of S/R zone
3.daily AND weekly 50EMA laying on this level
4.61.8% fibs
So we just need to see rejection candles at POI for entries.
The only thing I don't like is the bearish momentum. The last daily candle is Marubozu candle, a very dominant candle sooo I'll be looking for STRONG 4H rejection candles or daily candle before jumping in longs!
It could easily penetrate the zone, so be careful with entries.

XAUUSD short term long A very risky trade, but if I see a consolidation at this level or lot of wicks I will jump in a long position. Basically the daily 50EMA is laying exactly at this strong level of S/R so we might see a reaction from it. This setup is entirely dependent on the following 4H or daily candles.

GBPAUD short setupOn a daily time frame, GA has formed H&S and it's in a downtrend, so overall bearish setups are preferred.
Price is now on a very good position for sells, we have:
1. Clear downtrend
2. Retesting a structure
3. 4H 50EMA
4. 50% fibs
5. Bigger pattern in play
All I want so see is 30m wedge or pennant just so price can move sideways to touch the trend line, and ofc this can be a sign for a rejection from this level.

EURAUD short moveEA is in a descending channel and it has reached the ceiling of it, also a zone of S/R.
30m range/wedge/pennant or wicks at this level will be signal for shorts.

DXY: what I want to see for AUDUSD, GOLD, EURUSD long ! Hello guys, I've put ghost candles on the chart to show you what I want to see to support my Gold, EU, AU long setups.
So DXY approached very crucial zone now, there is a current strong level of S/R, a 61.8% Fibonacci level and a daily 50EMA.
Right now the bullish momentum is very strong, so I will wait to see if the confluences I mentioned are strong enough to hold the level.
If I see a daily closure above these confluences, I'll cancel all my XXXUSD setups, because they would be invalidated.

EURCAD possible scenarios EURCAD 2 possible scenarios in my opinion:
So the price is about to reach important zone of S/R and there are 2 options:
1. If we see a reaction from this level: small range, consolidation, wicks, etc. ... I will look for longs with nice RR.
2. A strong closure under the support suggests a bearish move, so I will make entry on the pullback.
IF price makes some weird shit, which is far from what I expect, I will stay away from it.

PLATINUM short term long setupSo, we are at the bottom of the descending channel + a very strong support level. We might see one more bounce or 4H hammer candle before going up and to be honest that's the optimal play we look for. The price can actually smash this zone and if it does so, I will shift my bias and will look for pullbacks for short.

GBPAUD short term longAlright, here is one cheeky setup that can possibly be played out.
So we have POI with:
1. 4H 50EMA
2. zone of S/R
3. 3rd touch of ATL
4. 61.8% fib level
All we need is 1H-4H rejection candles to be sure that this zone is respectable, so we can make entries from there ;)

Platinum long scenario Oke guys, I'm going to watch this for potential long if price give us second touch of the ATL, it showed good rejection at first touch and now I'm looking for a pullback to POI and if it comes to the marked zone, I will wait for 4H rejection candles and after that I'll consider buys.
Confluences are:
1. Daily 50EMA touch
2. Nice break and retest of S/R zone
3. Bullish trend on 4H, D, W
4. 61.8% fibs
5. initially it showed rejection at the first touch of daily 50EMA
Technically its looking good, but remember that we jump in longs only if we see a good 4H rejection candles at marked zone

HINDUSTAN ZINC - DAY CHART - 09.01.2023 - BAHAVAN CAPITALHINDUSTAN ZINC as per Day Chart Analysis Stock
ABOVE 345 TARGET 350
Today FII Net selling had come down considerably to 203.13 Cr and DII Net Buying increased to 1723.79 Cr.
Nifty Once Breaks the resistance at 18169 then the target is 18240 level.
Bank Nifty Once Breaks the resistance at 42716 then the target is 42932 level
Tomorrow Market trend to be on the positive side..
Happy Profitable Trading to all...
