$ONDS Dead Cat BounceI'm bullish long term on this stock, but planning to trade this DCB in the short term. I loaded up shares with a cost avg of $8.90 and I'm planning to take profits around $10.50. There was a similar pullback last year where the stock fell over 40%, bounced hard +30%, then faded to make the total pullback almost -60%. Looking for a similar move here where I can take profits on these shares, then reload for a long term position if we can get back into the $7 channel.
CAT

Gold's "dead cat bounce" or bottom? Critical test at $5,150!Gold is attempting a recovery after scooping up stop losses near $4,400, but don't get too comfortable. This looks like a classic Dead Cat Bounce pattern.
In this video, we analyse whether this rebound is a genuine bottom or just a technical correction before the next leg lower.
Context
We dissect the volatility driven by the "Buy America" trade pause and the market's reaction to Trump's nomination of Kevin Warsh as Fed Chair. With margin hikes from the CME adding pressure, the technicals are now the primary guide.
Key topics:
Fundamentals : Why traders took profits on the dollar surge and how the market is digesting new Fed leadership risks.
Daily chart:
RSI reset : Momentum has reset to neutral, with hidden bullish divergence at the lows.
The "Dead Cat" zone : The rally has cleared the 38.2% Fib and is heading towards the 50% retracement near $5,000.
Invalidation level : A break above the 61.8% Fibonacci ($5,150) significantly reduces the chance of a Dead Cat Bounce and could signal a sideways consolidation or Triangle pattern. Weekly & 4-Hour structure :
Weekly channel : Price is reacting to the median line of the long-term channel. A rejection here keeps the bearish double-bottom scenario in play.
Elliott Wave scenarios : We explore two paths—a leading diagonal (wedge) that corrects before rallying, or a more impulsive bullish breakout if resistance fails.
Trade plan:
Bearish case : Rejection at $5,000 leads to a retest of $4,400.
Bullish case : A break above $5,150 opens the door to $5,350 and potentially new highs.
Key support : Watch $4,800 as the critical short-term floor.
Is this a trap or a reversal? Let us know in the comments!
This content is not directed to residents of the EU or UK. Any opinions, news, research, analyses, prices or other information contained on this website is provided as general market commentary and does not constitute investment advice. ThinkMarkets will not accept liability for any loss or damage including, without limitation, to any loss of profit which may arise directly or indirectly from use of or reliance on such information.

BTC | Dead Cat Bounce...You know what it is?Hello traders,
They say "even a dead cat will jump one more time if it falls too hard"
If you don’t know what a dead cat bounce is, this is not the environment to learn it the hard way. This is actually a classic bear market behavior.
That bounce feels super bullish. It breaks market structure. It gives all bullish signs. Looks constructive, and traps late longs. But structurally, nothing has changed. The bear market is only beginning.
In bear markets, rallies are designed ONLY to create hope. They exist to rebalance, mitigate liquidity, and offer smart money better short entries.
----------------------------------------------------------------------------------
Take what happened in March, 2022 as an example
Triple resistance rejections, followed by a break of structure, followed by a dead cat bounce. Then, bearish continuation...
----------------------------------------------------------------------------------
I have published an idea here on TV back in Nov, 2025 and it went super viral that everyone now adopts in on X
This dead cat bounce will confirm my thesis. From current prices to ~105-108k are PERFECT swing short entries.
----------------------------------------------------------------------------------
When and ONLY when price breaks $108k and holds, my thesis will change to bullish. But, I dont reckon.
Good Luck!
Please support this idea with a like and share your thoughts down in the comments.

Can Yellow Iron Become Digital Gold?Caterpillar Inc. stands at a historic inflection point in 2026, simultaneously threatened by geopolitical chaos and empowered by artificial intelligence. The company faces a $1.75 billion tariff hit stemming from U.S.-EU trade warfare over Greenland's rare earth elements, directly compressing operating margins and forcing supply chain bifurcation. Yet this same Arctic conflict positions Caterpillar as the default infrastructure provider for Western mining operations in one of the world's harshest environments, where its cold-weather engineering expertise and autonomous Cat Command systems create an unassailable competitive moat.
The strategic metamorphosis from commodity-cycle dependent machinery maker to "Physical AI" provider represents management's most ambitious pivot. Through deep integration with NVIDIA's Jetson Thor platform, Luminar's LiDAR technology, and the Helios digital backbone aggregating data from 1.4 million connected assets, Caterpillar is embedding intelligence at the edge of industrial operations. The company's patent portfolio reveals aggressive R&D in autonomous excavation and hydrogen fuel cell optimization, while the appointment of electrification expert Rod Shurman to lead Construction Industries signals that the energy transition has moved from experiment to core strategy. The 793 XE battery-electric mining truck at BHP's Australian operations demonstrates technical viability, though the hydrogen stationary power success at Microsoft data centers may prove more immediately scalable.
The market struggles to reconcile Caterpillar's 32x earnings multiple with traditional cyclical machinery valuations, yet secular tailwinds from data center construction and global mining capex cycles support a technology-industrial premium. The North American infrastructure boom and AI-driven power generation demand offset weakness in European manufacturing and the Chinese real estate collapse. While cyber-physical vulnerabilities and the Bobcat patent litigation present meaningful risks, the company's transformation from a horsepower vendor to a computing power provider appears irreversible. For long-term investors, the volatility from Arctic trade disputes will create superior entry points around $580, making Caterpillar an accumulation opportunity in the digitization of the physical industry.

BTCUSD | Price is overextended. Too dangerous to longHello traders,
I believe BTC will correct down to target $91.4k~$92.8K range before it continues moving up
Targets:
98k - 103k - 107k -
I will not short this move down
I will only look to long at 91.4k~$92.8K at these ranges
My overall thesis for BTC still bearish
Good Luck!

Caterpillar: New Upward MomentumOver the past two weeks, Caterpillar's stock has climbed steadily, recording gains of around 15%. We anticipate further increases into our red Short Target Zone between $687.01 and $727.83, where we identify the peak of the overarching blue wave (I). Once this top is reached, a more significant correction may begin. However, if CAT breached the support at $537.08 before reaching our Target Zone, it's likely that the magenta wave alt.(4) will forge a deeper low (probability: 31%).

Caterpillar: Rollercoaster RideCAT has been notably volatile recently. Following a sell-off of more than 11%, a countermove took place, but currently, the stock is consolidating within a tight sideways range. In our primary scenario, we expect renewed upward impulses that should carry price into our red Short Target Zone between $687.01 and $727.83, where we anticipate the high of the overarching blue wave (I). Once this zone is reached, a more pronounced corrective movement is likely to begin. Additionally, we've illustrated an alternative scenario: If the support at $537.08 is broken, the magenta wave alt.(4) could form a lower low (probability: 35%).

Bitcoin Imminent 2D Death Cross🔴The Bitcoin 2-day chart is approaching a death cross in the coming days.
While volatility has remained relatively stagnant since price retested the Weekly 100 EMA (around 85k🎯) in late November, it may spike as the death cross forms. The key support level to watch is a break below that W100 EMA, which would likely target the April lows of 77k-74k🎯.
🔵The next major resistance upon finding support is the Weekly 21 EMA, currently in the 100k-103k🎯 zone (In confluence with the 2D death cross zone)
🔵In summary, the overall structure remains bearish, though a corrective move upward is possible before any sustained downtrend resumes in the coming months.
Disclaimer: This is a hypothetical framework for educational purposes only and does not constitute financial advice. It is not a guaranteed predictor of future market performance. Always conduct your own research and understand the risks involved before making any investment decisions.

$CAT Tradespoon – Long Setup $586.19Tradespoon model signals a long bias for NYSE:CAT . Predicted range: $586.19–$593.97. Trend: +0.91%. NYSE:CAT

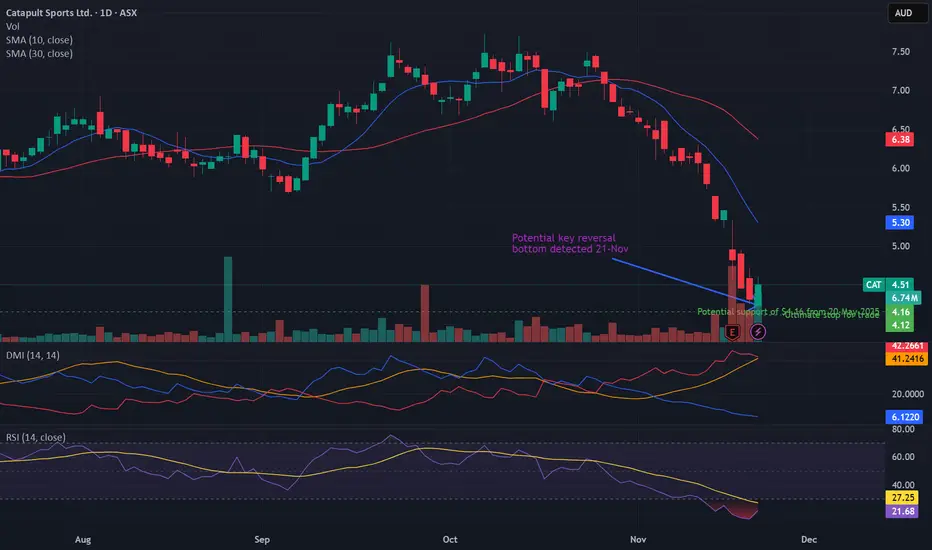
Potential key reversal bottom detected for CATAwait signals for entry such as DMI/ADX and/or RSI swing to the bullish direction.
Stop loss for the trade involving ASX:CAT (and indication that this trade is an absolute 'no-go') is any trade below the low of the signal day of 21st November (i.e.: any trade below $4.13).
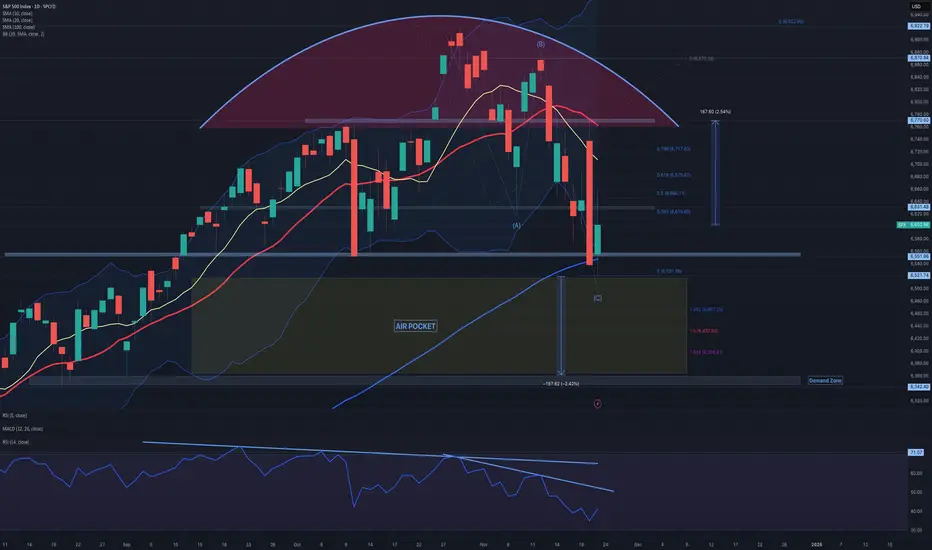
$SPX: dead cat bounce SP:SPX : Following the unexpected downturn on Thursday, SP:SPX stabilized last Friday after an intraday decline below the horizontal support at 6,550, which aligns with the 100-day simple moving average (SMA). The candlestick wicks on the daily chart suggest a potential short-term pause in the prevailing selling pressure. Monday will probably see a continuation of the rebound from Friday’s lows; however, it remains unclear whether Friday’s low marks the end of the current pullback. The RSI14 is approaching, but not yet within, oversold territory, and does not exhibit positive divergence. For the upside scenario, retracement levels from Friday’s high have been identified. Bulls must first reclaim the 6,530 resistance to maintain momentum; nevertheless, unless the key resistance at 6,770—168 points above Friday’s close—is breached, the probability of another downward move remains elevated, targeting the 6,360–6,340 region.
$CAT Tradespoon – Long Setup $563.55Tradespoon model signals a long bias for NYSE:CAT . Predicted range: $555.07–$592.57. Trend: +0.56%. NYSE:CAT

Two-phase FOMC reaction on EURUSD explained: Where next?EURUSD experienced a classic "dovish-then-hawkish" whipsaw following the Fed's 25bp cut. The Initial dovish reaction saw the fibre surge above 1.19 to multi-year highs as the dot plot showed 50bp additional cuts vs expected 25bp in 2025. However, Powell's hawkish presser reversed gains within the hour, describing the cut as "risk management" rather than an aggressive easing cycle start.
EURSD is finding support at 1.1778 (previous high), with the price having taken out the 100% Fibonacci extension from August lows. Critical support sits at 1.1740, with a break below invalidating the bullish bias.
Bullish Scenario
Targets : 1.1830, 1.1866 (critical level), then 1.2000-1.2032
Triggers : Hold above 1.1778, break above 1.1866
Rationale : ECB-Fed divergence theme intact with ECB holding, while Fed cuts
Bearish Scenario (Potential Dead Cat Bounce)
Targets : 1.1750, 1.1730
Entry : Short at 61.8% Fibonacci retracement (~1.1832)
Stop : Above 1.1878
R:R Ratio : 3.38
Where next?
ECB pause vs Fed easing supports underlying bullish EUR/USD theme despite near-term volatility. But the next FOMC meetings are more critical as Powell emphasised a "meeting-by-meeting" approach. Current pullback is likely a retracement before a potential continuation higher, but watch for rejection at the weekly trendline resistance shy of 1.20.
This content is not directed to residents of the EU or UK. Any opinions, news, research, analyses, prices or other information contained on this website is provided as general market commentary and does not constitute investment advice. ThinkMarkets will not accept liability for any loss or damage including, without limitation, to any loss of profit which may arise directly or indirectly from use of or reliance on such information.

CAT - ASCENDING TRIANGLE BREAKOUT#1000CAT - Bullish breakout daily ✅🚀
As expected few days ago, price is tanking!
📈Ascending triangle breakout
📈Double bottom daily
📈Bullish trend ichimoku
Market looks also good to see a 10 - 15% bull move on #CAT !
#altcoins #1000cat #MEME

GME §8-)OK boys and girls – a little weekend fantasy for you (sneaky giggle 😏).
See those pink zones?
Notice what happened every time the market broke out there?
Now look at the whole width of those zones (highlighted in green).
What if that entire fat chunk is actually one giant buy zone? A monster pit where smart money is scooping up loads… quietly, secretly…? 🤔💸
Alright, enough daydreaming:
Don’t FOMO 🚫🐑
Have a happy weekend 😎🎉

RCAT - Red Cat Holdings - $12.81 PTNASDAQ:RCAT has been consolidating from it's $12.81 since reaching that price level back in July '25. It's been having issues breaking above the $10.12 Price Level of Resistance, but if it does and finds support, we could see this running back to retest the $12.81.
This comes after Red Cat Drones are added to the NATO Catalog. With the recent upticks in concerns in the Middle East, as well as Europe, that could be a catalyst to continue pushing RCAT further up.

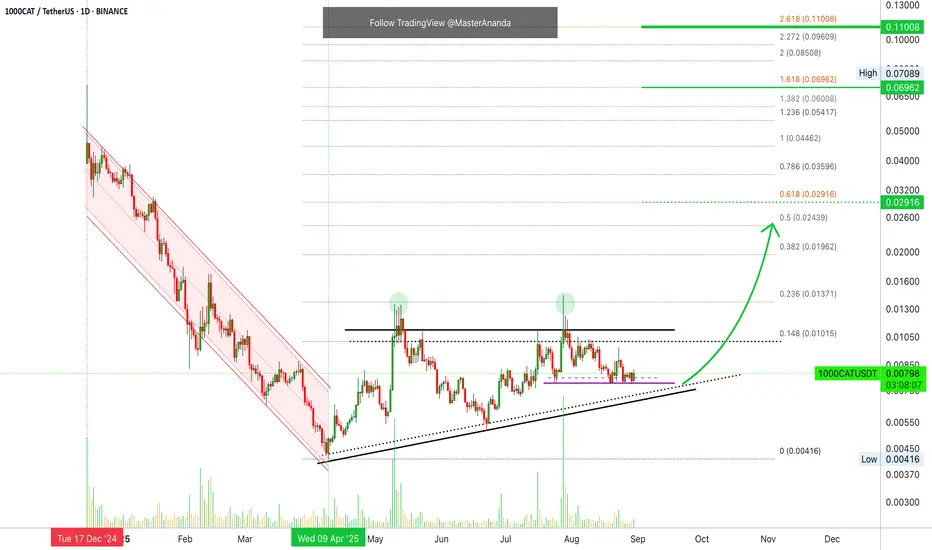
1000CAT Bullish Price Action & Chart Patterns · 1,280% TargetThis is so very interesting... I've seen this chart.
I've seen this setup, i've seen the signals and i've seen the results. The result is a very strong bullish jump and I have everything you need to read to agree with me.
QTUMUSDT. Did you read the analysis I just published?
The chart looks something like this but before the consolidation pattern breakout.
1000CATUSDT. The purple line is the main support for those who like high leverage. This should be the stop.
1000CATUSDT is showing really high volume as a it moves within a rising channel. This channel is producing higher lows with a relatively flat top. There are two rejections around 0.01300. The first one led to the 22-June low and the second one much higher, which is the current price zone. The lack of sellers looks pretty good for the bulls.
If you consider the really high green volume bars in the past few months, you know that behind the scenes there is a bullish bias even if 1000CAT is only consolidating.
All that is needed here is patience and this pair will soon move. Can happen right away, conditions are good but momentum is lacking; or, it can take a while. In both cases, a rise as the next major move is certain.
Namaste.
CAT TRADE IDEA – HEAVY EQUIPMENT, HEAVY POTENTIAL 📈🏗️🐾Sector: Industrials – Construction & Machinery
When the giants sleep, we prepare. And when they wake, we ride the momentum.
Caterpillar has been consolidating, and the recent pullback opens the door for a high-conviction setup. I'm looking to build my position in 3 strategic zones — scaling in with patience, letting the market give me the setup on my terms.
🟢 Entry Plan (Scaling In):
⚙️270 – First nibble as it approaches key structural support
⚙️250 – Historical support level and psychological round number
⚙️215 – Panic zone entry — if it hits here, it's a gift 🧨
🎯 Profit Targets:
320 – Swing back to resistance; first trim zone
370 – Momentum continuation with strong industrial tailwinds
400 – Full send 🚀 Long-term target if infrastructure demand and global growth trends align
🛡️ Risk Strategy:
Staggered entries allow for cost basis control
Adjust position sizing based on entry zone reached
💡 Why CAT?
Caterpillar’s fundamentals remain strong with global infrastructure spending on the rise, and the stock is approaching historical discount levels. This setup is about anticipating the bounce, not chasing it. Plan the trade, trade the plan.
📢 DISCLAIMER:
This is not financial advice. I'm sharing my personal trade plan for educational purposes only. Always do your own research and consult a licensed financial advisor before making any investment decisions. Trading involves real risk — respect it.

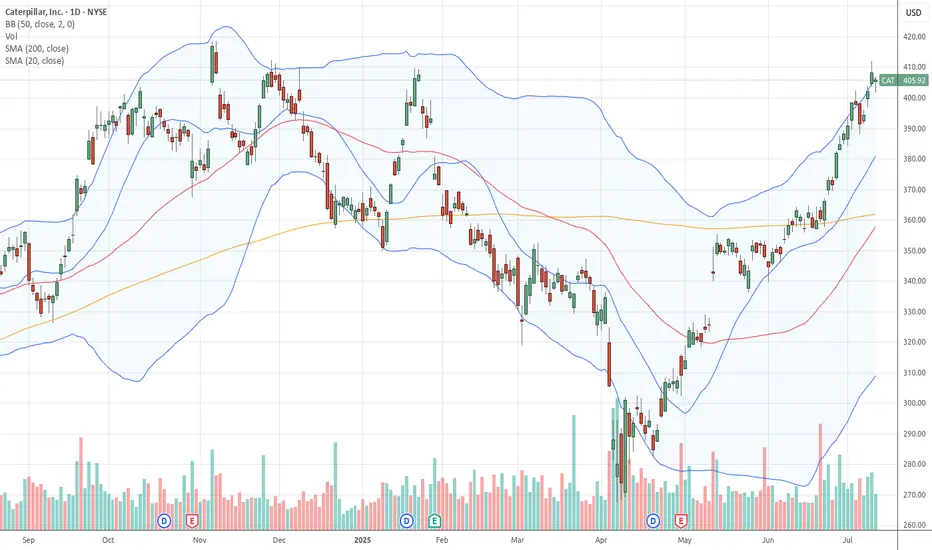
$CAT Tradespoon – Long Entry $435.77Tradespoon model generated long signal for NYSE:CAT . Predicted range: $435.77–$440.83. Trend: +0.25%. NYSE:CAT

$CAT Tradespoon – Long Entry $404.54Tradespoon model generated long signal for NYSE:CAT . Predicted range: $404.54–$412.44. Trend: +0.38%. NYSE:CAT
The only cat on binanceWhy NYSE:CAT Could Shine in Autumn 2025 Bullrun
Meme Coin Momentum: Bullruns often favor meme coins due to retail investor enthusiasm. NYSE:CAT ’s strong brand and cute cat theme could capture attention, especially if marketed effectively on platforms like X or TikTok.
Gaming and NFT Hype: The integration of NYSE:CAT in mobile games and NFTs taps into growing sectors. If new games or NFT drops launch in Autumn 2025, it could drive demand.
Low Market Cap: With a sub-$300M market cap, NYSE:CAT has significant growth potential compared to larger meme coins, making it attractive for speculative investors.
Community Strength: The Simon’s Cat brand gives NYSE:CAT a loyal, non-crypto-native audience, which could translate into broader adoption during a market upswing.

Caterpillar: Countertrend ActionCaterpillar’s green wave has further room to run. However, this rise represents only an internal countertrend – the broader correction in beige wave IV is still ongoing. Under our primary scenario, we expect the price to form another low before launching into a sustained advance, which should ultimately push above resistance at $409.40. Meanwhile, our alternative scenario—carrying a 38% probability—suggests that beige wave alt.IV has already bottomed. If that’s the case, the correction is complete, and a direct breakout above $409.40 could follow.
📈 Over 190 precise analyses, clear entry points, and defined Target Zones - that's what we do.

MEGAPHONE ALERT! BTC 1H Outlook🧩 Megaphone Formation (Broadening Wedge)
Volatility expanding inside a widening range
Price now testing the Fib cluster (0.66–0.618) between 105,568–105,987
RSI at 66.3, nearing overbought — pressure is building
Volume surging above 20-period MA → breakout imminent
🎯 Key Confluences:
Upper Bollinger Band: 105,950
Mid BB (Basis): 105,110
Lower BB: 104,342
55 SMA: 104,500
SL Zone (Invalidation): Above 106,500 (upper wick resistance)
🔻 Bearish Breakdown Scenario:
Loss of 105,100 and breakdown from lower wedge line
RSI drops < 45 + volume spike → hedge confirmation
Targets: 104,000 → 102,500
🔺 Bullish Breakout Scenario:
Close above 106,000–106,500 with volume
Targets: 107,800 → 108,900
Manage with trailing stops — things will be quick!
⚠️ Summary:
Megaphone = Volatility Bomb
Stay nimble. If BTC fails at this Fib zone, the breakdown will be fast and decisive. If it breaks out, bulls might squeeze higher but need volume to sustain it.
