CELR/USDT — Major Turning Point! Key Accumulation Zone?Celer Network (CELR) is currently standing at a critical juncture that could define its next major move.
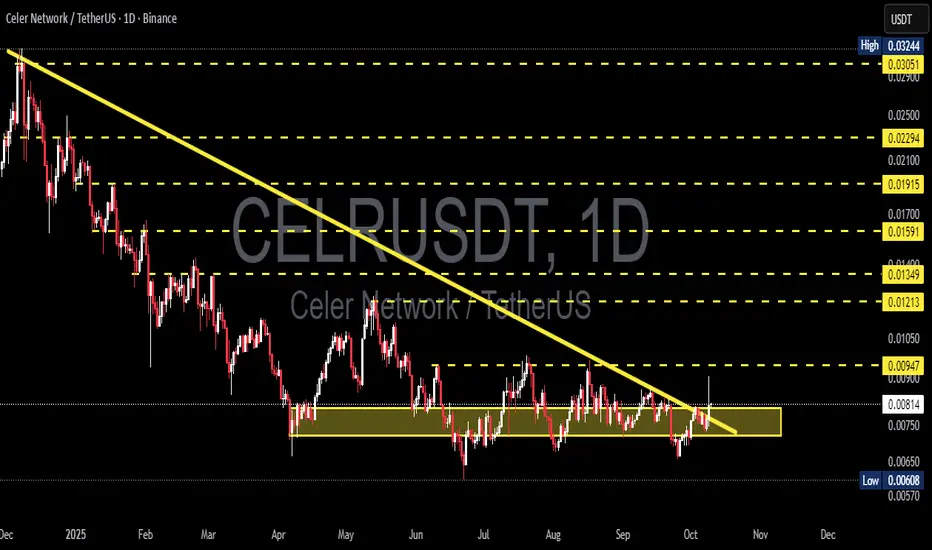
After months trapped below a long-term descending trendline, price is once again testing a crucial area — the accumulation zone between 0.008 and 0.0072.
This yellow zone has consistently acted as a strong demand area, showing that buyers have been quietly absorbing sell pressure.
At the same time, the long-term downtrend line remains a heavy ceiling that has capped every rally attempt so far.
Now, both forces are converging — making this a true decision point for CELR.
---
Pattern Description
The chart displays a descending triangle pattern characterized by:
A sequence of lower highs (declining selling pressure).
A horizontal support base around 0.008–0.0072 (firm buying interest).
This structure typically signals a compression phase — the market builds energy for its next big move.
A breakout could mark the beginning of a major trend reversal, while a breakdown could trigger a continuation of the broader downtrend.
---
Bullish Scenario — The Start of a Reversal?
If CELR manages to break and close above the descending trendline, especially with a daily close above 0.0094–0.0095, it would signal the first technical shift in momentum after months of decline.
A breakout accompanied by rising volume would confirm that buyers are taking control.
📈 Upside targets:
Target 1: 0.0095 – initial breakout retest zone.
Target 2: 0.0121 – first horizontal resistance.
Target 3: 0.0135 – a psychological level often triggering follow-up buying.
Extended targets: 0.0159 – 0.019 – medium-term expansion zone if bullish momentum sustains.
If CELR can hold above the breakout level on a successful retest, it may mark the beginning of a significant trend reversal phase driven by renewed demand.
---
Bearish Scenario — Continuation Risk
If CELR fails to break above the trendline and gets rejected around 0.0085–0.0090, selling pressure could return.
A daily close below 0.0072 would confirm a bearish breakdown and could lead price toward:
0.0068 – 0.0065 → the previous local low zone.
0.00608 → the next key support if selling continues.
This scenario would indicate that buyers are still weak and the long-term downtrend remains dominant.
---
Technical Context
The long-term descending trendline remains a major resistance area monitored by technical traders.
The yellow accumulation zone (0.008–0.0072) has acted as a high-liquidity demand region.
Volume confirmation is crucial — a breakout without volume often leads to a false move.
Momentum appears to be shifting slowly, but true confirmation will depend on how the next few daily closes unfold.
---
Conclusion
> CELR stands at a historic inflection point.
The clash between long-term selling pressure and strong accumulation support will determine its next trend direction.
A breakout above resistance could trigger a long-awaited trend reversal, while a breakdown below support could extend the bearish structure.
Patience and confirmation are key — not anticipation.
---
#CELRUSDT #CELR #CelerNetwork #CryptoAnalysis #TechnicalAnalysis #DescendingTriangle #BreakoutSetup #TrendReversal #DecisionPoint #CryptoTrading #SupportResistance #SwingTrade
Celrusdtanalysis
CELRUSDT – Descending Triangle: Breakout or Breakdown?Summary
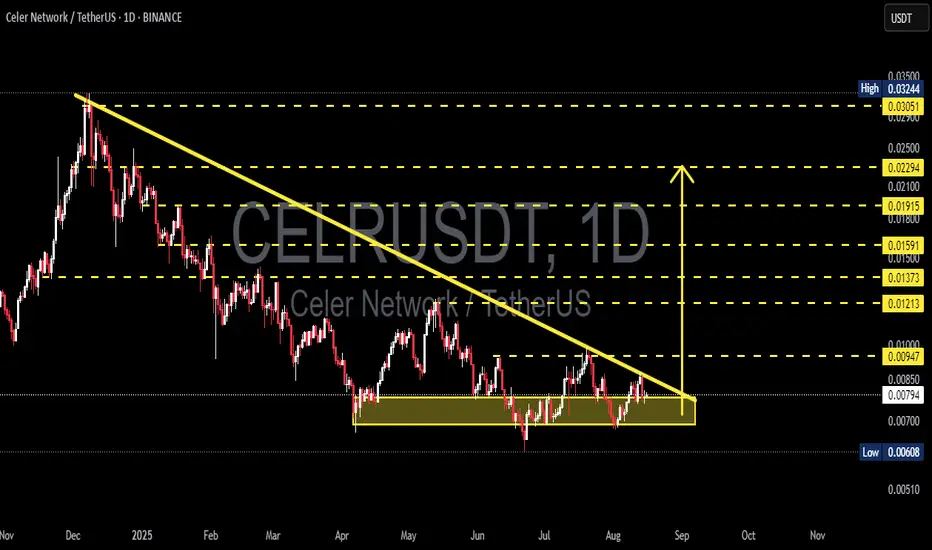
Overall trend remains bearish since the late 2024/early 2025 peak (downtrend line in yellow).
Price is now compressed into a Descending Triangle:
– Falling resistance (yellow diagonal).
– Flat support / demand zone in 0.0074–0.0086.
Key horizontal levels (yellow dashed lines): 0.00947, 0.01213, 0.01373, 0.01591, 0.01915–0.02100, 0.02294, and higher resistance at 0.0305–0.0324.
Critical low: 0.00608.
Bullish Scenario
Catalyst:
Daily close above the downtrend line and a confirmed breakout above 0.00947, ideally supported by stronger volume.
Targets:
1. From 0.00947 → 0.01213 (TP1).
2. Next → 0.01373 (TP2) and 0.01591 (TP3).
3. If momentum continues: 0.01915–0.02100 → 0.02294 → 0.0305–0.0324 (local highs).
Invalidation: Rejection and daily close back below 0.0086 (inside triangle/demand zone).
Bearish Scenario
Catalyst:
Daily close below 0.0079 and more importantly, breakdown of the demand zone at ≤0.0074.
Targets:
Descending Triangle measured move (0.0095 − 0.0074 ≈ 0.0021) projects to ≈0.0053.
Intermediate levels: 0.00608 and ≈0.0051.
Failed retest of 0.0074–0.0079 after breakdown would strengthen the bearish case.
Invalidation: Price reclaims 0.00947 and breaks above the downtrend line.
Pattern Notes & Risk Management
Descending Triangles at strong support often trigger sharp moves once a breakout/breakdown occurs.
Beware of fakeouts near the apex (late August–early September) – wait for daily close confirmation or a retest.
Strategy: entry based on break & retest, with stop-loss outside invalidation zones (e.g. below 0.0072 for longs; above 0.0098 for shorts).
This is not financial advice – manage your own risk.
#CELR #CELRUSDT #CelerNetwork #CryptoAnalysis #PriceAction #DescendingTriangle #SupportResistance #Breakout #BullishScenario #BearishScenario
CELRUSDT 1D AnalysisCELR ~ 1D Analysis
#CELR Buy after successfully penetrating this resistant line with a short -term target of at least 10%+.

CELRUSDT 1WCELR ~ 1W Analysis
#CELR Buy gradually from here if you still have a Conviction on this Coin with a minimum target of 20%+.

CELRUSDT: Massive Move Incoming? Key Support Holding Strong! Yello, Paradisers! Is CELRUSDT gearing up for a major bounce, or is another leg down coming? Let’s break it down.
💎CELRUSDT has retraced to a key support zone, showing a healthy pullback. The price action has formed a falling wedge pattern, which is typically a bullish reversal setup. The probability of a bounce from this level is high, but to confirm a stronger move, we need additional bullish signals—such as an I-CHoCH (Internal Change of Character), a W pattern, or an inverse head and shoulders on lower timeframes.
💎Right now, the price is attempting to break out of the falling wedge, but we need to see an increase in volume to confirm a proper breakout. A weak breakout without volume could lead to a fakeout, so patience is key.
💎If CELRUSDT drops further, especially in a panic-selling scenario, we can expect a bounce from the stronger support zone below. However, just like in the current setup, we will need clear bullish confirmation—such as an I-CHoCH or bullish patterns on lower timeframes—to increase the probability of a reversal.
💎If the price breaks down and closes candle below the strong support zone, it will invalidate our bullish setup. In that case, waiting for a more favorable price action setup will be the best strategy before looking for long entries.
🎖 The market is full of traps, and patience is what separates the winners from the losers. Wait for confirmation, follow the strategy, and never trade based on emotions. Play it smart, Paradisers! Stay disciplined and trade like a PRO.
MyCryptoParadise
iFeel the success🌴
