XAUUSD Gold is a little complicated last days as we can see no clear movements. Just collecting stop losses for sure. I saw this wedge pattern tell me what u think. Direction is not clear at this moment could go both ways. My opinion is Upside cause of overall trend since February.
Tell me your thoughts
Cfds

UKOIL: Downtrend Bid + Retracement LongFirst off, please don't take anything I say seriously, as always this is on opinion basis. That being said, let me get into a few key points I want to make. Oil is about to go back down on the demand curve and have increased resistance, especially in indexes and/or options trading. This is mostly due to price corrections and a result of the sentiment going on from people reacting to the Covid19 pandemic. The demand curve going down = oil going down = price corrections as a result of impacted news. It is that simple, and this is why I predict a small imminent bearish period for UKOIL, but a huge upswing investment opportunity.

Gold Neutral waiting for confirmationMy view on gold is on a neutral right now, no certain direction,

SPX500 Struggles To Overcome ResistanceThe left charts shows the daily time frame of the SPX500. We note that it is above its 20-day SMA and that the RSI is above 50. These are bullish, however, the index has struggled to overcome the 2,900 level (red shaded horizontal). The right chart shows the hourly time frame. Here, the EMAs are rolling over and looking to cross down and the RSI is threatening to move to the weaker side of 50. The market is nervous ahead of the Fed statement at 6:00 pm GMT and the press conference after. If the EMAs cross and develop angle and separation the index will be retreating from the overhead resistance.

XAUUSD IDEA FOR THE FUTUREHeavy seller pressure coming in at the current level we are standing right now. All the way back to 2011'. We can clearly aim for a correction at the .618 fib. Closing some nice 700 pip move


Natural Gas | More DownsidePlease support this idea with LIKE if you find it useful.
Overall we are moving in a Descending Channel and the previous rejection can lead us to the lower boundary being retested.
On closer look we see the price is under Ichi Cloud resistance zone and 50 MA dynamic resistance. Also price producing bearish engulfings, which confirms the decline.
Thank you for reading this idea! Hope it's been useful to you and some of us will turn it into profitable.
Remember this analysis is not 100% accurate. No single analysis is. To make a decision follow your own thoughts.
The information given is not a Financial Advice.

COPPER OUTLOOK - XCUUSDCopper has been trading in a bearish channel since 2011 right after bouncing off from the ascending resistance of the ultimate bullish channel. The first corrective wave in the blue bearish channel ended last year and price failed to break out to the upside.
A critical price level has been broken and this will potentially expose the copper price to a further downside. I had forecast this short setup last year and I have now updated my chart.
My first and second price target at $2.32/lb and $1.98/lb respectively were successfully achieved last week. If price breaks my 161.8% fib level, I expect price to reach my third target at $1.29/lb.


USOIL SHORT TRADEusoil trading in downtrend line
price rejected from key level and 50% fibo level around 24.00
price below SMA100
MACD shows bullish momentum weakness
RSI below 50
so its expect more selling to support level around 20.00


Oil Long Idea This week 24-28 Oil will long? What Do you think my analysis? please let me know your comments. and stay with me.

GOLD (Y20.P1.E1).Bullish momentumHi All,
The point of contention will be the level where it was rejected 3 times.
We would expect at this point a large % to sell.
Note: We will get confirmation of inverse H and S at 1668.
However it will be short lived and just like Tesla, it will spike up past this and beat the all time high.
Monthly Chart
Regards,
S.Sari

CFDs on WTI CRUDE OIL 1HHOW TO USE 200 EMA TO BUY COMMODITIES.
1 - 200 EMA standard measurement of bullish
or bearish trends in commodity market.
2 - MA breakouts have multiple false breakouts.
3 - Wait for a breakout and then a retest of EMA.
4 - Buy at breakout of high of breakout candle.
If you want to predict which commodity trading levels are worth to base your trade-off, then look no further than the 200-day moving average.
The 200-day EMA is regarded as being the standard measurement of bullish and bearish trends in the commodity market. However, a breakout of the 200-day EMA is not always a reliable signal. The reason is that like with all technical indicators it’s prone to give multiple false signals.
A simple solution to this very common problem is to wait for the breakout of the 200-day EMA and a retest.
This means that you can buy/sell commodities at the first retest of the 200-day EMA.
Now, we know that not many traders have the right amount of capital to invest in the long-term.
Holding a position for a yearlong period is not suitable for everyone.
If you don’t have a big account balance and the patience to ride the cyclical commodity trends, you’re better off if you stick with short term commodity trading

NASDAQ SHORT TRADEnasdaq rebounded from resistance zone
around 9240.0
price reached reversal AB=CD pattern target at 161.8% fibo
MACD shows bullish momentum weakness
RSI broke the uptrend line
so its expect bearish momentum to support area around 8880.0


USDBRO Brent Daily Long with 3 TPs with 50 Pips Trilling SLwe believe the First TP should be Triggered in order for the harmonic pattern forms and then it should touch the Second Target for completing the second pattern and henceforth till 3 TP,
keep in mind it is a Buy order with a 50 Pips Trilling Stop loss.
there is a Buy Stop for the 3 TP with 50 pips trilling SL,
If the First TP is broken and passed the First Level we are expecting the Second Target to be our next Goal but If it could not pass the First Level and a Big Retracement happens then we have a Second Scenario and we should look for a reversal...
be careful about your Position Sizing and it should be Proportional to your Account Balance as it is a very long Time Analysis and Trade, each candle is representing a Day so it may take up to a month or more
Entry and Exit points should be considered in a Range of Pips not an exact point.
Enjoy Trading sensibly
please do n't hesitate to Ask us any questions in comments.
Good Luck


USOIL on the way to correct its entire recent upmoveUSOIL Short. This may play out over a couple of weeks

XAUUSD, Setup: BUY, TF: H4, Trendline StructureOANDA:XAUUSD
PLAN: H4
- SetUp: => BUY
- Structure: Downtrend forming
- Tendency: Upward
- Above support
-> Waiting signal <-
- Buy: Green Area

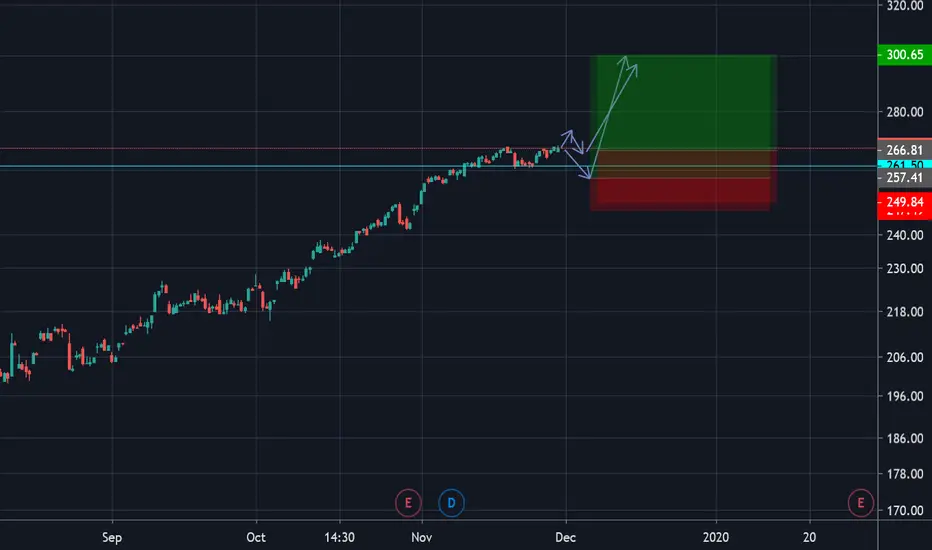
apple signals hi I would like to say in technical indicator we would most have a bulishe week for the apple as apple goes to get rally on next week i did share my own plan and we just have to wait next week for the confirmation and opening position wisely.
GOLD Waiting for bullish wave XAUUSD Forming Elliot wave , now waiting downtrend line breakout to confirm that wave 4 start
breakout resistance @ 1464 it means also bullish wave start
target for wave (4) is 61.8% fibo of past bearish wave @ 1490.50
Volume profile shows peak at the same level
