Gold Extends Gains Post-CPI | All Eyes on PPI for the Next Move XAUUSD – Gold Extends Gains Post-CPI | All Eyes on PPI for the Next Move
🌍 Macro Pulse: CPI Sparks Momentum, But Will PPI Sustain It?
Gold surged following softer-than-expected US inflation data on Tuesday, with the CPI rising just 0.1% MoM and 2.4% YoY—both below forecasts. This triggered a broad sell-off in the USD, a pullback in Treasury yields, and a renewed appetite for non-yielding safe havens like gold.
Markets are now increasingly pricing in a rate cut by the Fed in September, adding further fuel to the rally. However, Wednesday’s US PPI data could either reinforce this bullish sentiment or reverse it sharply.
📉 Technical Landscape – H1 & H4 View
🔹 Trend Bias
The bullish structure remains intact, with price carving out higher highs and higher lows since the 3312 level. The recent breakout above 3370 confirms bullish momentum.
🔹 Price Channels
Gold continues to track within a defined ascending channel. A potential retest of the lower trendline near 3345–3350 could provide a dip-buying opportunity.
🔹 EMA Structure
The price trades comfortably above the 13, 34, 89, and 200 EMAs.
Short-term EMA crossovers are supportive of continued upside.
🔹 Critical Resistance Ahead: 3392 – 3395
A key technical zone combining Fibonacci extension levels and recent rejection wicks. A decisive break or rejection here will set the tone for the next 48 hours.
🧠 Market Psychology & PPI Scenarios
The market is currently optimistic, but still cautious. The PPI report due later today will likely serve as the next directional trigger:
If PPI prints below estimates → reinforces disinflation narrative → potential breakout above 3,400 with upside targets towards 3,420+.
If PPI comes in hot → raises concerns about sticky input costs → possible short-term reversal or consolidation.
Expect volatility to spike during the New York session.
🎯 Today’s Tactical Trade Setups – 12 June
🟢 Buy Zone: 3324 – 3322
Stop Loss: 3318
Take Profit Targets: 3330 – 3334 – 3338 – 3342 – 3346 – 3350
🟢 Buy Scalp Zone: 3337 – 3335
SL: 3330
TPs: 3341 – 3345 – 3350 – 3354 – 3360 – 3370 – 3380
🔴 Sell Zone: 3392 – 3394
Stop Loss: 3398
Take Profit Targets: 3388 – 3384 – 3380 – 3375 – 3370 – 3360 – 3350
✅ Final Take
Gold bulls are in control, but the PPI data will likely dictate whether momentum continues or stalls. With key resistance just ahead and macro risk on the table, this is not the time to trade blindly.
🧭 Strategy Tip: Let price confirm the reaction to PPI. Don’t pre-position into volatility. Play the breakout or the fade—but wait for clarity.
Cfdtrading

Oil's Volatility Meets Fed's Patience: A Path to 1.3643?USDCAD – Oil's Volatility Meets Fed's Patience: A Path to 1.3643?
🌍 Macro Landscape: Diverging Monetary Paths & Oil's Influence
The USDCAD pair is currently navigating a complex environment shaped by diverging central bank policies and the significant influence of crude oil prices. While the Federal Reserve is signaling a "higher-for-longer" interest rate stance due to sticky inflation, the Bank of Canada (BoC) is in a more nuanced position, balancing inflation control with economic growth. This divergence creates a fundamental tailwind for the USD.
However, Canada's economy is heavily tied to commodity prices, especially crude oil. Recent volatility in oil markets can exert significant pressure on the Canadian dollar. If oil prices remain subdued or face downward pressure, it could exacerbate the CAD's weakness against the USD, amplifying the impact of policy divergence.
🏦 Central Bank Policy Divergence: Fed's Firmness vs. BoC's Caution
Federal Reserve: FOMC members continue to signal patience on rate cuts. Recent inflation data (PCE, CPI) shows persistent price pressure, particularly in the services sector, reinforcing the Fed's hawkish bias. This suggests the USD may retain its strength as higher rates attract capital.
Bank of Canada: The BoC, while having taken aggressive steps previously, might be more cautious in its future rate decisions. Any dovish undertones or hints at pausing rate hikes could weaken the CAD. Conversely, a resurgence in inflation or stronger economic data could prompt the BoC to maintain a firm stance.
This policy divergence, coupled with external factors like commodity prices, creates a fertile ground for significant moves in USDCAD.
🌐 Capital Flows: Safe-Haven Dynamics and Commodity Impact
Global capital flow models indicate a shift towards the US dollar as a preferred safe haven amidst geopolitical tensions and global economic uncertainties. While Gold remains a traditional hedge, the USD's yield advantage makes it an attractive destination for institutional capital.
For CAD, its sensitivity to commodity prices means that capital flows are heavily influenced by the outlook for global growth and energy demand. A softening global economic outlook could lead to reduced demand for commodities, weighing on the CAD, and potentially driving inflows into USD-based assets.
📊 Technical Structure: Channel Breakdown & Bearish Momentum Towards 1.3643
On the H1 chart (as observed from the provided image):
Price Channel: USDCAD has been trading within a clear ascending channel. However, the price recently broke below the lower boundary of this channel, suggesting a potential shift in momentum from bullish to bearish.
Moving Averages: The price has moved below the EMA 13 – 34 – 89. This bearish alignment (EMA "fan-out formation" in reverse) confirms a short-term bearish momentum is building. The 200 EMA (red line) is currently acting as a key resistance level, near the prior support turned resistance.
Key Resistance (Sell Zone): The region around 1.36989 (aligning with previous support and possibly a Fibonacci retracement level) is now acting as a crucial resistance. Any retest of this zone, especially with bearish candlestick patterns, could offer selling opportunities. The 200 EMA reinforces this zone as a strong overhead barrier.
Key Support (Target Zone): The price is projected towards 1.36431. This level aligns with a strong prior support and also coincides with the Fibonacci Extension 1.382 level from a previous swing, making it a high-probability target for bearish moves. A bounce from 1.36734 (a mid-channel support or Fibonacci level) could offer a temporary reprieve, but the overall technical structure points to the lower target.
🎯 Trade Strategy Recommendations
Scenario 1 – Sell the Pullback (Preferred):
Entry: 1.3685 – 1.3695 (retest of broken channel line/resistance near 1.36989, possibly confluence with 200 EMA).
Stop-Loss: 1.3720 (above recent swing high/channel top).
Take-Profit: 1.3673 (initial target) → 1.3643 (main target) → 1.3620.
Scenario 2 – Breakout Momentum Sell (if price consolidates below 1.3673):
Entry: 1.3670 (break below 1.36734 with strong bearish momentum).
Stop-Loss: 1.3690.
Take-Profit: 1.3643 → 1.3620.
⚠️ Key Events to Watch:
US PCE Price Index (upcoming data): If hotter-than-expected, this would reinforce the Fed’s hawkish tone and lift USD.
Canadian CPI (upcoming data): Cooler-than-expected inflation could prompt a more dovish stance from the BoC, weakening CAD.
Crude Oil Inventory/News: Any significant news or data regarding global oil supply/demand can directly impact CAD.

Storm Ahead? Key Level Breakout or Dangerous Reversal!USD/JPY: Storm Ahead? Key Level Breakout or Dangerous Reversal!
Overview:
The USD/JPY pair stands at a crucial crossroads, with technical signals indicating the potential for significant volatility in the near term. Will the Yen regain its footing, or will pressure from the USD continue to push the pair to new highs? This analysis delves into technical, fundamental, and macroeconomic factors to outline potential scenarios and identify key trading zones.
Detailed Technical Analysis:
Primary Trend: The USD/JPY chart clearly shows a short-term uptrend, supported by an ascending trendline (dashed line on the chart) and upward-sloping moving averages (MA). Trend analysis is considered the most important area of technical analysis, and is key to determining the general direction of a security. However, the price is approaching strong resistance zones, suggesting potential selling pressure. Technical analysis is a trading tool used to evaluate stocks and attempt to predict their future movements by analyzing statistical data obtained from trading activity.
Key Price Levels:
Crucial Resistance Zone (SELL Zone): Around 144.894 - 145.178. This is a significant Fibonacci Extension zone (1.13 and 1.236), where the price has reacted in the past and could attract strong selling pressure. If the price breaks and holds above this zone, the uptrend will be confirmed.
Crucial Support Zone (BUY Zone): Around 143.600 - 143.750. This support zone is formed by previous lows and the ascending trendline. If the price corrects to this zone and shows reversal signals, it could be a good buying opportunity. The next support zone is around 142.800. The goal of technical analysis is to determine the buy and sell points of a stock.
Technical Indicators: The MAs (blue, orange, red) maintain a relatively consistent distance and are sloping upwards, supporting the uptrend. However, the convergence of MAs near resistance zones could signal a weakening of upward momentum.
Price Patterns: Currently, the price is forming a pattern similar to a bull flag or an ascending triangle, suggesting a potential continuation of the uptrend if it breaks upwards. Conversely, if the price fails to overcome resistance and breaks the uptrend line, a bearish reversal pattern could form. Wave analysis is a technique based on the observation that markets move in specific patterns called waves.
Relevant Fundamental and Economic Factors:
Macroeconomic Analysis (Japan): The Bank of Japan (BOJ) continues to maintain ultra-loose monetary policy, with negative interest rates and yield curve control. This exerts continuous downward pressure on the Yen. Any signal of change from the BOJ regarding policy will have a significant impact on USD/JPY.
Macroeconomic Analysis (United States): The U.S. Federal Reserve (FED) is still in an aggressive monetary tightening cycle to combat inflation. Inflation reports (CPI, PPI), employment data (NFP), and statements from FED officials will be key drivers for the USD. If U.S. inflation remains high, the FED may continue to raise interest rates, pushing USD/JPY higher. Fundamental analysis focuses on evaluating economic, political, and social factors affecting the value of a currency pair.
Upcoming Economic Events: Closely monitor inflation reports from both the U.S. and Japan, GDP data, unemployment rates, and policy meetings of the BOJ and FED. These events will act as catalysts for sharp movements.
Conclusion and Trading Recommendations:
USD/JPY is in an uptrend but approaching crucial resistance zones.
BUY
Entry: When the price breaks and closes above 145.178, confirming the uptrend continuation. Or when the price corrects to the 143.600 - 143.750 zone and shows bullish reversal candles (e.g., bullish engulfing, hammer).
Take Profit: Higher Fibonacci levels (e.g., 1.382 at 145.491 or 1.5 at 145.918).
Stop Loss: Below the nearest support zone, e.g., below 143.500 if buying at support, or below 144.800 if buying after a resistance breakout.
SELL Scenario:
Entry: When the price approaches the 144.894 - 145.178 zone and strong bearish reversal signals appear (e.g., Gravestone Doji, bearish engulfing, double top pattern).
Take Profit: Lower support levels, e.g., 143.700, 142.800.
Stop Loss: Above the resistance zone, e.g., above 145.300.
Risk Disclaimer: Financial markets always involve high risks. Always manage your capital carefully and never trade with money you cannot afford to lose. This analysis is for informational purposes only and not investment advice.

09/06/2025: WILL WE SEE A BREAKOUT ABOVE 1.3550?GBP/USD PLAN – 09/06/2025: WILL WE SEE A BREAKOUT ABOVE 1.3550?
🌍 Macroeconomic & Fundamental Context:
UK Economic Outlook (BoE): The Bank of England (BoE) is under pressure due to inflation and has to make decisions regarding interest rate policy. Diverging opinions on whether to raise or lower rates are creating uncertainty in the market.
US Economic Outlook (Fed): The Federal Reserve's monetary policy continues to be a major influence on the USD, especially as the Fed maintains its rate hikes to control inflation.
US-UK Trade Relations: Trade negotiations between the US and the UK will remain an important factor this week, and any new developments could impact GBP/USD.
📉 Technical Analysis – GBP/USD:
On the H4 and H1 timeframes, GBP/USD is consolidating within a corrective structure, and price has broken several key Fibonacci levels. The EMA indicators (13, 34, 89) are showing strong momentum.
Key Resistance Levels:
1.3550 – This is a major resistance level. If broken, GBP/USD could continue its rally towards 1.3612.
Key Support Levels:
1.3520 – A short-term support level. If this breaks, price may retrace back to 1.3470.
🎯 Trading Scenarios for Today:
🟢 BUY ZONE:
Buy Zone: 1.3520 – 1.3500
SL: 1.3480
TP: 1.3550 → 1.3570 → 1.3600 → 1.3620 → 1.3650
If price retraces to 1.3520 – 1.3500, this would be an ideal buying opportunity with a target at 1.3550. Look for confirmation from technical indicators and the current trend.
🔴 SELL ZONE:
Sell Zone: 1.3550 – 1.3570
SL: 1.3590
TP: 1.3520 → 1.3500 → 1.3470 → 1.3450 → 1.3420
If price reaches the resistance zone of 1.3550 – 1.3570, consider selling with targets at the support levels below.
🟡 Scalping:
Buy Scalping: 1.3520 → 1.3500
Sell Scalping: 1.3570 → 1.3600
Look for short-term opportunities when price moves within the range.
⚠️ Important Notes:
Pay close attention to short-term fluctuations and any major economic data releases from the BoE and Fed.
Risk management is key during volatile periods.
📌 Conclusion:
GBP/USD is in a short-term corrective phase, but a breakout above 1.3550 could trigger a strong rally. Traders should monitor support and resistance levels carefully and ensure risk management is in place.

WILL EUR CONTINUE TO RALLY AHEAD OF THE IMPORTANT NFP DATA?EUR/USD – WILL EUR CONTINUE TO RALLY AHEAD OF THE IMPORTANT NFP DATA?
📈 EUR/USD IS AT A CRITICAL POINT AHEAD OF KEY ECONOMIC DATA
Amid the ongoing pressure on the US Dollar and macroeconomic factors supporting the Euro, EUR/USD might continue its short-term bullish trend. However, key data such as US CPI and central bank meetings could determine the direction for this currency pair moving forward.
🌍 Macroeconomic Overview & Market Sentiment
USD & DXY: The US Dollar continues to weaken due to signals from the Federal Reserve (Fed) that they are not in a hurry to cut interest rates. DXY has fallen below the 99 level, with macroeconomic factors showing a continued bearish trend for the USD.
Eurozone: The ECB (European Central Bank) is maintaining a slightly tight monetary policy. However, the Eurozone economy is showing signs of recovery, with positive data from the region.
US Economy: Forecasts for the US labor market data could impact the USD and lead to volatility in the EUR/USD pair. All attention is on the reports from the US this week.
📊 Technical Analysis (H1 – H4 – D1)
EMA 13/34/89/200: The EMA indicators on the H1 and H4 timeframes support the current bullish trend for EUR/USD in the short term. In particular, the EMA 13 and EMA 34 are crossing above the EMA 200, signaling a strong upward trend.
Wave Structure: EUR/USD is currently in a corrective wave after testing the strong resistance level at 1.1450. A recovery signal is emerging around the support level at 1.1380, which could present a buying opportunity in the short term.
Fibonacci Expansion: The Fibonacci extension levels at 1.1470 and 1.1490 could be the next targets if EUR/USD breaks through the 1.1400 resistance zone.
⚡ Key Levels to Watch
Resistance: 1.1450, 1.1470, 1.1490, 1.1500
Support: 1.1380, 1.1350, 1.1320, 1.1300
🧭 Trading Scenario
🔵 BUY ZONE: 1.1380 – 1.1365
SL: 1.1340
TP: 1.1420 → 1.1450 → 1.1470 → 1.1490
🔻 SELL ZONE: 1.1450 – 1.1460
SL: 1.1475
TP: 1.1420 → 1.1400 → 1.1370 → 1.1350
✅ Summary
EUR/USD is currently in a short-term bullish trend and could continue to rise if the support at 1.1365 holds. However, key economic data from the US, especially CPI and central bank meetings from the Fed and ECB, could impact the next direction for this pair. Traders should keep an eye on important support and resistance levels to identify safe trading opportunities.

Gold liquidity run short setup In this video I map out the range using the fixed range tool and talk about the possibility of a liquidity run on the weekly high before dropping back inside the range .
Engineering liquidity at the range value area high and thus heightening the expectation for more upside continuation , take the liquidity at $3392 and pull back below the vah *Value area high and head down to fill the new week open gap and the new monthly pivots $3297 and the poc * point of control and remain rangebound.
We all know that nothing is set in stone and this is just an idea out of many but its something to consider .
Set alerts and wait for reaction and lower time frame for confirmation
Thanks for your support

Gold liquidity run short setup Update 2This video is an update on the Gold setup that was posted on the 4/06/25
I cover the price action and discuss what I think will be occurring from this point onwards as
part of the original trading plan .

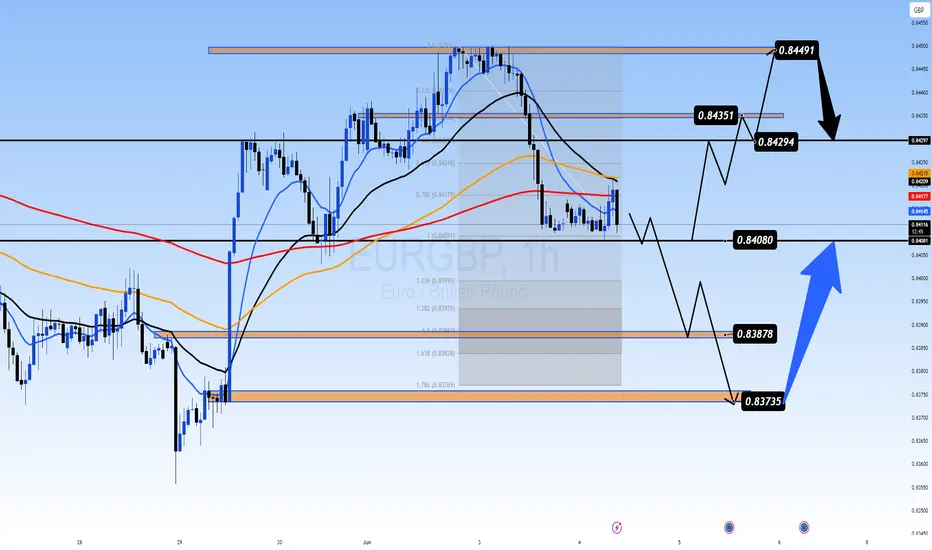
PMI Divergence & ECB Rate Decision Looms:0.84 Key Level in PlayEURGBP 04/06 – PMI Divergence & ECB Rate Decision Looms: 0.84 Key Level in Play
EUR/GBP is hovering around the 0.8420 mark after mixed PMI releases from the Eurozone and Germany. Traders are cautiously awaiting the ECB’s interest rate decision this Thursday, while the Bank of England signals potential easing — but remains non-committal on timing.
🌍 MACRO OUTLOOK
Eurozone & German PMI:
Eurozone Composite PMI eased to 50.2, still above forecasts (49.5) but reflecting slowing momentum.
German Composite dropped to 48.5; Services fell further to 47.1 — signaling contraction risk in Europe’s largest economy.
ECB Dovish Expectations:
Core inflation fell to 1.9% YoY in May — below the 2% ECB target for the first time in eight months.
Markets are fully pricing in a 25bps rate cut this week.
BoE Shifts Cautiously Dovish:
Governor Andrew Bailey acknowledged that monetary easing is likely, but warned of "uncertainty ahead."
The MPC is split — some fear sticky inflation; others warn that rates staying too high too long may damage growth.
Market Sentiment:
EUR remains pressured by ECB dovish expectations.
GBP is also under pressure from weak UK macro indicators and global trade tensions.
📉 TECHNICAL OUTLOOK (H1 Chart)
Price is consolidating near the EMA200 (0.8409) — a crucial dynamic support.
A tight sideways range has formed; 0.8408 is a key horizontal level to watch for breakout/breakdown confirmation.
Break below 0.8408 could send price toward Fibo 1.618 at 0.8383 or psychological support at 0.8373.
If bulls defend 0.8408, we may see a bounce toward 0.8429 → 0.8449 resistance zone.
🔑 KEY TRADE ZONES
🟢 BUY ZONE: 0.8380 – 0.8373
SL: 0.8358
TP: 0.8400 → 0.8415 → 0.8429 → 0.8435
🔴 SELL ZONE: 0.8448 – 0.8450
SL: 0.8460
TP: 0.8435 → 0.8420 → 0.8408 → 0.8388
⚠️ TRADE STRATEGY
Watch the 0.8408 area closely. If price holds → short-term BUY scalp opportunities.
If it breaks strongly → consider SELL toward lower Fibo/structure levels at 0.838x.
Be cautious around ECB release — avoid trading during the spike. Wait for structure confirmation post-news.
📌 CONCLUSION
"EUR/GBP is entering a critical zone near 0.8400. With ECB and BoE both leaning dovish, expect increased volatility. Hold or break at this key level will likely define the next directional leg. Stay patient and let the market show its hand."
Gold Awaits Breakout: Will the 3345–3370 Range Explode? XAUUSD 04/06 – Gold Awaits Breakout: Will the 3345–3370 Range Explode?
Gold is currently consolidating within a critical range between 3345–3370, following a wave 4 correction. After a sharp retracement to the 335x area, traders are closely watching for the next move — either a continuation of the correction or a breakout toward new highs.
🌍 MACRO CONTEXT
Trump–Xi Call Incoming: A high-level diplomatic call is expected in the coming days. Market participants are anticipating potential shifts in global trade sentiment.
US 10-Year Yields remain elevated, keeping pressure on gold in the short term. However, geopolitical risks and macro uncertainty still support demand for safe-haven assets.
The US Dollar Index (DXY) is showing signs of weakness after recent strength, which may give gold room for recovery.
📉 TECHNICAL ANALYSIS – H1 / H4 Timeframe
Gold is in a wave 4 structure within a 5-wave Elliott pattern. A break above 3370 could signal the beginning of wave 5, targeting 3400.
A breakdown below 3345 would imply deeper correction toward the 332x liquidity zone, completing wave 4 before a bullish continuation.
EMAs 13 and 34 remain above EMA200 on H1, indicating the broader uptrend is still intact.
🔑 STRATEGIC PRICE LEVELS
🟢 BUY ZONE: 3317 – 3315
Stop Loss: 3310
Take Profit: 3322 → 3326 → 3330 → 3334 → 3338 → 3345 → 3350 → 3360
🔴 SELL ZONE: 3372 – 3374
Stop Loss: 3378
Take Profit: 3368 → 3364 → 3360 → 3356 → 3350 → 3345
⚠️ STRATEGY RECOMMENDATION
Respect the 3345–3370 range until a breakout is confirmed.
Avoid chasing trades in the middle of the range. Wait for strong rejections or clear breakout confirmations.
Be cautious with unexpected news from the Trump–Xi call, which may trigger sudden market volatility.
📌 FINAL THOUGHT
“Gold is at a turning point. Break above 3370 and we may see wave 5 unfold toward 3400. But a breakdown below 3345 could drag price lower before the next bullish leg begins. Focus on the key zones — volatility is just getting started.”

Waiting for a Short-Term Pullback Before the Next Bullish Leg? NZDUSD – Waiting for a Short-Term Pullback Before the Next Bullish Leg?
As global markets await the upcoming U.S. Non-Farm Payrolls (NFP) report later this week, NZDUSD is showing early signs of short-term weakness following a strong bullish rally from the 0.5905 low. While the broader structure remains bullish, a corrective move may be necessary to shake out weak hands and reload liquidity before a renewed surge.
🌐 Macro & Fundamental Outlook:
New Zealand: Recent economic releases from New Zealand have been lackluster, yet the RBNZ's hawkish policy stance (high interest rates) continues to support the Kiwi. However, pressure from China – New Zealand’s top trading partner – remains a drag.
United States: The U.S. Dollar remains under pressure due to rising expectations that the Fed will start cutting rates by Q3 2025, despite some hawkish tones from FOMC officials. This week’s NFP report will be a decisive factor.
Market Sentiment: After a ~150-pip rally, traders are beginning to take profits. The correction could offer a golden re-entry opportunity.
📊 Technical Analysis:
Trend Bias: The market structure is still in an uptrend, maintaining Higher Highs and Higher Lows.
Fibonacci Retracement: Price is currently pulling back toward the 0.5 – 0.618 Fibo zone (0.5992 – 0.5978), aligning with the H1 89 & 200 EMAs.
EMA Structure (13 – 34 – 89 – 200): Still bullish but currently signaling a short-term pullback.
🔑 Key Price Zones:
Resistance Levels: 0.6014 – 0.6052
Support Levels: 0.5973 – 0.5951 – 0.5932
🧭 Trade Plan
📌 Buy Setup (trend continuation):
BUY ZONE: 0.5951 – 0.5932
SL: 0.5900
TP: 0.5978 → 0.6014 → 0.6052
📌 Expecting a bullish bounce off the 61.8% Fibo + EMA 200 confluence ahead of NFP.
📌 Sell Setup (short-term countertrend scalp):
SELL ZONE: 0.6014 – 0.6025
SL: 0.6060
TP: 0.5978 → 0.5951
📌 Anticipating a reaction at a key resistance zone – ideal for intraday scalpers.
⚠️ Risk Management Notes:
Stay cautious ahead of high-impact U.S. data (ADP, Jobless Claims, NFP).
Favor buying the dip in line with the higher-timeframe trend.
Maintain discipline with tight SLs (30–35 pips max per setup).

GBPUSD – Is the Recovery Losing Steam? GBPUSD – Is the Recovery Losing Steam? Watch for Technical Pullback Ahead of NFP
The GBPUSD pair has recently rebounded impressively from the 1.3427 key support zone, reflecting short-term USD weakness and growing speculation of rate cuts by the Fed. However, after the strong bullish move, the market is now showing signs of exhaustion and potential profit-taking—especially with high-impact US employment data just around the corner.
🔍 Macro & Fundamental Overview:
United States: All eyes are on this week’s JOLTS and Non-Farm Payrolls (NFP) reports. Weak jobs data could strengthen the case for rate cuts by the Fed in Q3, weighing on the US Dollar. On the flip side, a solid print would revive “higher for longer” rate expectations and likely support USD strength.
United Kingdom: Although inflation remains above the Bank of England’s 2% target, political uncertainty ahead of July’s general election may keep GBP on the defensive, especially if BoE signals a dovish turn.
Bond Yield Spread (UK vs US): A widening spread in favor of the USD is exerting downward pressure on GBPUSD in the medium term.
📈 Technical Outlook (H1 Chart):
Structure: Price has formed a double-top pattern at 1.35598 and 1.35322, with multiple rejections—signaling a weakening bullish momentum after a sustained rally.
EMA 13 – 34 – 89 – 200 Setup: Price is currently testing the EMA89 zone (~1.34854). A clean break below this moving average could accelerate the downside correction.
FVG Zone (Liquidity Pool): The 1.3427 – 1.3457 area offers a potential liquidity sweep and may serve as a springboard for the next bullish leg.
📊 Trade Scenarios:
🔻 Short-Term SELL SCALP:
Entry: 1.3532 – 1.3545
Stop Loss: 1.3565
Take Profit: 1.3485 → 1.3457 → 1.3427
→ Ideal if price fails to hold above recent highs and forms bearish rejection candles.
🔵 BUY ZONE Setup:
Entry: 1.3427 – 1.3440
Stop Loss: 1.3400
Take Profit: 1.3475 → 1.3505 → 1.3535 → 1.3555
→ High-probability entry if price reacts positively to the FVG zone and maintains bullish structure.
📌 Final Thoughts:
GBPUSD is currently in a delicate zone where both technical and macro forces are converging. While the broader trend remains bullish, momentum is slowing. With critical US jobs data due, traders should stay cautious and rely on clear confirmations around key price levels. Maintain strict risk management and look for liquidity-driven moves around FVG zones.

WAVE 3 PEAK OR SETUP FOR A NEW RALLY? XAUUSD PLAN – JUNE 3RD | WAVE 3 PEAK OR SETUP FOR A NEW RALLY?
After a massive $100 rally at the start of the week, gold has begun to pull back — dropping over $30 during the Asia session today. This is likely the end of Wave 3 (the strongest impulse in a 5-wave Elliott structure), as investors lock in profits and await key macro events.
🌍 MACRO & FUNDAMENTAL CONTEXT
A high-stakes call between Trump and Xi Jinping is expected this week, which could reshape short-term trade sentiment.
Investors are moving into cash positions, taking profits after Monday’s surge, and waiting for direction from the upcoming US-China negotiations.
Macro themes remain supportive for volatility: tariff risks, inflation worries, and geopolitical uncertainty.
📉 TECHNICAL OUTLOOK – H2 / H4 / D1
On the higher timeframes (H4 and D1), gold maintains a bullish structure, with EMAs aligned for upside continuation.
On intraday charts (M30–H1), we’re seeing a clean correction, likely to fill the Fair Value Gap (FVG) zone below.
The key BUY zone at 3320–3310 will decide direction:
If it holds: strong long setups.
If it breaks: possible structure shift and deeper downside.
🔑 KEY LEVELS TO WATCH
🟢 BUY ZONE: 3320 – 3318
SL: 3314
TP: 3324 → 3328 → 3332 → 3336 → 3340 → 3344 → 3350 → 3360 → ???
🔴 SELL ZONE: 3388 – 3390
SL: 3394
TP: 3384 → 3380 → 3376 → 3370 → 3366 → 3360 → 3350
📌 FINAL THOUGHTS
“Gold is in a healthy correction after a massive surge. The 3310–3320 zone is crucial. Hold it, and bulls may take over again — break it, and we may see a deeper pullback."
⚠️ Stay cautious ahead of political headlines. Any remarks from the Trump–Xi call could spark aggressive price action.

Will the Dollar’s Drop Fuel More Gold Upside After Weak PCE DXY OUTLOOK – Will the Dollar’s Drop Fuel More Gold Upside After Weak PCE and Trade Tensions?
📉 TECHNICAL STRUCTURE – DXY CONTINUES TO WEAKEN
The US Dollar Index (DXY) has failed to hold the 99.20–99.30 support zone and continues to respect its bearish structure on the H2 chart. The sharp sell-off at the end of May was a direct response to weaker-than-expected PCE inflation data, combined with growing political uncertainty surrounding US–China and US–EU trade negotiations.
🔻 Key Resistance Levels: 99.234 – 99.618
🔻 Key Support Zone: 98.030 – A clean break below this may open the door toward 97.50
🌍 MACRO CONTEXT – USD UNDER PRESSURE ON MULTIPLE FRONTS
Trump’s tariff decisions remain unclear. While some deadlines were delayed (e.g., steel tariffs on the EU), no substantial agreements have been reached.
Core PCE inflation – the Fed’s preferred gauge – continues to ease, reducing expectations of further rate hikes in the short term.
Institutional flows are shifting toward safe havens like gold, especially as uncertainty clouds the outlook for both US fiscal and trade policy.
📊 IMPACT ON XAUUSD – DOLLAR DROP GIVES GOLD ROOM TO RALLY
Gold remains supported by:
A weakening DXY trend
A bullish structure on H1 with EMA 13–34–89–200 alignment in favor of upside
Strong safe-haven demand heading into a new month with fresh capital inflows
If DXY breaks below 98.70 and slides toward 98.030, gold could extend its rally toward key resistance zones at 3348 – 3361.
🎯 TRADING STRATEGY (Based on DXY Bearish Continuation):
Prioritize buy setups on XAUUSD if DXY fails to reclaim the 99.23 resistance
Watch for a potential DXY pullback to resistance – if rejected, this would confirm momentum for gold to climb further
📌 NOTE: Traders should stay alert to any major news from the Fed or new developments in US–China–EU trade talks. While the current DXY structure favors continued downside, short-term pullbacks can provide gold with consolidation before another leg higher.

Gold Drops $30 in Asia as Month-End Profit Taking Hits Hard XAUUSD PLAN – Gold Drops $30 in Asia as Month-End Profit Taking Hits Hard
After a sharp rebound candle yesterday, gold unexpectedly reversed in the Asian session, plunging over $30 as market participants rushed to exit positions ahead of the monthly close. The move reflects strong technical rejection and potential macro pressure.
🌐 MACRO OUTLOOK – US-CHINA TRADE TENSIONS BACK IN FOCUS
Trade negotiations between the US and China are showing renewed signs of strain, especially around tariff policies.
The uncertainty has not triggered safe-haven flows into gold—a sign of waning momentum.
Dollar Index (DXY) remains range-bound, offering no clear direction.
Broad market sentiment indicates institutional cash-out behavior ahead of the weekly and monthly candle closes.
📉 TECHNICAL OUTLOOK – BEARISH STRUCTURE STILL INTACT
Gold is respecting a downward sloping channel on the H1 timeframe.
Price failed to hold above EMA 200, reinforcing bearish bias.
EMA 13 – 34 – 89 – 200 are in bearish alignment, showing continued downside momentum.
Support at 3274 – 3276 is a key reaction zone for potential scalping opportunities.
🔑 KEY PRICE LEVELS TO WATCH
🔴 SELL ZONE: 3322 – 3324
Stop-Loss: 3328
Take-Profit: 3318 → 3314 → 3310 → 3306 → 3300 → 3295 → 3290 → 3280
🟢 BUY ZONE: 3266 – 3264
Stop-Loss: 3260
Take-Profit: 3270 → 3274 → 3278 → 3282 → 3286 → 3290 → 3300
⚡ BONUS SCALP SETUPS
Support Zone 3274 – 3276 → Look for bullish rejection for a quick BUY SCALP (Target: 50 pips / SL: 50 pips)
Resistance Zones 3302 – 3304 and 3310 → Watch for early rejection to enter SELL SCALP, with extended downside targets.
📌 STRATEGY NOTES
Priority: Short-term sell bias unless price reclaims 3310 with momentum.
Avoid trading in the mid-range; wait for price to reach key reaction zones.
Today’s structure favors liquidity sweeps, so patience and disciplined entries are crucial—especially during London and NY overlap.

Recovery or Just a Bull Trap? All Eyes on PCE This WeekNZDUSD – Recovery or Just a Bull Trap? All Eyes on PCE This Week
🌐 MACRO & FUNDAMENTAL OVERVIEW
After the FOMC’s decision to keep interest rates unchanged, the US Dollar has shown signs of recovery driven by expectations that core inflation remains persistent — especially ahead of the upcoming US Core PCE Price Index release this Friday.
On the New Zealand side, the Kiwi remains under pressure due to recent weak economic data and negative sentiment from China — its largest trading partner. The RBNZ continues to maintain a neutral stance, offering little support for the currency in the near term.
Market sentiment remains cautious as investors await the PCE data to determine inflation trends and potential Fed policy shifts.
📉 TECHNICAL ANALYSIS (H1–H2 TIMEFRAME)
NZDUSD is forming a technical rebound after a strong bearish leg from the 0.60300 region. Current price is trading around the 38.2%–50% Fibonacci retracement zone (0.5964–0.5976), struggling to break above EMA89 and EMA200 resistance.
Overall structure: Bearish bias remains intact with lower highs.
EMA alignment: EMA13, EMA34, and EMA89 are in bearish formation.
Key support zone: 0.5926–0.5940, trendline confluence + consolidation base.
🔑 KEY LEVELS TO WATCH
Resistance:
0.5976 – Fibonacci 0.5 retracement + previous rejection zone
0.5990 – Structural resistance of the week
0.6007 – 78.6% Fib + liquidity sweep potential
Support:
0.5940 – Trendline retest + short-term structure
0.5926 – Key demand zone with previous fake breakout
🎯 TRADE IDEAS
SELL SETUP – Fade the pullback into resistance:
Entry: 0.5976 – 0.5990
Stop Loss: 0.6010
Take Profit: 0.5940 → 0.5926
BUY SCALP – On strong bullish rejection from support:
Entry: 0.5926 – 0.5930
Stop Loss: 0.5900
Take Profit: 0.5960 → 0.5976
Note: Confirm with bullish candlestick and volume spike before entry.
⚠️ STRATEGY OUTLOOK
NZDUSD remains in a corrective phase. This week’s PCE inflation data will be critical. A hotter-than-expected reading could strengthen the USD and push NZDUSD below 0.5926, resuming the medium-term downtrend.
Avoid chasing mid-range price action. Focus on price reactions near the key resistance and support levels.

EURUSD PLAN – Is the Rebound Just a Pause Before the Drop? EURUSD PLAN – Is the Rebound Just a Pause Before the Drop? | All Eyes on PCE
📊 MACRO OUTLOOK:
Following the latest FOMC meeting, the Fed kept interest rates unchanged, as expected, but maintained a hawkish tone. Chair Powell reiterated that inflation remains too sticky to consider rate cuts in the near term.
Markets now await this week’s US PCE data — the Fed’s preferred inflation gauge — which could provide the next major catalyst for USD strength or weakness.
On the Euro side, weak consumer confidence and tepid growth have strengthened expectations for an ECB rate cut in June. This divergence in monetary policy is weighing on the Euro, as the Dollar finds new demand amid global risk recalibration.
📉 TECHNICAL OUTLOOK (H1):
EURUSD has broken down from recent highs near 1.1412 and is now forming a bearish retracement pattern.
Price has broken below the 89-EMA and 200-EMA, signaling bearish structure.
Current price action suggests a temporary bounce from the 1.1260–1.1280 support zone (Fibo 38.2%–50%), but the broader trend remains bearish.
Fibonacci retracement from recent swing lows highlights 1.1338 and 1.1372 as key resistance levels to watch.
🔑 KEY TECHNICAL ZONES:
Resistance Zones:
• 1.1313 – Minor intraday level (Fibo 0.5)
• 1.1338 – EMA confluence + former structure
• 1.1372 – Major rejection zone (previous distribution top)
Support Zones:
• 1.1280 – 1.1260 – Current support bounce area
• 1.1220 – Key liquidity sweep zone
🧭 TRADE STRATEGY:
Scenario A – Sell the Pullback:
• Wait for a rebound into the 1.1313 – 1.1338 zone
• Enter SELL if bearish rejection forms
• SL: 1.1376
• TP: 1.1280 → 1.1260 → 1.1220
Scenario B – Invalid Breakout:
• If price breaks above 1.1372 with momentum, this plan is invalidated — wait for a confirmed breakout retest.
Scenario C – Reactive Buy Scalp:
• If price shows strong rejection from 1.1260 again, scalpers may consider a temporary BUY back toward 1.1300–1.1310
• This is high-risk and counter-trend.
⚠️ STRATEGIC NOTES:
EURUSD remains in a bearish bias until major resistance levels are broken. With PCE data approaching, volatility is likely. Trade setups should be based on confirmation signals and managed tightly as macro data can shift momentum rapidly.

XAUUSD – Post-FOMC Trading Plan | Key Resistance: 3308 – 3310XAUUSD – Post-FOMC Trading Plan | Key Resistance: 3308 – 3310
📊 MACRO UPDATE – After the FOMC Decision:
The Fed kept interest rates unchanged as expected, but the tone remained hawkish. Chairman Powell reiterated that inflation remains too high and ruled out any near-term rate cuts, signaling prolonged restrictive policy.
This led to a swift rebound in the US Dollar and Treasury yields, weighing on gold. However, XAUUSD bounced back late in the session, suggesting the market is re-evaluating key technical zones post-announcement.
📉 TECHNICAL ANALYSIS – H1/H4 Chart Structure:
Gold remains in a corrective descending structure but is now reacting around key Fibonacci levels. The 13–34–89 EMAs provide dynamic support and resistance, and a potential double bottom has formed near the 3245–3247 zone.
🧠 Two key levels to watch:
3308–3310: major resistance with trendline + FVG confluence
3245–3247: strong horizontal support + Fib 0.618 retracement
🎯 TRADE SETUPS:
🔵 BUY ZONE: 3247 – 3245
Stop-Loss: 3241
Take-Profit: 3251 → 3255 → 3260 → 3264 → 3270 → 3275 → 3280
🔵 BUY SCALP: 3263 – 3261
Stop-Loss: 3257
Take-Profit: 3266 → 3270 → 3275 → 3280 → 3290 → 3300
🔴 SELL SCALP: 3294 – 3296
Stop-Loss: 3300
Take-Profit: 3290 → 3286 → 3282 → 3278 → 3274 → 3270 → 3260
🔴 SELL ZONE: 3308 – 3310
Stop-Loss: 3314
Take-Profit: 3304 → 3300 → 3296 → 3292 → 3288 → 3280
📌 STRATEGIC OUTLOOK:
Unless price breaks above 3310 with strong momentum, sellers are still in control short term. Any rejection from the resistance zone could offer clean short entries. A breakout, however, would shift sentiment and expose 3340–3360 next.
Patience is key — let price react before committing to entries.

Will Gold Break Through 3366 or Collapse Before NFP? XAUUSD PLAN – MAY 26 | Will Gold Break Through 3366 or Collapse Before NFP?
Gold is approaching a key resistance zone as geopolitical uncertainty and shifting Fed signals add volatility to global markets. While recent bullish momentum has been strong, traders should prepare for potential shakeouts ahead of NFP week.
🌍 MACRO & FUNDAMENTAL CONTEXT
US–Iran Tensions on the Rise: Iran has warned the US it will bear full responsibility if Israel attacks its nuclear facilities. This comes just days before both sides are scheduled to resume nuclear negotiations, increasing the risk of escalation.
Goldman Sachs Signals a Safe-Haven Shift: With 20-year US bond auctions failing and yields surging, Goldman Sachs now recommends gold and Bitcoin as core hedge assets against fiscal instability and a weakening dollar.
DXY Losing Steam: The US Dollar Index is cooling off after a short-term rally, with Fed rate hike expectations becoming less certain.
📉 TECHNICAL ANALYSIS – XAUUSD (M30 – H1)
Gold is consolidating in a bullish structure, bouncing within a rising channel and showing signs of potential continuation.
EMA13/EMA34 have crossed above EMA200 on the M30 chart → a sign of trend strength building.
A large Fair Value Gap (FVG) remains unfilled near 3360–3395 → potential magnet zone if bullish breakout succeeds.
🎯 TRADE SETUPS FOR TODAY
🟢 BUY SCALP
Entry: 3304 – 3302
SL: 3298
TP: 3308 → 3312 → 3316 → 3320 → 3325 → 3330 → 3340
🟢 BUY ZONE
Entry: 3276 – 3274
SL: 3270
TP: 3280 → 3284 → 3288 → 3292 → 3296 → 3300
🔴 SELL SCALP
Entry: 3344 – 3346
SL: 3350
TP: 3340 → 3336 → 3332 → 3328 → 3324 → 3320
🔴 SELL ZONE
Entry: 3376 – 3378
SL: 3382
TP: 3372 → 3368 → 3364 → 3360 → 3350
🧩 STRATEGIC KEYLEVELS
Key SELL Zone: 3358–3360 → If broken, gold may rush toward ATH targets.
Key BUY Zone: 3276–3274 → If lost, a deep retracement below 3200 is likely.
⚠️ NOTES TO TRADERS
This is a geo-politically sensitive market. Sudden news or tweets can trigger explosive moves.
Always wait for confirmation near key zones. Don't chase breakouts without structure.
Risk management is critical.
✅ SUMMARY:
"Political risk is the fuel. Gold is the fire. Stay sharp around the key levels and don't get caught in false breakouts. Be reactive, not predictive."

USDCHF – Awaiting Breakout Ahead of FOMC: Key Levels in Focus USDCHF – Awaiting Breakout Ahead of FOMC: Key Levels in Focus
📌 MARKET OVERVIEW
USDCHF is currently consolidating within a tight range after a technical rebound from the 0.8226 support zone. The price is testing a confluence area at the descending trendline and the 200 EMA on the H2 chart, indicating indecision between bulls and bears as we head into the high-impact FOMC event.
🔍 TECHNICAL ANALYSIS – H2 CHART
Overall Trend: Sideways corrective move within a broader downtrend channel. Price is approaching critical resistance at the EMA200 and the channel’s upper boundary.
EMAs in focus: EMA13 (black), EMA34 (orange), EMA89 (red).
Fibonacci Retracement: Price is hovering around the 0.5 fib zone (0.8298), a neutral level for potential reaction.
🎯 Key Levels & Trade Scenarios:
Major Resistance Zone: 0.8330 – 0.8368 → aligned with the 0.618 Fibonacci retracement and previous structural high.
Key Support Zone: 0.8226 → strong demand area. A break below this could expose deeper downside or set up a false break trap.
📌 Most Likely Path:
Price could dip back to 0.8226 before launching a bullish recovery targeting 0.8330 – 0.8368.
A clean breakout above 0.8368 with momentum and volume could invalidate the bearish bias and shift the trend mid-term.
🌍 MACRO & FUNDAMENTAL CONTEXT
FOMC IN FOCUS: The Federal Reserve is expected to hold rates steady at the upcoming meeting. However, market attention will be on Powell’s tone. A hawkish stance could fuel further USD strength, propelling USDCHF toward resistance zones.
SNB (Swiss National Bank) maintains a neutral tone with slight disinflationary concerns, offering limited support for the CHF and strengthening the USDCHF upside case.
US Treasury Yields are showing signs of recovery, adding bullish pressure to USD pairs.
📌 TRADING STRATEGY:
Watch for bullish reaction at 0.8226 – potential long setup if RSI divergence appears.
Short-term targets: 0.8330 → 0.8368.
Breakout Strategy: If price clears 0.8368 with conviction, shift bias to bullish continuation and monitor for FVG or trendline breakout alignment.
📣 Stay sharp for increased volatility around FOMC. Position sizing and discipline are key in macro-heavy weeks like this.

DAX: Continues higher?Huge drop on the left side which happens to reset the trend similar to NAS. Maybe DAX could continue to rally from this point forward, however, there is a huge gap that hasn't been filled yet.

Double Top Alert: Key Resistance at 1.3570 Before US PCE DataGBPUSD PLAN – MAY 27 | Double Top Alert: Key Resistance at 1.3570 Before US PCE Data
GBPUSD is currently testing a critical resistance zone near 1.3570, forming a potential Double Top pattern. As markets await this week’s US Core PCE inflation release, the pair may be at risk of a short-term pullback.
🌍 MACRO FUNDAMENTALS
USD Rebounds Slightly ahead of April’s PCE inflation report – a key Fed inflation gauge due this Friday.
GBP Under Pressure as dovish tones from Bank of England (BoE) officials signal a potential pause in rate hikes.
UK Political Uncertainty and sluggish EU-UK trade talks continue to dampen investor confidence in the pound.
📊 TECHNICAL ANALYSIS
Price Structure: GBPUSD surged from 1.3446 support but is now facing resistance near 1.3570, where a Double Top formation is emerging.
Key Levels:
Resistance: 1.3570 – 1.3580 (previous high and psychological barrier)
Support 1: 1.3496 (confluence of EMA89 and 38.2% Fibonacci retracement)
Support 2: 1.3446
Indicators:
EMA13, EMA34 show early signs of bearish crossover on the 30-minute chart.
RSI approaches overbought territory, hinting at potential bearish divergence.
🎯 TRADE SETUP (IF PRICE REJECTS 1.3570)
🔻 SELL SETUP
Entry: 1.3570 – 1.3550
Stop-Loss: 1.3595
Take-Profit Targets:
TP1: 1.3496
TP2: 1.3446
📌 A bullish breakout only becomes valid if price closes strongly above 1.3590 on the H1 chart.
🧠 STRATEGIC NOTES
Wait for a clear reaction or bearish confirmation near 1.3570 before entering trades.
Avoid chasing trades mid-range; focus on clean breakouts or rejections.
PCE data may trigger volatility — manage risk tightly and prepare for directional momentum.
👉 What do you think of this Double Top scenario? Will GBPUSD reject or break through resistance? Drop your analysis below and follow for daily structured plans!

USD/CHF Trading Plan USD/CHF Trading Plan – Technical Rebound Near EMA89, Resistance Ahead at 0.8298
📌 Market Overview
USD/CHF is showing signs of technical recovery after a recent sell-off from the 0.8338 high. The current retracement is supported by price action rebounding near the 0.8212 zone — a key demand area that aligns with the EMA89 on the H1 timeframe.
However, the broader structure remains uncertain as the pair awaits directional cues from upcoming US macroeconomic data and market sentiment around the Swiss franc’s safe-haven flows.
🔍 Technical Outlook
Main trend: Still bearish on higher timeframes
Short-term bias: Technical bounce in play
EMA Setup: EMA13 and EMA34 are curling upward → but EMA89 acts as strong dynamic resistance above
🔑 Key Technical Zones:
Resistance:
0.8264 – 0.8298 → short-term resistance area
0.8320 – 0.8338 → previous supply zone and daily structure resistance
Support:
0.8235 → minor intraday support
0.8212 → EMA89 retest + breakout demand block
0.818x → historical low and deeper demand zone
📊 Trade Scenarios
✳️ Scenario 1 – SELL Setup Near Resistance
If price retests the 0.8298 zone and prints reversal signals → short the bounce
Entry: 0.8290 – 0.8298
SL: 0.8320
TP: 0.8260 → 0.8235 → 0.8210
✳️ Scenario 2 – BUY the Retest Near Support
If price pulls back to 0.8212 and holds structure with EMA89 confluence → potential short-term BUY
Entry: 0.8212 – 0.8220
SL: 0.8185
TP: 0.8235 → 0.8260 → 0.8290
⚠️ Strategy Note:
Avoid buying into resistance at 0.8298 unless there's a strong breakout with volume. Current price action favors "sell on rally" setups unless key zones break decisively.
🌐 Macro Context
Upcoming PCE Data (May 31): The US Personal Consumption Expenditures index could spark volatility. Weak data may pressure the USD and strengthen CHF.
Geopolitical Tensions Ease: Risk-off flows into CHF have cooled slightly as US-EU trade concerns subside.
SNB vs. Fed Outlook: The Swiss National Bank remains dovish, but the Fed’s uncertain tone limits USD upside. Yield differentials remain supportive for USDCHF to stay choppy within range.
✅ Final Thoughts
USDCHF is staging a mild technical rebound but still faces significant hurdles near 0.8298. Sell setups remain favorable near resistance while buy scalps are valid around EMA89 if price confirms structure.

Pullback or Deeper Reversal After False Breakout Near 1.1425? EUR/USD Weekly Plan: Pullback or Deeper Reversal After False Breakout Near 1.1425?
🧭 MARKET OVERVIEW
EUR/USD surged toward a new monthly high at 1.1425 earlier this week but quickly lost momentum and retraced to the 1.137x zone as the US Dollar bounced back. While the short-term recovery in DXY supported the dip, macro uncertainty surrounding Trump’s erratic trade policies continues to raise questions about the dollar’s long-term credibility.
Meanwhile, Germany’s revised Q1 GDP growth of 0.4% (vs. 0.2% prior) helped support EUR, reinforcing its appeal as a safe alternative to the greenback.
📊 TECHNICAL ANALYSIS (H1 Chart)
Main Trend: Short-term correction after strong bullish rally
Resistance Levels:
1.14165 → Previous top, strong reversal zone
1.14017 → Minor supply zone
Support Levels:
1.13476 → Key break structure zone
1.12791 → Daily demand zone & previous FVG bottom
Indicators:
EMA 20 & EMA 50 crossover signals weakening bullish momentum
Price Pattern: Potential double top forming below 1.1425
🌐 MACRO & FUNDAMENTAL CONTEXT
Trump’s tariff threat postponed to July 9, but his unpredictable tone weakens USD trust.
Germany Q1 GDP upgraded to 0.4% → boosts confidence in Eurozone’s economic resilience.
ECB expected to cut rates in June, with policymakers showing confidence inflation will reach 2% target this year.
This week’s key focus:
→ US PCE Price Index (April)
→ EU May HICP (CPI)
These will drive short-term volatility and determine breakout/reversal confirmation.
✅ TRADE SETUPS
🔴 SELL ZONE:
Entry: 1.1400–1.1416
SL: 1.1440
TP: 1.1382 → 1.1347 → 1.1279
🟢 BUY SCALP ZONE:
Entry: 1.1345–1.1347
SL: 1.1320
TP: 1.1382 → 1.1400
📌 Preferred scenario: Look for bearish confirmation around 1.1400–1.1416 to enter short. Avoid aggressive buys unless price strongly holds above 1.1384.
🧩 CONCLUSION
EUR/USD is showing signs of exhaustion after testing 1.1425. If bears reclaim 1.1384 and hold below 1.1347, deeper correction toward 1.1279 is likely. Conversely, if bulls defend 1.1345 and CPI/PCE data disappoints, price may retest highs.
