Chainlink (LINK) Price Eyes a Push Toward the Top of Its Channel* The Chainlink price is trading inside a tight channel, with momentum slowly starting to pick up.
* On-chain data indicates steady, real network usage rather than short-term speculation.
* LINK is approaching the top of its channel, a level that could shape the next move.
If you step back and look at what Chainlink has been doing lately, one thing stands out right away: nothing feels rushed. There’s no panic, no aggressive selling, and no breakout mania either. LINK is just moving sideways inside a tight range, and that kind of price action tends to make people tune out because it feels boring.
For a while now, the LINK price has been slowly compressing inside its channel. Every bounce runs into resistance, and every dip finds buyers waiting. It’s the kind of market that feels awkward to trade because nothing follows through. Momentum traders lose interest, and the broader narrative around LINK goes quiet.
That’s exactly why this phase is important. LINK isn’t falling apart. Buyers are clearly defending the $12–$13 area, and sellers haven’t managed to push the price meaningfully lower. At the same time, buyers aren’t quite strong enough yet to break through the top of the channel. The market is paused, not weak.
This setup is nothing new for Chainlink. In past cycles, similar low-volatility stretches showed up near the end of long consolidation periods. Volume dried up, momentum flattened, and the price went nowhere long enough for most people to stop watching. When that happened, LINK often moved once expectations were low and positioning had thinned out.
On-chain data backs this up. Market cap has been creeping higher, active addresses are still rising, and transfer activity looks steady. That points to ongoing network use and gradual positioning, not speculation or large-scale selling.
So what comes next for LINK?
At this point, structure matters more than hype. As long as the LINK price holds its support zone and continues tightening beneath resistance, the setup stays intact. A move toward $14.63 with stronger volume would start putting real pressure on sellers.
Right now, LINK isn’t grabbing headlines. Price is grinding, volatility is low, and excitement is missing. But those quiet phases are often when things start to shift, especially for an asset that tends to move once the market stops paying attention.
Chainlink

LINK: Descending Triangle, Breakout or Breakdown? Price is coiling tight inside a classic bearish setup.
🔴 descending trendline capping lower highs
🔵 resistance holding at $14
Current state: Bearish structure intact
Price bouncing off $14 but failing to escape
Volume drying up, classic pre-breakout signal
Bullish escape needs to break the bearish structure
🚀 Must close above $14 with conviction
- Smash the blue resistance
- Volume spike to confirm buyer control
Without $14 break:
📉 Expect downside continuation
Target: Measure triangle height downward
Next support zones marked clearly
Key levels to watch:
✅ $14 – Make or break
❌ Below = Bears win
📈 Above = Bulls flip the script
DYOR – Trade smart, manage risk!

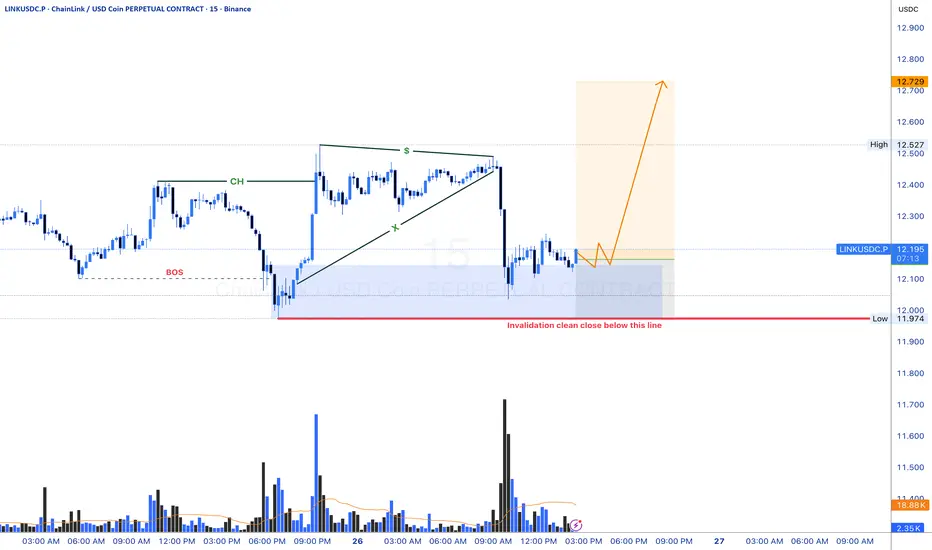
Link USD LONG IDEA. (BULLISH ORDER FLOW)Market Structure Context
Overall structure remains bullish (higher highs & higher lows).
Recent downside move is corrective, not impulsive.
No bearish break of structure on the higher timeframe → trend intact.
Key Zones (Institutional Interest)
Bullish Order Block at the origin of the last impulsive up-move.
⚠️ Disclaimer
This setup assumes normal market conditions.
Avoid trading during major news releases.
TradeCityPro | LINK Compressing in Triangle, Breakout Ahead👋 Welcome to TradeCity Pro!
In this analysis, I want to review LINK, one of the RWA projects, which with a market cap of $8.78 billion is ranked 12th on CoinMarketCap.
⏳ 4-hour timeframe
On the 4-hour timeframe, LINK has a support zone near the $12 area, and together with a descending trendline, it has formed a descending triangle.
🎯 The trigger for breaking this triangle to the downside is the break of the $12 support zone, and 12.16 will be the first short trigger.
⚡️ However, if the triangle breaks to the upside, we can open a long position using the 12.80 trigger. In this case, the price can move toward 14.65.
📊 The volume on this coin has been decreasing for about a week and is gradually getting lower. If the breakout of either trigger is accompanied by increasing volume, the new trend can continue.
💥 Overall, since the price is currently between 12.16 and 14.65, the market does not have strong momentum, and for this reason, we can open both long and short positions.
📝 Final Thoughts
Stay calm, trade wisely, and let's capture the market's best opportunities!
This analysis reflects our opinions and is not financial advice.
Share your thoughts in the comments, and don’t forget to share this analysis with your friends! ❤️

LINKUSDT – Weekly TimeframePrice is currently reacting at a major support zone that has been respected multiple times in the past.
This area previously acted as both support and resistance, making it a key decision point for the market.
Market structure
Higher timeframe structure is still correcting
Price is testing a previous support area
Momentum has slowed down, showing hesitation
Scenario 1 – Support holds (bullish):
If buyers step in and this support holds, we could see a relief move towards the next resistance zone, where price was previously rejected.
Scenario 2 – Support fails (bearish):
If this support breaks with a strong close, price may continue towards the lower support zone, which acted as a base earlier in the structure.
Conclusion:
Price is at a make-or-break area. Waiting for confirmation is safer than anticipating the move.
Do you expect a bounce from support or a breakdown continuation?
MrC

LINK to 3 dollars -- Last exit before the elevator down.Chainlink is flashing a head and shoulders.
It is looking to break the previous bear market lows.
And there are fib retracement confluence projections that align with single digit prices.

LINK - Same Base, Same Question: Is Another Impulse Loading?📊LINK has been respecting a very clean long-term structure.
Each major sell-off has found support around the rising blue trendline, followed by a strong impulsive move higher. This behavior has repeated multiple times, creating a clear rhythm:
correction → base → impulse.🔁
Right now, price is once again sitting on that same structural support, right above the horizontal support zone. The market has slowed down, volatility has compressed, and sellers are losing momentum, conditions that often precede expansion.
The big question now is simple 🤔
Will LINK deliver another impulse from the same base?
⚔️As long as price holds above the trendline and support, the focus remains on trend-following bullish continuation. A clean reaction here keeps the structure intact. A decisive break below would invalidate the setup and change the narrative.
Patience matters here. Let price confirm its intent.
⚠️ Disclaimer: This is not financial advice. Always do your own research and manage risk properly.
📚 Stick to your trading plan regarding entries, risk, and management.
Good luck! 🍀
All Strategies Are Good; If Managed Properly!
~Richard Nasr

Chainlink (LINK) – The Final Stage of a 5-Year CompressionChainlink (LINK) – The Final Stage of a 5-Year Compression**
The chart is telling one very clear story:
> **Chainlink is approaching the end of a 4-year descending macro trend while sitting on a 3-year accumulation floor.**
> The moment these two structures converge, a major regime shift usually follows.
**“The 5-Year Pressure Is About to Break.”**
---
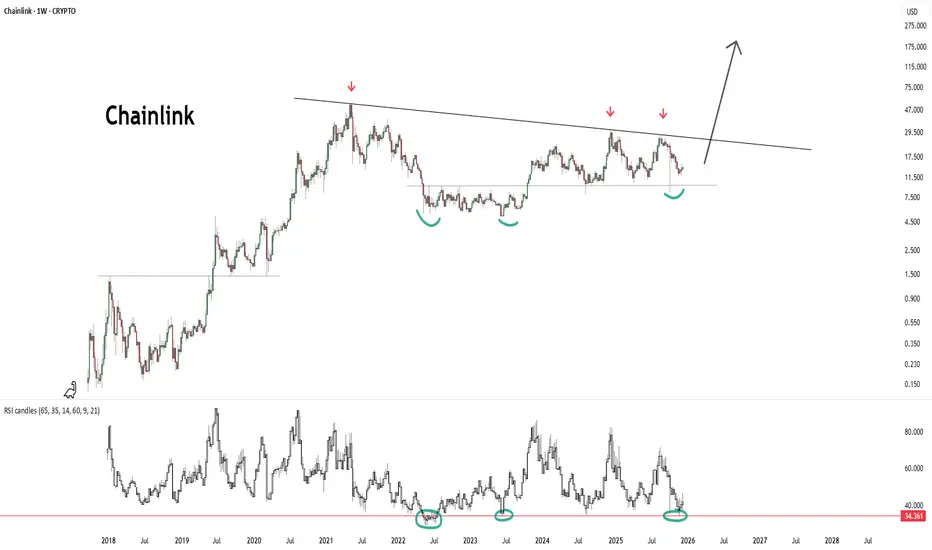
🔹 **1) The 4-Year Descending Macro Trend (2021 → 2025)**
The red arrows mark the same long-term trendline connecting the major tops of:
* 2021
* 2022
* 2024
This line has acted as the **spine of the bear market**.
And LINK is now marching **back into this line for the next major test**.
A break here is not just a trend break.
It is a **market regime shift**.
---
🔹 **2) The 3-Year Horizontal Accumulation Floor**
The green curved bottoms highlight how:
* 2022
* 2023
* 2024
* and late 2025
have all produced **identical bottom structures** around the 12–13$ region.
This is:
**A large, asymmetric inverse H&S (iH&S) structure**
Ugly, uneven, but extremely powerful.
Key observations:
* Bottoms don’t break
* Selling is absorbed
* Volatility is compressing
* Strong structural demand refuses to give way
This is **large-scale accumulation**, not weakness.
---
🔹 **3) Weekly RSI – The Macro Cycle Floor**
The RSI bottom line around **34** has marked every major cyclical low since 2018:
* 2018 bear bottom
* 2020 crash
* 2022 bear bottom
* 2023 correction
* **And right now**
LINK’s **macro oscillator cycle is at bottom territory** — a region historically followed by multi-month expansions.
---
🔹 **4) Technically, the picture is this:**
* **A 4-year descending trendline above**
* **A 3-year accumulation zone below**
* **RSI sitting at cycle lows inside**
This is the type of setup that precedes massive impulsive waves.
---
⭐ **"Chainlink is coiled inside a high-timeframe expansion structure."**
When these structures break, they don’t produce small moves —
they produce **cycle expansions**.
---
🔹 **5) Fundamental Drivers – Why This Cycle Is Different for LINK**
Chainlink now sits at the center of crypto’s real infrastructure layer.
**1) CCIP (Cross-Chain Interoperability Protocol)**
Adopted by:
* BlackRock
* DTCC
* SWIFT
* Multiple banks and RWA platforms
2024–2025 marks the first time traditional finance begins using LINK’s infrastructure at scale.
**2) Oracle fee growth**
The rise of RWA (Real-World Assets) means:
* More data feeds
* More volume
* More fees
* More burn pressure on the token economy
Chainlink’s tokenomics finally enter a structurally bullish regime.
**3) Macro Altcoin Liquidity Expansion**
In every cycle, certain infrastructure tokens become early movers.
LINK is positioned to be one of them due to:
* Dominance in the oracle sector
* Institutional integrations
* Network effects
---
🧭 **6) Probable Scenario (Technical)**
**Bullish scenario (primary expectation):**
* Break above the 4-year trendline
* Weekly close above **18–20$**
→ 29–32$
→ 46$
→ **Macro target: 70–75$**
**Bearish scenario (lower probability):**
* Breakdown below 13$
→ liquidity sweep toward 9–10$
(Indicators currently reject this scenario)
Log MACD
---
LINK/BTC 1w
LINKBTC has been compressing inside a falling wedge for nearly 6 years — one of the longest and cleanest structures in the entire market.
Multi-cycle descending trendline overhead
Perfectly defended accumulation line below
Volatility squeezed to historical lows
Sellers exhausted
Breakout energy building
LINKUSD and LINKBTC both aligning for macro upside
This is not a short-term chart.
This is a cycle-level setup.
And setups like this usually end the same way:
“Compression → Breakout → Parabolic Repricing vs Bitcoin.”
LINKBTC has been “ignored” for years because LINK’s USD pair looked stable while BTC outperformed.
But structurally:
BTC strength pushed LINKBTC down
LINK never lost its demand trendline
A massive energy coil has formed
When BTC dominance stalls or rotates,
LINKBTC normally enters a full expansion cycle.
Historically:
LINKBTC expansions are violent
They outperform BTC by 2–4× in strong phases
This pattern is setting the stage for another one.
🎯 **Conclusion
**Chainlink is approaching the most important structural point since 2020.**
The alignment is extremely rare:
* RSI at cycle lows
* Price at a 3-year demand floor
* Approaching a 4-year macro trendline
* CCIP adoption accelerating
* RWA growth pulling LINK into real-world usage
This is not a normal chart.
This is a **macro cycle setup**.
And these setups usually play out like this:
> **“Trend breaks → FOMO awakens → Expansion begins.”**
LINK It will grow soon...The wedge pattern will break in the direction it is breached, and the price will move in that direction. In my opinion, the price could be Bullish and may up to $17.

Chainlink (LINK) Approaching Decision ZoneSymbol: LINK USDT
Timeframe: 4H
LINK is retesting the breakout zone after reclaiming the long term descending trendline.
The market is approaching a key liquidity pocket that will decide the next wave.
Key Points:
• Price reclaimed the multi week trendline
• Consolidation happening inside a golden retrace region
• Breakout retest structure gives a cleaner bullish continuation setup
• Fibonacci 0.5 to 0.786 cluster acting as the main decision zone
Bullish Scenario:
If LINK holds the 12.3 to 12.8 support box and confirms a higher low
then a push toward 14.92 and 17.65 becomes highly probable.
Momentum favours a continuation if buyers step in at the retest.
Bearish Scenario:
Failure of the support box opens the door to 12.29 and even
11.60 where the next liquidity pocket is waiting.
What I am watching:
• Stability above 13.5
• Reaction at the trendline retest
• Volume confirmation on bounce

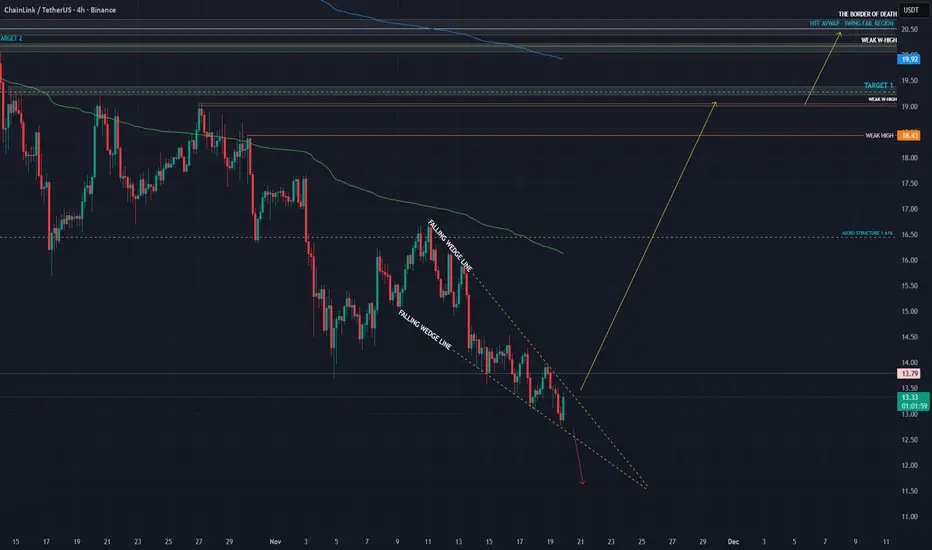
CHAINLINK – LONG - A WHISPER BEFORE THE BREAKOUTTraders,
I believe BINANCE:LINKUSDT is quietly setting up for another leg up. Let me walk you through the logic.
HTF structure - wedge breakout and retest
Price has broken out of a HTF falling wedge that has been guiding price action for weeks. A falling wedge is a compression pattern where:
Highs and lows are both trending lower
The upper trendline is steeper than the lower one
So sellers are still in control on the surface, but every push down is getting less effective. Once price breaks above the upper wedge line with an impulsive move, it usually means:
Most of the aggressive sell pressure inside the pattern has been absorbed
New buyers are willing to chase higher outside of that structure
That is exactly what I see on $LINKUSDT.
After the breakout, price rotated back down and is currently testing an imbalance zone around 13.75. This area:
Is the origin of the last impulsive leg up
Lines up with a clean Fib potential reversal zone on the LTF
So from a pure structure point of view this is a classic breakout → retest → potential continuation setup.
Order flow - hidden bull divergence and absorption
To see if the idea is backed by real flows, I zoomed into the CVDs and open interest.
On the pullback into 13.7 to 13.8:
Aggregated CVD Spot makes lower lows
Aggregated CVD Futures (stablecoin margined and coin margined) also print lower lows
While price holds a higher low compared to the previous swing
That is a hidden bullish divergence between price and CVD. In simple language: more market selling is hitting the books, but price refuses to break down. This usually means:
Sell pressure is being absorbed by passive buyers
Strong hands are using the dip to accumulate rather than distribute
Open interest supports that idea:
Stablecoin margined OI bled lower during the pullback, which suggests late longs getting flushed and some short covering
Coin margined OI is starting to curl up from the lows, which often signals new directional positioning right where CVD is making new lows and price is holding
That combination looks more like reloading than topping.
Targets and TPO weak highs
Now to the upside magnets. On the HTF and weekly TPO I am watching a series of weak highs that have not been properly tested:
1. 19.03 area - weekly TPO weak high
Formed with very little excess on the profile
Built mostly outside RTH, so it carries less conviction
These kinds of highs often get swept for liquidity before any real reversal happens
2. 20.20 area - second weekly TPO weak high
Similar story, clean horizontal high, thin rejection
Again, not much time spent there, so it looks more like an unfinished auction than a completed top
In my view, both of these levels are liquidity pools rather than solid resistance. If the current wedge breakout plays out, I expect price to at least probe and likely run these highs. From there, my HTF roadmap looks roughly like this:
Major Target 1: sweep the 19.0 weak high and push into the 20.0 to 20.2 block
Major Target 2: extension toward the 10 October liquidation event local high, which I have marked on the chart, and beyond that into the 22.7 to 23.6 region if momentum really kicks in
I also believe that altcoins as a group are eyeing that 10 October liquidation event local high. Many charts show similar untested spikes there, so a broad alt sweep of that zone would fit nicely with this BINANCE:LINKUSDT structure.
Invalidation
No setup is complete without an invalidation. For me the idea loses its edge if:
Price accepts back inside the broken wedge, not just a wick, but clear trade and structure back under the upper wedge line
Especially if that happens with CVD rolling over and OI expanding to the downside
If we get that, it would tell me that the breakout was a trap and that the current demand at 13.7 to 13.8 was not strong enough to hold.
Until that happens, as long as price is holding above the wedge and above the imbalance, I treat this as a constructive continuation setup with unfinished business at those weekly weak highs and the October local high.
As always, the market speaks softly before it moves loudly . Listen well, Nomads.
---------------------------------------------------------------------
If this helped, feel free to like, comment, or share your thoughts below.
---------------------------------------------------------------------
Abbreviation List
HTF – Higher Time Frame
LTF – Lower Time Frame
CVD – Cumulative Volume Delta
OI – Open Interest
TPO – Time Price Opportunity
PRZ – Potential Reversal Zone
RTH – Regular Trading Hours

LINK is at the first POIChainlink is retesting a major long-term trendline that has acted as support for nearly two years. Price has pulled back into a high-volume node, suggesting this region is where the market historically agrees on value.
Momentum is starting to stabilize after a heavy corrective phase, and multiple higher-timeframe oscillators are showing early signs of exhaustion from sellers. As long as LINK holds this structural base, the setup favors a potential rebound back into the mid-range.
However, losing this support would open the door to the next volume pocket lower, where liquidity becomes thin and volatility increases.
This is a key moment for LINK: hold the trendline and re-enter the range, or break down and revisit the lower demand zone.

LINK/USD LONG SET UP(Swing Trade)Entry 1 $12.50
Entry 2 $10.00
Stop loss $8.50
Take profit 1- $16.50
(Close 25%)
Take profit 2- $20.50
(Close 50%)
Take profit 3-$24.50
(Close 75%)
Take profit 4-$28.50
(Close 100%)

ChainLink LINK price analysis#LINK is literally standing on the edge…
Right now the price is hanging by a thread:
⚠️ a daily close below $11.50 is highly undesirable — this could open the door to a much deeper drop.
🕒 On the 3D timeframe, the OKX:LINKUSDT chart looks extremely intriguing.
Where do you see #LINK six months from now?
➡️ A push toward $53
or
⬅️ A slide into the $5.50–7.00 zone?
📊 Current #Chainlink market cap: $8B.
Hypothetically, in six months it could be either:
🔻 $4–5B, if the market keeps pressing lower
or
🔺 $37B, if the trend flips and demand flows back in.
❓ What scenario are you leaning toward? A long-term rebound or a deeper liquidity sweep first?
______________
◆ Follow us ❤️ for daily crypto insights & updates!
🚀 Don’t miss out on important market moves
🧠 DYOR | This is not financial advice, just thinking out loud

LINKUSD - ChainLink | Biggest Oracle In CryptoHi,
Chainlink is the biggest blockchain platform that bridges blockchain-based smart contracts and real-time external data.
This is not a trading advice.
Thanks
Gex

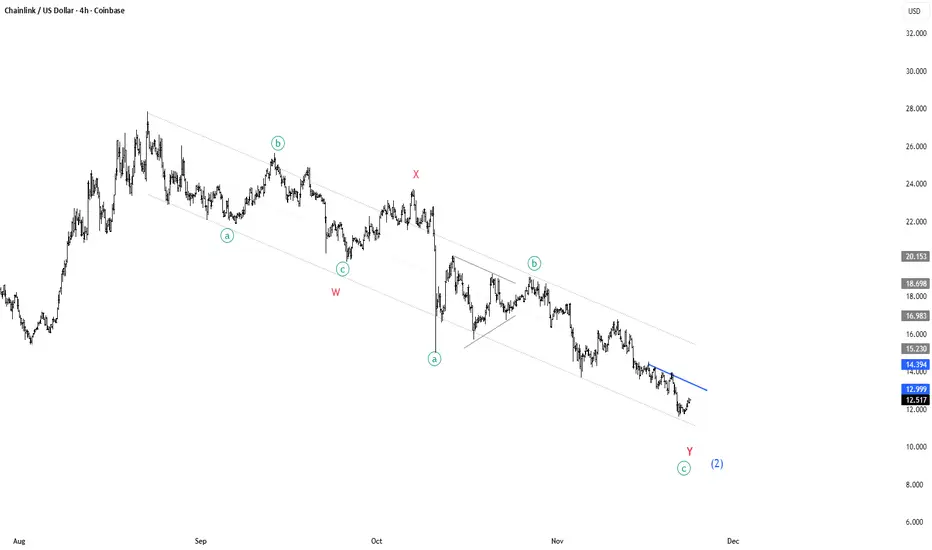
CHAINLINK is turning around for a massive rally!🔗 CRYPTOCAP:LINK – Elliott Wave Breakdown (4H Chart)
Current structure still fits a W–X–Y corrective decline, but we’re now approaching a critical trigger level. A clean punch through the blue trendline = buy signal. 🎯
🟦 What the structure shows:
🔻 Wave W complete:
• Clear a–b–c zigzag
• Strong reaction into the X connector
🔷 Wave X at the mid-channel zone:
• Acts as the next major upside target if we break out
• Provides structural symmetry between W and Y
🔻 Wave Y in progress:
• Again forming a–b–c
• C-leg looks terminal, aligning with channel support
📉 Price is compressing under the descending blue trendline (b-wave resistance of Y)
🚀 Trade trigger:
A decisive breakout above the blue trendline = start of the next impulsive leg
Upside target: the region around the prior X high
That zone is both:
• 🔹 Structural retracement
• 🔹 Upper channel magnet
• 🔹 Ideal first take-profit region
📌 Summary:
Break the blue line ➜ bullish confirmation ➜ target = X-level.
Still corrective, but the next impulse is close. ⚡
CHAINLINK - LOADING A SUPER SWEEP UP! - Traders,
In my last $CHAINLINK analysis
I wrote out two scenario’s.
Scenario 1 did not play out. Scenario 2 was simple: a dump into the next 1.618 extension, and from there the hunt for a fresh long setup begins. That 1.618 was at 12.90$
And here we are.
Pixel perfect.
So are we wrong? This is why having your levels outlined and being patient matters more than anything. When one path closes, structure reveals another. The chart always speaks.
But only those who wait can hear it.
What we are looking at
$CHAINLINK dumped straight into the 12 to 13 dollar zone.
This zone is not random. It is technically one of the most important pockets on the chart.
Let’s break down why.
Mathematical Levels – The Spot Chart
To avoid distortion caused by the 10 October liquidation wick, we start with clean mathematical levels on the spot chart.
At 12.886 we have the high timeframe 0.886 Fibonacci retracement. This is the deep retrace zone where momentum often shifts. Price tends to exhaust here because 0.886 represents the final Fibonacci rotation before structural invalidation. It is where the last sellers usually throw in everything they have.
At the same time, this level lines up with the 1.618 extension of the first structure after the 10 October crash. The initial high to low is marked with a yellow arrow in your chart.
This means one thing:
The downside auction has mathematically completed.
Both the retracement leg and the extension leg have landed in the same pocket.
This is real confluence.
The HTF AVWAP Confluence
Chart:
On 06 August 2024, LINK printed a new significant low.
This low kicked off a bullish wave with strong volume behind it.
That wave marked the beginning of a long uptrend, which means the AVWAP anchored to this low carries real weight.
Now here is the fascinating part:
The lower band of the anchored AVWAP aligns perfectly with:
The HTF 0.886 retracement
The 1.618 extension
The current price zone
The mathematical exhaustion pocket
This is not normal.
This is precision level confluence.
What this means
When AVWAP, Fibonacci, and wave extensions align, it signals that institutional cost basis, market memory, and auction math are all pointing to the same zone as fair value.
This is where smart money steps in.
Falling Wedge – The Technical Cherry
The final ingredient:
LINK has printed a clean, textbook falling wedge.
A falling wedge is a bullish reversal pattern where momentum compresses and the final sellers run out of strength. It represents exhaustion, not continuation.
Combine that with AVWAP, Fibonacci, and mathematical symmetry, and you have a powerful structural reversal setup.
Order Flow Confirmation
The order flow confirm the technical story:
Spot CVD has been trending down, but price is no longer following with the same intensity.
Stablecoin and coin margined CVDs are still pushing lower, but again, price is resisting the pressure.
Open Interest increased into the lows. New shorts opened into exhaustion.
Funding remains small and neutral.
Price is holding the key zone.
This is absorption. When shorts push and price refuses to break, the market is loading a spring.
Conclusion
The 12 to 13 dollar range is not random noise.
It is a high timeframe confluence zone made of:
The 0.886 Fibonacci retracement
The 1.618 extension completion
The lower AVWAP band from the August trend origin
A falling wedge structure
Order flow absorption
New shorts entering into weakness
LINK is setting up for a powerful sweep if this zone holds.
Targets.
$19.30
$20.50
$38.00 if we move higher.
Breaking out of the wedge pattern invalidates the idea.
--------
The chart is whispering again. Patience turns whispers into signals.
--------
If you like this kind of analysis, drop a like and leave a comment. Everything here is shared for free so more people can cut through the noise and finally see what is actually happening under the surface. No hopium. No fear. Just real data, real structure, and real order flow.
The goal is simple. To help traders stop guessing and start understanding what the market is actually saying.
Stay sharp.
Stay objective.
And remember… the chart whispers long before it speaks.
- ThetaNomad
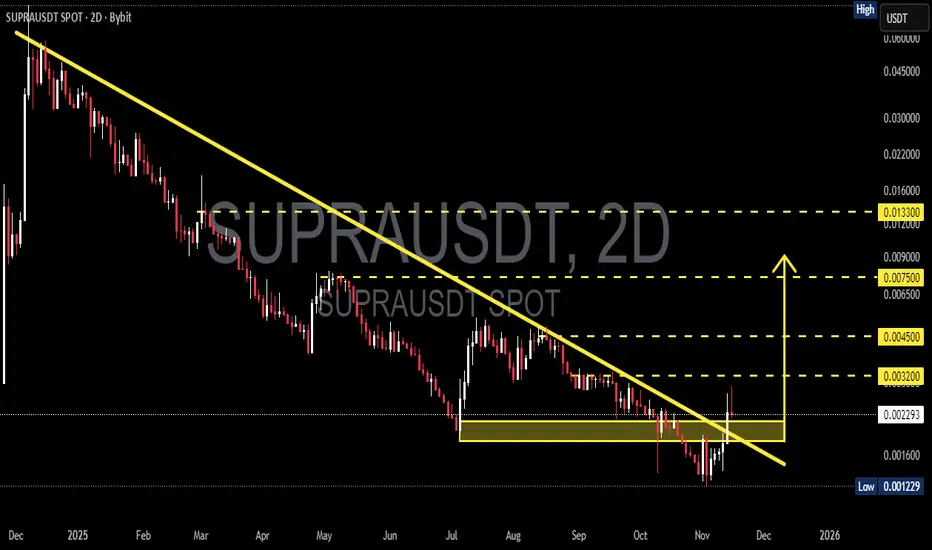
SUPRA/USDT — Trendline Breakout at Critical: Is Major Reversal?SUPRA has spent nearly a full year trapped under a relentless descending trendline—each rally attempt crushed, each bounce rejected. But for the first time since early 2025, the 2-day candle has broken above the dominant descending trendline, signaling a potential structural shift in market momentum.
This breakout occurred precisely after SUPRA revisited the major demand block at 0.00215–0.00180, a region that has repeatedly acted as the survival zone for this asset. The reaction from this area suggests renewed accumulation and a clear transfer of strength from sellers back to buyers.
SUPRA is now entering the most critical stage of its 2025 chart structure:
Is this a genuine trend reversal—or just another liquidity trap disguised as a breakout?
---
PATTERN STRUCTURE: “Descending Trendline Break + Demand Zone Rejection”
This combination is historically one of the strongest reversal structures, especially after prolonged downtrends.
1. Descending Trendline Breakout
The yellow trendline has suppressed price since early 2025.
The 2D breakout is a strong early reversal signal.
However, the wick on the breakout candle shows that sellers aren’t fully gone—momentum still needs confirmation.
2. Strong Demand Block (0.00215–0.00180)
This yellow box represents
high-volume reaccumulation,
liquidity sweeps,
structural support
that has repeatedly reset the market’s short-term direction.
3. Mid-Term Market Structure Shift (MSS)
A breakout + higher low formation near demand suggests the foundation of a larger bullish transition.
---
Bullish Scenario: “The Ingredients of a Full Trend Reversal”
SUPRA may be forming the early stages of a multi-week bullish reversal if the following conditions are respected:
1. Holding Above 0.00215
This is the line between “breakout confirmed” and “breakout failed.”
2. Successful Retest of Trendline or Demand Zone
A clean rejection wick from this zone would signal buyers stepping in aggressively.
3. Bullish Targets Based on Chart Structure
If the breakout is real, SUPRA has a clear ladder of upside targets:
Target Description
0.00320 First resistance / short-term reaction zone
0.00450 Major historical supply area
0.00750 Mid-range structural resistance
0.01330 Full trend reversal target
Bullish Narrative
A stable 2D close above 0.00230–0.00250 would mark the beginning of a mid-term trend reversal, opening the path toward multi-target rallies.
---
Bearish Scenario: “False Breakout Liquidity Trap”
Despite the breakout, danger remains:
1. Closing Below 0.00215
This would signal weakness and invalidate early bullish momentum.
2. Closing Below 0.00180 (Major Breakdown)
If the candle closes below the lower demand boundary, SUPRA risks sliding toward:
0.00123 (the next major low on the chart)
or even forming new lower lows
Bearish Narrative
If sellers reclaim the demand zone, the reversal collapses and the long-term downtrend resumes.
---
Summary
SUPRA is at one of its most defining technical moments of 2025.
The trendline breakout is only the first chapter of this story—the real decision will be made at the 0.00215–0.00200 retest.
If the zone holds, SUPRA isn’t just escaping a downtrend—it may be entering a full multi-week reversal phase aimed at 0.00320 → 0.00450 → 0.00750 and beyond.
But if it closes below 0.00180, the entire bullish structure erases and the downtrend resumes.
---
#SUPRA #SUPRAUSDT #CryptoAnalysis #Breakout #TrendlineBreak #Altcoin #MarketStructure #DemandZone #ReversalSetup
LINK LONG — FROM MATH TO MARKET STRUCTURE: An Extensive AnalysisTraders,
In my latest BINANCE:LINKUSDT analysis I started my thesis with " I BELIEVE THE CRYPTO MARKET IS SETTING UP FOR A BIG, BIG, BIG DUMP! NOT JUST LINK! "
It wasn’t coincidence that I wrote those words in caps lock. The market was whispering louder than usual: not in price, but in data. Every metric pulsed in rhythm, like the heartbeat of a system about to release its tension. The numbers weren’t random; they were poetry in motion, quietly syncing toward one inevitable point. Sometimes, data doesn’t just inform — it sings. And when it does, your fingertips start typing before your mind even realizes what the melody means.
Now we’re back — same chart, same logic, but a different side of the market.
I’m going to analyze it the same way I did before — step by step, math-backed, structure-based, and logic-driven.
Only this time, it’s even more extensive.
For free. For nothing. So that you, the people who actually care to learn, can start to see how markets truly work. How they breathe, trap, rotate, rebalance — and how every candle hides intent.
I believe the BINANCE:LINKUSDT dump might be over — for now, at least — and that the market is slowly starting to build upward momentum. This post is not a quick “looks bullish” statement. It’s a structured walkthrough from mathematical foundation to market structure, liquidity, and order flow, showing why the $20–$21 region might become the next key target before a rotation lower.
Let’s go step by step.
Step 1 – Is There a Mathematical Reason to Say the Current Auction Might Be Finished?
By “auction,” I mean the move from a clear swing high to a clear swing low where sellers were in control. Markets move in auctions — from high to low, then pull back, then extend again. To determine whether a sell auction is finished, we measure how far it has retraced and extended.
After the 10 Oct liquidation event, price printed a clean new high — more valid than the liquidation spike. That’s point A (~20.15). From there, it sold off to point B (~15.70).
So our first auction is:
A → B | Direction: Down
Step 2 – Measuring the Retrace
Since the move was downward, I drew a Fibonacci retracement from A to B (high → low). nThat gives us retracement levels above price on TradingView.
Price retraced almost perfectly to the 0.786 level (~19.23) — not shallow (0.382 or 0.5), not extreme (0.886), but deep enough to classify as a “normal” yet decisive retrace.
That means sellers regained control after a 0.786 pullback, a key ratio in the Fibonacci family.
Step 3 – What Does a 0.786 Retrace Usually Lead To?
Here’s where the Fibonacci logic becomes meaningful. The 0.786 level is derived from the square root of the golden ratio inverse: √(1/φ). Its natural mirror on the other side of price is √(φ), or 1.272.
That’s why 0.786 retraces often project toward 1.272 extensions — the two are mathematically linked. Beyond that, the next probable extensions are 1.414 and 1.618.
So, for a 0.786 retrace, the Fibonacci extension ladder is:
Primary: 1.272
Intermediate: 1.414
Extended: 1.618
Step 4 – Did BINANCE:LINKUSDT Reach One of These Fibonacci Targets?
To check that, we reverse the Fibonacci — draw it from B to A (low → high). That prints the extension levels below the swing low.
Price hit the 1.414 extension almost perfectly before structure began shifting:
Lower lows stopped forming
Higher lows began to appear
Small higher highs emerged on lower timeframes
That’s a structural sign the sellers exhausted their leg — a textbook confirmation that the 1.414 zone completed the auction.
Step 5 – Confirming the Auction
The A → B auction retraced to 0.786, extended to 1.414, and then reversed in structure. This matches the Fibonacci expectation for a completed wave.
If the retrace had been 0.886 instead, we’d likely expect continuation to 1.618 — but since it was 0.786, the 1.414 tap followed by reversal fits perfectly.
✅ 0.786 retrace → 1.272 / 1.414 / 1.618 extension
✅ 1.414 tapped → structure reversed
We can reasonably call this auction finished.
Step 6 – Confluence from the Smaller ABC Swing
After the main leg, the market made a small rally and a lower high — point C. Using the Fibonacci Extension tool (A → B → C), we project this smaller swing.
Interestingly, the ABC projection lands exactly on the same 1.414 zone as the larger A → B measurement. That’s two independent Fibonacci constructions converging on the same price.
From a math perspective, this isn’t coincidence — both patterns use the same ratio family.
It’s proportion — the geometry folding back onto itself.
Nature’s Geometry on a Price Chart
This is where Fibonacci goes beyond numbers. The same proportions that define growth patterns in seashells, tree branches, sunflowers, hurricanes, and galaxies are present in the market’s structure.
Two distinct swings produce the same 1.414 target.That’s natural proportion — mathematical harmony showing up in price behaviour.
It’s not random. It’s geometry repeating itself.
Part 2 – The Structural Context: Liquidity and Value
We’ve identified our Potential Reversal Zone (PRZ) using Fibonacci confluence. Now let’s look inside the structure and the market’s underlying “memory.”
We’ll answer three questions:
Where does liquidity sit — which levels might the market hunt next?
What is the order flow showing — is there absorption or continuation?
What do the next extensions project mathematically?
1. Liquidity via TPO (Market Profile)
TPO (Time Price Opportunity) shows how much time price spent at each level. Clusters = acceptance and value. Gaps = imbalance and rejection.
Around $19.00, during TPO periods G, H, N, and O, price built acceptance but didn’t explore higher. That created a weak high — a level that often acts as a magnet for future liquidity hunts.
Another, slightly weaker high sits near $20.00, which is still unfinished.
And as James Bond said, “I never leave loose ends.” Neither does the market.
2. Anchored VWAP Confluence
Anchoring VWAP from the major swing high shows the blue AVWAP aligning almost perfectly with that $20.00 region. That gives strong confluence between volume-weighted value, liquidity, and structure.
3. Low Volume Nodes (LVNs) and Imbalance
Using the Fixed Range Volume Profile (FRVP) from A → B reveals clear low-volume zones — “air pockets” where price moved too fast to build volume.
Between $20.00 and $20.50, there’s a notable LVN, meaning price skipped over it during the selloff.Such zones often act as magnets — the market tends to revisit them to rebalance unfinished business.
Now we have three layers of confluence:
Weak high at $19.00–$20.00
Anchored VWAP aligning with $20.00
LVN pocket at $20.00–$20.50
That defines a clear liquidity and target zone.
Structure and Confluence Summary
PRZ established through Fibonacci symmetry
Structure showing higher lows and early accumulation
Confluence cluster between $20.00 and $20.50, combining:
Weak highs
Low-volume node
Anchored VWAP
Market Profile imbalance
The setup aligns across math, volume, and structure.
Part 4 – Order Flow: What Lies Beneath the Candles
From the outside, price action looks calm — clean candles, defined Fibonacci levels, and structure that seems perfectly balanced. But the real story is hidden underneath, inside the Order Flow.
Every candle represents a battle — between aggression and absorption, buyers and sellers, liquidity and imbalance. Understanding who is winning that battle tells us whether a move is genuine strength or a trap waiting to unwind.
Order Flow allows us to look beneath the surface and see where transactions are actually happening — where volume clusters, where buyers are absorbed, and where sellers are defending. It’s the market’s heartbeat.
The Current Picture
Here’s what we see right now on BINANCE:LINKUSDT :
CVD (Cumulative Volume Delta) — across both spot and futures (stablecoin- and coin-margined contracts) — is making lower highs, showing persistent sell aggression.
Yet price itself is not breaking down. Instead, it’s holding steady and even forming higher lows.
Meanwhile, the A/D (Accumulation/Distribution) line is rising, indicating that despite heavy selling pressure, buyers continue to absorb and accumulate.
That means one thing:
aggressive sellers are being absorbed by large passive buyers quietly taking the other side.
Recognizing the Setup
Let’s break down the pattern:
CVD ↓ → sustained sell aggression
OI ↑ → new short positions entering the market
Price ↔ or ↑ slightly → absorption and accumulation taking place
When these three align:
It often signals a short trap forming.
Sellers feel in control because CVD shows selling dominance.
In reality, their aggression is being absorbed by larger passive buyers.
Once that liquidity runs out and buyers stop absorbing, shorts are trapped.
Those trapped shorts must cover — triggering a fast, aggressive short squeeze upward.
Also: CVD on Stablecoin Margined Contracts remains flat while Stablecoin Margined Open Interest rises — showing aggressive shorting being absorbed by larger buyers. Price stability suggests accumulation, not weakness. Since OI stays high, those shorts are still in the game, meaning their positions haven’t been closed yet. If price starts to move up, they’ll be forced to cover — setting up the conditions for a short squeeze.
Absorption in Context
Absorption isn’t random — it’s the footprint of strong hands quietly taking in sell pressure without letting price break down. While most see weakness, they’re actually witnessing controlled accumulation.
Here, price holds steady as CVD trends flat and OI stays high — meaning aggressive shorts are still in the game, being absorbed by larger buyers. Every new short adds fuel to the spring.
When that pressure releases, it doesn’t drift — it snaps. Shorts are forced to cover, triggering a sharp, emotional squeeze toward the next liquidity zone around $20–$20.50, where Fibonacci confluence and a weak high align.
This is where microstructure meets the macro picture — absorption building the base for a violent move higher.
Part 5 – Fibonacci Extension Confirmation
To justify the $20–$21 target mathematically, we apply one more Fibonacci extension —
from the last swing low to the recent high, projected forward.
The 1.618 extension aligns almost perfectly around $20.00, adding strong mathematical confluence to our previously defined liquidity and structure zone.
That makes $20.00–$20.50 a textbook target cluster — a Fibonacci, liquidity, and volume alignment.
Final Outlook – The Path Ahead
Based on all the combined data:
Fibonacci structure shows completion and new expansion potential
Market Profile and VWAP reveal unfinished business around $20–$20.50
Order Flow confirms absorption and hidden accumulation
The 1.618 Fibonacci projection reinforces this level as a natural mathematical destination
I believe the market will squeeze upward toward $20–$21, taking out the weak high and the LVN pocket — and once that liquidity is collected, rotate back down to restore balance.
The setup is mathematically justified, structurally valid, and order-flow supported — a complete picture of how Fibonacci geometry, structure, and liquidity align to reveal where the next phase of this auction may unfold.
If price slips lower instead, the key level to watch is $12.90 — the latest 1.618 extension from the initial wave we measured earlier. That remains the deep liquidity and structural boundary where balance could be restored.
Last words.
Everything we have mapped — Fibonacci structure, confluence, liquidity, and absorption — means nothing without the psychology behind it. The market is not just math and candles; it is a mirror of collective emotion. Every trapped short, every breakout chase, every hesitation is human behaviour written in numbers.
When confidence is at its peak, risk is usually greatest.
When fear dominates, opportunity hides in plain sight.
That is why sentiment often reaches its extreme just before reversals. Most traders only see what is already visible, not what is quietly building beneath the surface.
So next time you scroll through social media or read the news about what everyone expects, remind yourself of this:
When everyone sees the same breakout, the trade was over hours ago.
And the markets whisper long before they speak.
From the depths of the sands,
ThetaNomad
------------------------------------
If you enjoy this kind of analysis, leave a like and drop a comment. I don’t ask for anything — I just want to help more people learn to look behind the charts, to see the story that price and volume quietly write together.

Chainlink (LINK) – SmartCon 2025 + Key Support TestLINK is in focus as SmartCon 2025 kicks off today, drawing attention to the broader Chainlink ecosystem. Historically, this event has sparked major announcements and partnerships, often impacting LINK price action. Traders are now watching for potential bullish catalysts during the event.
Technically, LINK is breaking down into a key support zone between $14.50 and $15.00. This zone has held in the past and could act as a launchpad for a reversal bounce, especially if event-driven sentiment kicks in. Failure to hold this zone opens the door to deeper retracements.
🛠️ Trade Setup (Idea Only):
Entry Zone: $14.50–$15.00
Take Profits: $20 / $22 / $25
Stop Loss: $13
Bias: Short-term bullish if support holds

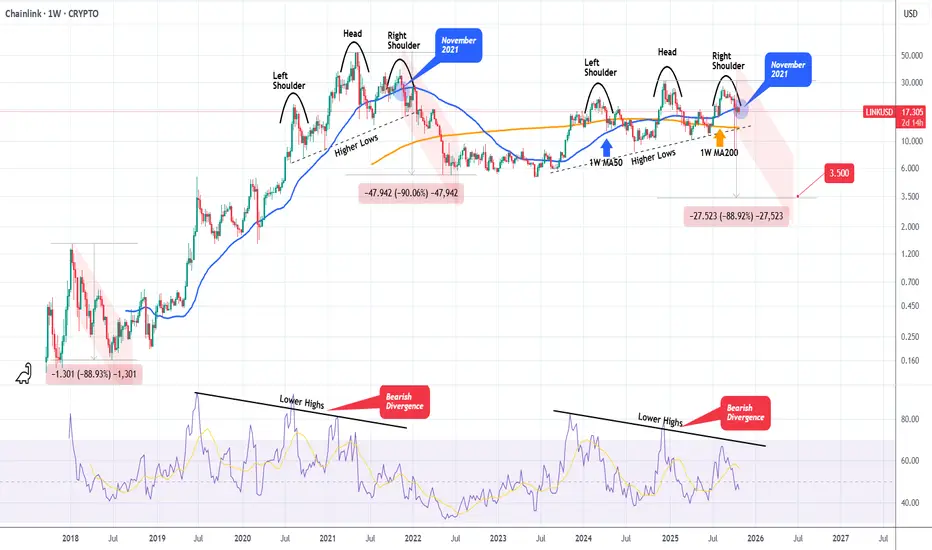
LINKUSD Massive Head and Shoulders starting the new Bear Cycle. Chainlink (LINKUSD) has been steadily rising within a Channel Up during this Bull Cycle but on the recent August 18 2025 High, it failed to make a Higher High and got rejected instead.
The Channel Up seems to have transitioned into a Head and Shoulders (H&S) pattern, while the 1W RSI has been on a Bearish Divergence (Lower Highs trend-line against the price's Higher Highs).
We saw a similar H&S forming at the end of the previous Bull Cycle (2021), which essentially paved the way to the 2022 Bear Cycle. Symmetrically it appears to also work quite well as right now we are on a similar spot (1W MA50, blue trend-line) as November 2021.
The two Bear Cycles of LINK declined by -88.90% and -90.00% respectively. As a result, if history repeats, we are looking at a potential bottom at at least $3.500 (-88.90%).
Do you think that's a realistic expectation?
-------------------------------------------------------------------------------
** Please LIKE 👍, FOLLOW ✅, SHARE 🙌 and COMMENT ✍ if you enjoy this idea! Also share your ideas and charts in the comments section below! This is best way to keep it relevant, support us, keep the content here free and allow the idea to reach as many people as possible. **
-------------------------------------------------------------------------------
💸💸💸💸💸💸
👇 👇 👇 👇 👇 👇
LINK: Shows Upward Momentum LINK has recently shown modest upward momentum. Under our primary scenario, we anticipate that turquoise wave 1 will push price above the resistance level at $30.95, followed by a corrective wave 2. However, if price continues to decline and falls below support at $8.25, we will expect a new wave alt.(B) low in magenta to form within our similarly colored alternative Target Zone ranging from $7.04 to $2.12 (probability: 37%).

Be careful with LINK !!!Unfortunately, the price has broken below the 200 moving average, which could act as a significant resistance and potentially push the price lower. In my view, the price may drop toward the PRZ (Potential Reversal Zone), and from there, it could resume its upward movement.
