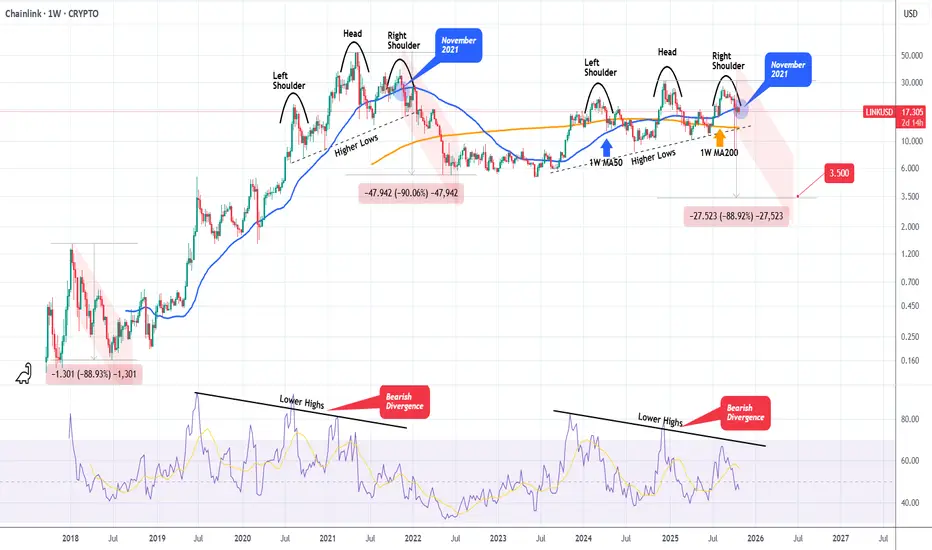
LINKUSD Massive Head and Shoulders starting the new Bear Cycle. Chainlink (LINKUSD) has been steadily rising within a Channel Up during this Bull Cycle but on the recent August 18 2025 High, it failed to make a Higher High and got rejected instead.
The Channel Up seems to have transitioned into a Head and Shoulders (H&S) pattern, while the 1W RSI has been on a Bearish Divergence (Lower Highs trend-line against the price's Higher Highs).
We saw a similar H&S forming at the end of the previous Bull Cycle (2021), which essentially paved the way to the 2022 Bear Cycle. Symmetrically it appears to also work quite well as right now we are on a similar spot (1W MA50, blue trend-line) as November 2021.
The two Bear Cycles of LINK declined by -88.90% and -90.00% respectively. As a result, if history repeats, we are looking at a potential bottom at at least $3.500 (-88.90%).
Do you think that's a realistic expectation?
-------------------------------------------------------------------------------
** Please LIKE 👍, FOLLOW ✅, SHARE 🙌 and COMMENT ✍ if you enjoy this idea! Also share your ideas and charts in the comments section below! This is best way to keep it relevant, support us, keep the content here free and allow the idea to reach as many people as possible. **
-------------------------------------------------------------------------------
💸💸💸💸💸💸
👇 👇 👇 👇 👇 👇
Chainlink
LINK: Shows Upward Momentum LINK has recently shown modest upward momentum. Under our primary scenario, we anticipate that turquoise wave 1 will push price above the resistance level at $30.95, followed by a corrective wave 2. However, if price continues to decline and falls below support at $8.25, we will expect a new wave alt.(B) low in magenta to form within our similarly colored alternative Target Zone ranging from $7.04 to $2.12 (probability: 37%).

Be careful with LINK !!!Unfortunately, the price has broken below the 200 moving average, which could act as a significant resistance and potentially push the price lower. In my view, the price may drop toward the PRZ (Potential Reversal Zone), and from there, it could resume its upward movement.

LINK Spot LONG LINK Spot LONG📈
Due to the formation of a zigzag structure, I am more inclined to form a triangle and further exit from it upwards. I no longer consider it as an impulse.
Expectations have not changed, I plan to start recording after updating the global maximum of 53.00. Only the time of the scenario implementation has changed, which may take a long time.
All altcoins with potential show approximately the same picture, which is encouraging. This structure provides the most accurate goals for profit-taking and scenario cancellation.
LINK Analysis - October 18Price: $16.61
Up 0.81% (24h) after testing $16.96 resistance.
Technical Analysis:
Supports: $16.00, $15.50
Resistance: $17.00, $18.00
RSI: 46.75 (daily, neutral)
MACD: -0.19 (daily, sell)
EMAs: Below 50-day ($17.00), above 200-day ($15.00)
Bollinger: Near mid-band ($16.50)
LINK/BTC Chart Analysis:
Ratio: 0.000248
Supports: 0.000240, 0.000230
Resistance: 0.000260, 0.000270
RSI: 50 (daily, neutral)
MACD: Neutral, slight bearish divergence
Patterns: Symmetrical triangle forming (October 1–18)
Head and Shoulders potential (daily, bearish)
Bullish Engulfing: October 15
Plot on TradingView for visualization.
On-Chain Analysis:
MVRV: Neutral, fair valuation
Exchange Reserves: Stable, moderate selling
Whale Activity: 4,624 large transactions, 73% surge in accumulation
Coin Days Destroyed: Moderate, profit-taking
Glassnode Funding Rate: Neutral on CEXs (SorooshX/OKX perpetual futures ~0.01%, balanced leverage)
Fundamental News:
Macro: Fed rate cuts Q4 2025, easing inflation
Regulatory: S&P Global partners with Chainlink for on-chain stablecoin assessments
Institutional: Franklin Templeton, DTCC, Euroclear adopt Chainlink for tokenized assets
Social Sentiment:
450K+ #LINK mentions on X
60% bullish (S&P partnership, whale accumulation, $55 target predictions)
Trend & Chart Patterns:
Symmetrical Triangle: Forming (October 1–18)
Head and Shoulders: Potential bearish reversal on daily
Bullish Engulfing: October 15
Trend: Neutral short-term, breakout risk both ways
Long-term: $20–$55 (2026)
Buy/Sell Signal: Hold (55% confidence)
Rationale: Neutral RSI/MACD and funding rates suggest consolidation; whale accumulation and partnerships support upside, but Head and Shoulders risks pullback.
Hold or buy on dips: $16.00 or $15.50
Stop-loss: <$15.50
Target: $18.00 short-term, $55 (Q4 2026)
Disclaimer: Research before investing. #LINK

TradeCityPro | LINKUSDT Early Entry Trigger!👋 Welcome to TradeCityPro Channel!
After the recent sharp drop in the overall crypto market, which was mainly triggered by negative news from China and the United States, Chainlink (LINK) also faced a noticeable correction —just like most major altcoins.
At the moment, LINK is trading below a strong daily resistance zone, which has previously acted as a key turning point for price action. The market seems to have already completed a pullback to this resistance, showing that sellers are still active in this region. This is a critical area — the next move from here could define whether LINK continues downward or begins a new bullish leg.
If the market manages to break above this resistance with strong momentum and confirmed volume, we can start looking for long opportunities on lower timeframes (like 4H or 1H). However, it’s safer to wait for confirmation of structure change, such as the formation of higher highs and higher lows, before entering.
For a short position, there are two clear scenarios:
If the price gets rejected from the 20.12 level, it can trigger a short setup early, especially if accompanied by bearish candlestick patterns like a shooting star or bearish engulfing.
A confirmed break below 17.07 would act as a stronger confirmation for continued downside momentum — showing that buyers are losing control and the bearish pressure remains dominant.
On the other hand, if the price breaks above 20.12, we’ll likely see a move toward the descending trendline that has been guiding LINK’s movement for several weeks. This zone could become another major decision point:
A rejection from the trendline might start another wave of correction,
But if LINK breaks above it and sustains momentum, it would signal the start of a potential bullish reversal, possibly leading to a trend continuation toward higher resistances.
🔹 Bullish confirmation: Break and retest above 20.12 with structure change on lower TFs.
🔹 Bearish confirmation: Breakdown below 17.07, or rejection from 20.12 with volume.
🔹 Neutral zone: Between 17.07 – 20.12, where price might consolidate before its next move.
Overall, LINK is currently in a decision-making phase, and traders should stay patient, waiting for clear breakout or rejection signals before entering any position.
📝 Final Thoughts
Stay calm, trade wisely, and let's capture the market's best opportunities!
This analysis reflects our opinions and is not financial advice.
Share your thoughts in the comments, and don’t forget to share this analysis with your friends! ❤️

LINK – Back Inside the Bullish FlagOn Friday night, Chainlink lost its confluence support from the 18.50 zone and dropped sharply to just under $10.
However, looking at the chart, we can clearly see the importance of this area, marked by both the 2022–2023 accumulation resistance and the 2024 lows.
From there, the coin rebounded fast, managing to reclaim the 18.50 support and re-enter the bullish flag that started forming at the end of August.
This recovery shows strong buying interest — but no clear buy signal has yet appeared.
For now, LINK remains a coin to watch closely.
A confirmed breakout above 21.50 would open the door for a new bullish leg, with 30 USD as the next technical target.

TradeCityPro | LINK: Eyeing $18 for Potential Drop👋 Welcome to TradeCity Pro!
In this analysis, I’m going to review the LINK coin — one of the RWA projects, currently ranked 12th on CoinMarketCap with a market capitalization of $12.57 billion.
⏳ 1-Hour Timeframe
In the 1-hour timeframe, after Friday’s drop, the price fell to $16.78.
💫 Following this decline, the price made an upward correction up to the 0.618 Fibonacci level. After one reaction to this zone, bearish momentum returned to the market, and volume has been increasing.
✅ Currently, the price is moving toward the $18.31 level. Breaking this zone could trigger the start of the next downward leg.
⭐ The main support level remains at $16.78, and as long as the price stays above this zone, I won’t be opening any short positions.
📊 For long positions, the current trigger is $20.02.For earlier triggers, we need to wait for the market to form more structure and generate new entry signals.
📝 Final Thoughts
Stay calm, trade wisely, and let's capture the market's best opportunities!
This analysis reflects our opinions and is not financial advice.
Share your thoughts in the comments, and don’t forget to share this analysis with your friends! ❤️

$LINK – PREPARING FOR A BIG DUMP – SQUEEZE TRAIN LOADING Traders,
I BELIEVE THE CRYPTO MARKET IS SETTING UP FOR A BIG, BIG, BIG DUMP!, NOT JUST LINK!
Last time, we nailed the BIST:LINK short from $24.55 — it hit Target 1 and Target 2 (the two boxes below) pixel perfect.
From $20.00 we expected a retrace back up toward the $23.00 region, before a potential dump to $17.00.
That scenario may now be unfolding.
Let’s break it down:
CVD & Market Participation – Bearish Divergence Building
Aggregated CVD Spot → still relatively flat → tells us there’s no real spot demand or accumulation. Spot buyers are not fueling this push.
Aggregated CVD Futures (Stablecoin-margined) → moving aggressively higher → lots of leveraged traders chasing the move up.
Aggregated CVD Futures (Coin-margined) → also moving aggressively higher → even riskier longs, since collateral is crypto itself (double downside risk if LINK sells off).
👉 Why this is a bearish divergence:
Price is being pushed higher only by aggressive leveraged longs, while spot (the foundation of demand) is not confirming. This creates a fragile rally that can easily unwind into a long squeeze.
Order Flow – Signs of Absorption
On Binance & Bybit perps, we see aggressive buyers stepping in (CVD making higher highs).
But price is not moving higher accordingly.
This is a classic absorption signal: passive limit sellers are absorbing the buying pressure, preparing for reversal.
Market Context – Entering the PRZ ($23–24)
HTF VAL (Value Area Low) at this region.
LTF VAL aligns perfectly here too.
Single Prints (TPO profile) → thinly traded zones where price moved quickly in the past, often acting as magnets and reversal points.
Imbalances stacking at these levels, showing inefficiency that can flip.
AVWAP Confluence → multiple anchored VWAPs cluster in this zone, creating strong resistance.
All of this builds a confluence-heavy Potential Reversal Zone (PRZ) at $23–24.
My Take
We are entering a Reversal Zone packed with:
No real spot demand,
Leveraged longs chasing,
Absorption in order flow,
Strong technical confluence (VALs, TPO singles, Imbalances, AVWAP).
⚠️ This is the perfect fuel for a long squeeze dump back toward $17.00.
Trade safe, manage risk. Adios 🚀🔪

LINK/USDT: Bullish Surge to 26?BINANCE:LINKUSDT is gearing up for a bullish move on the 4-hour chart , with an entry zone between 22-22.25 near a key support and trendline. 🎯
The target range of 25.5-26 aligns with the next resistance, signaling strong upside potential. Set a stop loss on a close below 20.90 to manage risk effectively. 🌟
Watch BTC trends! 💡
📝 Trade Plan:
✅ Entry Zone: 22.00 – 22.25 (support + trendline area)
❌ Stop Loss: Daily close below 20.90
🎯 Targets: 25.5 - 26
Ready for this lift-off? Drop your take below! 👇

LINKUSD - Breaking Out of Symmetrical TriangleA symmetrical Triangle on LINKUSD
These are considered a bullish pattern on this weekly timeframe
Looking for a breakout

LINK Daily: Short-Term Rejection, Long-Term StrengthLINK Daily – Watching the Retrace
LINK on the daily just got rejected from the 50MA, confirming it as short-term resistance.
The next key support sits around the 0.618 Fibonacci level, which also marks the origin of the last bounce that was rejected at the 50MA.
From a system perspective, the current structure reads:
Price < BB Center (orange) < SMA < MLR10 — indicating a short-term downtrend.
However, on the long-term view, price remains above the 200MA, meaning the broader uptrend is still intact.
At this stage, LINK needs a daily close above the BB Center to regain short-term momentum and open the path for recovery.
With Q4 underway and the narrative in the US shifting in favor of crypto, LINK could soon find conditions for continuation once the local structure stabilizes.
Bias:
Neutral-bullish: short-term pressure within a long-term bullish structure.
Always take profits and manage risk.
Interaction is welcome.

LINK 1H – Sitting on a Cluster of SupportLINK 1H – Sitting on a Cluster of Support
LINK on the 1H looks quite similar to ETH, but with one key difference: the 200MA is much closer.
Price is now testing a tight cluster of support, where multiple technical factors align. If this area holds, LINK could rebound with strength.
However, if it breaks down, the 0.618 Fib sits below as the next potential shelter for price.
The next few candles will likely decide if bulls can defend this zone or if another leg lower is needed.
Key notes:
200MA nearby, acting as dynamic support
Local cluster of support being tested
0.618 Fib as next confluence level
Short-term structure mirrors ETH
Bias:
Neutral-bullish — holding this zone keeps the uptrend intact, but losing it could invite deeper retracement.
Always take profits and manage risk.
Interaction is welcome.

LINK — Bullish Structure, Corrective Dip into Demand!LINK remains overall bullish on the higher timeframe. Price is pulling back inside a descending channel (correction) after August’s impulse and is approaching a daily demand zone around $17–$18.5.
Scenarios:
Bullish 📈 Hold $17–$18.5 and/or break & close above $22.5–$23.5 → momentum toward $26, then $30+ if trend accelerates.
Bearish 📉 Daily close below $17 would weaken the structure and risk a deeper retrace before bulls try again.
Plan:
Look for confirmation at demand (higher low / bullish candle) or trade the break–retest above the channel for momentum entry.
⚠️ Disclaimer: This is not financial advice. Always do your own research and manage risk properly.
📚 Stick to your trading plan regarding entries, risk, and management.
Good luck! 🍀
All Strategies Are Good; If Managed Properly!
~Richard Nasr
TradeCityPro | LINK Coin Testing Key Resistance👋 Welcome to TradeCity Pro!
In this analysis, I'll be reviewing the LINK coin. It’s one of the popular RWA crypto projects with a market cap of 14.56 billion dollars, ranked 13th on CoinMarketCap.
⏳ 1-Hour Timeframe
In the 1-hour timeframe, after a downward movement, this coin has formed a large range box with the upper boundary at $22 and the lower boundary at $20.02.
📊 Currently, after getting support at the lower boundary of the box, the price has moved upwards in two legs toward the $22 level and has now reached it.
🧩 The price has reacted to this level before, and it has significant strength. It can be viewed as a Maker Seller zone.
✨ We can confirm the bullish trend of LINK after breaking this level. Before breaking this level, opening a position is risky, and if we want to open a position, we need to pay close attention to risk and capital management.
✅ In the upward movement towards the top of the box, a divergence has formed in the RSI. We can confirm this divergence activation by breaking the 40.91 level in the RSI. For the price itself, we can confirm a bearish trend by stabilizing below 21.25.
📉 For a short scalp position, we can enter with the break of 21.25. But be cautious, as this position is very risky, and if you open it, make sure to take profit with low-risk-to-reward ratios because the market momentum is not fully in our favor, and the chance of volatile fluctuations is high.
🔔 For a long position, the best trigger is the breakout of the top of the box. If the price touches this level multiple times, we can find an accurate trigger for the breakout, and in subsequent touches, we can enter with the breakout.
📝 Final Thoughts
Stay calm, trade wisely, and let's capture the market's best opportunities!
This analysis reflects our opinions and is not financial advice.
Share your thoughts in the comments, and don’t forget to share this analysis with your friends! ❤️

LINK — Massive $20 Support Zone, Wave 5 Loading?I haven’t seen this much confluence stack in one place for LINK in a long time. The $20–$19 zone is absolutely packed with technical factors, making it a critical level to hold for bullish continuation.
🧩 Confluence at $20–$19
Golden Pocket: $20.19 (0.618) → $19.59 (0.666)
Yearly VWAP: $18.87
21 Weekly EMA/SMA: $19.68 / $18.39
Yearly Open: $20.02
0.666 Fib Speed Fan: aligned with $20 zone
1.0 Trend-Based Fib Extension: at $20 → completion of wave 4
Pitchfork Buy Zone: 0.702–0.75 levels right at $20
Midpoint of 1-Year Trading Range
Anchored VWAP (from $30.94 high, 287 days): $19.55
Daily Level: $19.66
Weekly Level: $19.28
Monthly Level: $19.27
Yearly Level: $19.51
🟢 Long Setup
We’ve already seen a bounce from $20, confirming demand at this zone.
Plan: Buy now and add on retracements if price dips back toward $20/$19.
Stop-Loss: Below 21 SMA weekly at $18.39
TP1 → $30 psychological resistance & prior key high
TP2 → $34.57 (0.618 Fib retracement)
This setup offers an R:R of 1:7+ with a possible yield of +70% if played toward TP2.
Structure Outlook
With this stacked confluence, it looks like wave 4 has completed and LINK could be ready for its next leg up. The $20 zone is make-or-break, and as long as it holds, the case for bullish continuation remains strong.
Indicators used
DriftLine — Pivot Open Zones → For identifying key yearly/monthly/weekly/daily opens that act as major S/R reference points
Multi Timeframe 8x MA Support Resistance Zones → to identify support and resistance zones such as the Weekly 21 EMA/SMA.
➡️ Available for free. You can find it on my profile under “Scripts” and apply it directly to your charts for extra confluence when planning your trades.
_________________________________
💬 If you found this helpful, drop a like and comment!

$LINK – PREMIUM PUMP, DISCOUNT DUMP? THE SQUEEZE SETUP EXPLAINEDLINK – PREMIUM PUMP, DISCOUNT DUMP? THE SQUEEZE SETUP EXPLAINED
Traders,
LINK — and likely the broader crypto market — is setting up for a premium squeeze that turns into a discount dump.
ANALYSIS
On Binance Perpetuals you can see longs piling in near $24 while price stalls → CVD pushes up, price doesn’t. That’s buying with no progress = bearish absorption with CVD non-confirmation. Check the data here ibb.co
Aggregated Spot CVD (all exchanges) is flat. No real spot demand → only leveraged longs propping up price. Check the data here ibb.co
Price is now inside the Golden Pocket retracement zone. High-probability reaction area where strong hands fade late longers.
Measuring swing low → swing high (06 Sep – 13 Sep), price is right at the Value Area High (VAH). This is the edge of acceptance.
Confluence: we’re also tagging the upper Anchored VWAP band (green line) from both the swing high and the swing low.
→ Why this matters: Anchored VWAP tracks the average cost basis of participants from a chosen pivot. When the swing low → high AVWAP band and the swing high → low AVWAP band overlap in the same zone, it creates double confluence: longs from the bottom see this as “expensive” and reduce risk, while shorts from the top defend their break-even. Historically, these overlaps act as strong rejection zones unless fresh spot demand breaks through.
MY TAKE
Expecting rejection at $24 and a move back toward $21 (blue AVWAP test). I think - based on data - that we might move even lower.
Setup = trapped longs at premium + no spot demand + strong confluence of VAH, Golden Pocket, and dual AVWAP resistance.
Invalidation = acceptance above $25 with spot CVD joining the move.

LINK LONG AND SHORT IDEAHi guys . i have this setup for BINANCE:LINKUSDT a double position . a long to upper FVG then short from there . in both case my SL above and blow major pivots.

LINK - Swing Long OpportunityLINK - Swing Long Opportunity
📊 Market Sentiment
Market sentiment remains strongly bullish as the FED is expected to deliver a 0.25% rate cut, with speculation building for a possible 0.5% cut in September. Monetary policy shifts are being driven by both inflation trends and weakening labor market data. The latest August and September job reports were soft, signaling that the economy is cooling rapidly. This environment continues to fuel expectations for a major bullish run in the weeks ahead.
📈 Technical Analysis
Price is bullish on the HTF, so I will only be interested in long setups.
Price recently broke and closed above the bearish trendline, confirming bullish continuation.
We also saw a break and close above the HTF Key Level, which should now act as support.
Moreover, the 0.5 Fibonacci retracement level aligns perfectly with the HTF Key Level, creating strong confluence for a potential entry.
📌 Game Plan
I will be entering long positions at the 0.5 Fibonacci retracement / HTF Key Level intersection.
🎯 Setup Trigger
Confirmed 15M break of structure before entry.
📋 Trade Management
Stoploss: Daily close below the HTF Key Level or hard stop at $22.64
Targets:
• TP1: $26.03
• TP2: $26.63
• TP3: $27.85
💬 Like, follow, and comment if you find this setup valuable!
⚠️ Disclaimer: This content is for informational and educational purposes only and does not constitute financial, investment, or trading advice. Always do your own research before making any financial decisions.

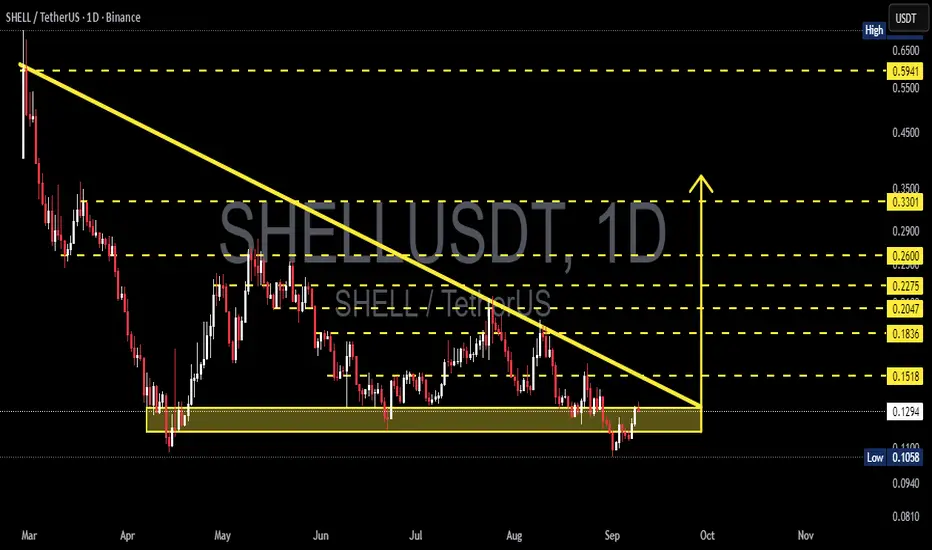
SHELL/USDT — Decision Point at the Edge of Descending TriangleCurrently, SHELL/USDT (1D) is at a critical stage after a prolonged downtrend since March. The chart clearly shows a Descending Triangle pattern, with strong support around 0.1058 – 0.1350.
Each time price dips into this zone, buyers step in for a rebound — yet sellers consistently push lower highs, forming a descending trendline. This signals the market is in a consolidation phase before a major decision: either a breakout to the upside or a breakdown to the downside.
---
🔎 Pattern and Chart Structure
Main pattern: Descending Triangle (default bias = bearish).
Strong support: 0.1058 – 0.1350 (demand zone, tested multiple times).
Dynamic resistance: Descending trendline (~0.1518 now).
Key levels to watch:
Resistance: 0.1836 → 0.2047 → 0.2275 → 0.2600 → 0.3301 → 0.5941.
Support: 0.0940 → 0.0810 (if breakdown).
---
🚀 Bullish Scenario
Bullish momentum may emerge if there’s a daily close above 0.1518 with strong volume, signaling buyers breaking through the descending pressure.
Initial target: 0.1836.
Mid targets: 0.2047 – 0.2275.
Extended targets: 0.2600 → 0.3301 → potentially 0.5941 if momentum accelerates.
Strategy: Enter after breakout confirmation, stop loss below 0.1300 or below 0.1058 for full invalidation.
---
🐻 Bearish Scenario
If price fails at the trendline and instead breaks down below 0.1058 on a daily close, the descending triangle plays out as a bearish continuation.
First target: 0.0940.
Next target: 0.0810.
Strategy: Enter short/re-entry on breakdown, with stop loss above 0.1200–0.1300.
---
📌 Conclusion: “Decision Zone”
SHELL/USDT is at a critical decision zone. Buyers are defending support, while sellers continue pressing down with lower highs.
Breakout above trendline → potential trend reversal.
Breakdown below support → bearish continuation.
Traders should avoid FOMO and wait for clear confirmation (breakout or breakdown). Risk management is essential: use stop loss and proper position sizing.
---
#SHELL #SHELLUSDT #Crypto #TechnicalAnalysis #SupportResistance #Breakout #DescendingTriangle #CryptoTrading
Chainlink 4H Update | LINK Testing $23.50My bias is still more upside mid-term. On the 4-hour chart, if LINK reclaims 23.50, the path opens toward 24.83 and 26.71. If it fails and drops below 22.78, the next supports are 21.92 and 21.62. The immediate battle is all about whether buyers can flip 23.50 back in their favor.

LINK/USDT — Golden Zone Will Decide the Next Move!?Current Price: ~23.47 USDT
Chainlink (LINK) has just completed a strong rally from the yearly low at 10.10 to the peak of 30.94. Now, the price is consolidating and retesting the Fibonacci Golden Pocket — a critical area that will decide whether the uptrend continues or a deeper pullback occurs.
---
🔎 Market Structure Analysis
Primary Trend: Strong bullish reversal since June 2025, with higher highs and higher lows forming.
Current Condition: Price is pulling back from the recent top (30.94) and consolidating around 23–25, right above the Golden Pocket (21.18–19.86).
Key Demand Zone: The yellow area (19.8–21.2), previously a strong resistance, is now acting as support (supply → demand flip). Holding this zone is crucial for the next big move.
---
🟢 Bullish Scenario
If LINK holds above 21.18–19.86, the current move is likely just a healthy retracement before continuation.
Confirmation: Daily close above 25.24–26.65 with rising volume.
Upside Targets:
🎯 Target 1: 25.24 (minor resistance)
🎯 Target 2: 26.65 (key breakout level)
🎯 Target 3: 29.20
🎯 Target 4: 30.8–31.0 (previous high)
Breaking above 30.8 could open the door for new highs in the coming months.
---
🔴 Bearish Scenario
If price fails to defend the 19.86–21.18 zone, a deeper correction may unfold.
Confirmation: Daily close below 19.8 with strong selling volume.
Downside Targets:
⚠️ Target 1: 15.63 (Fib 0.5)
⚠️ Target 2: 14.69 (Fib 0.618)
⚠️ Extreme Target: 10.10 (yearly low in case of panic sell).
---
📌 Key Technical Patterns
Bullish Flag / Consolidation: Current price action resembles a bull-flag formation after a strong impulse.
Supply-Demand Flip: The yellow zone (19.8–21.2) flipped from resistance into support — a decisive area for market structure.
Golden Pocket Fib: 0.5–0.618 retracements are historically strong levels for trend continuation.
---
🧠 Conclusion & Strategy
LINK is currently at a make-or-break golden zone.
Bullish Case: Holding above 19.8–21.2 keeps the bullish structure intact → targets at 26.6, 29.2, and 31.
Bearish Case: A breakdown below 19.8 opens risk for a correction toward 14–15 or even back to 10.1.
Trading Plan:
Accumulate near 21–23 if signs of bounce appear.
Breakout entry above 26.65 for swing targets at 29–31.
Place stop-loss below 19.8 to protect long setups.
Take partial profits at each resistance level.
---
📌 LINK is standing at a critical decision zone. Will buyers defend this golden pocket to fuel another leg up toward 30+? Or will sellers drag the price back to 15 and below?
#LINK #LINKUSDT #Chainlink #CryptoAnalysis #Altcoins #SwingTrading #TechnicalAnalysis #CryptoTA #Fibonacci #PriceAction

Chainlink Is About To Skyrocket To A New All-Time High!I believe Chainlink will blast off here to a new all-time high. We are seeing consistent, steady volume over time. LINK has consistently been in the top 20 coins in 30-day trading volume month after month. This will lead to one of the biggest pumps, if not the biggest pump, Chainlink has ever seen in terms of percentage gain.
As always, stay profitable.
Dalin Anderson.
