GOLD AND SILVER TRADE IDEA!I hope you guys enjoyed the video! Let me know if you have any questions or comments
Chart-pattern

BTCUSD H1 – Compression Inside Range, Expansion Is ComingOn the H1 timeframe, Bitcoin is currently trapped in a well-defined sideways range after a sharp impulsive sell-off from the higher resistance area. That initial drop clearly shifted short-term momentum bearish, but instead of continuation, price has transitioned into range-bound behavior, signaling absorption and indecision between buyers and sellers. The market is now oscillating cleanly between the upper range resistance (~90,200–90,300) and the lower support zone (~87,800–88,200), with repeated wicks and overlapping candles — classic signs of balance, not trend.
From a structural perspective, this is not a trend yet, but a preparation phase. Liquidity is being built on both sides. The EMA is flattening and running through the middle of the range, reinforcing the idea that momentum is neutral and price is waiting for a catalyst. As long as BTC remains inside this sideways zone, trading the middle carries poor risk-reward, and patience is required.
Key scenarios going forward:
If buyers manage to hold above the support zone and break decisively above the range high, the upside opens toward the 93,000–94,000 resistance zone, where prior supply sits. That would confirm a successful absorption of sell pressure and a bullish range expansion.
However, a clean breakdown and acceptance below the support zone would invalidate the range and likely trigger a bearish continuation, opening the door toward deeper downside levels in the mid-85,000s, as indicated by the projected path.
BTC is in compression mode. The range will not last forever the next impulsive move will come from a confirmed breakout or breakdown, not from guessing inside the box. Let price show its hand, then act. Risk management remains key.

ATH Under Pressure: Continuation or Distribution?Gold is currently trading at a critical inflection point near the All-Time High (ATH) after completing a strong impulsive rally from the lower accumulation zone. The bullish leg was clean and well structured, driven by sustained higher highs and higher lows, confirming strong buyer control throughout the advance. However, upon reaching the ATH region, price has begun to stall and reject, signaling that supply is actively responding at this premium area.
Structurally, the market is now compressed between two key forces. On the downside, the upper demand zone around 4,880–4,900 has already proven its importance, acting as a reaction level where buyers previously stepped in aggressively. On the upside, the ATH resistance band is capping price and preventing immediate continuation. This creates a classic decision zone, where Gold must either absorb supply and break higher, or fail and rotate lower.
From a bullish continuation perspective, a clean breakout and acceptance above the ATH zone would confirm that buyers remain in full control. In that scenario, the projected expansion toward the 5,100 target becomes technically valid, following range-expansion and momentum continuation logic. This would imply that the recent pause is merely consolidation before another markup phase.
Conversely, if price breaks decisively below the upper demand zone, the structure starts to resemble a potential Head & Shoulders distribution, as highlighted on the chart. A confirmed breakdown would likely trigger a deeper corrective move toward the lower demand zone around 4,730–4,760, where the broader bullish structure would be tested. As long as this lower demand holds, the higher-timeframe uptrend remains intact, but momentum would clearly shift from expansion to correction.
Key takeaway: Gold is not weak, but it is no longer in free-flow markup. This is a high-stakes area where confirmation matters more than prediction. Either the ATH breaks and opens the door to 5,100, or failure here leads to a controlled but meaningful pullback. Traders should stay patient and let price confirm direction before committing risk.

ETH After the Flush — Correction Phase or Just a PauseETHUSD H4 — Capitulation Complete, Is a New Impulse Wave Loading?
ETH on the H4 timeframe has completed a clear distribution → breakdown → impulsive sell-off, followed by a developing Elliott Wave corrective structure at lower prices. The prior accumulation range at the top failed decisively, triggering a strong bearish impulse that unfolded cleanly into a 5-wave decline (1–2–3–4–5), confirming a completed impulsive leg to the downside.
Price is now transitioning into a corrective phase, currently mapping out an ABC correction. Wave (A) has already formed with a sharp rebound from the lows, while the market is now probing for a Wave (B) retracement, likely into the lower liquidity pocket near the recent lows. This is typical post-impulse behavior, where the market retests demand to confirm whether sellers are exhausted.
The key technical detail here is that price remains below the EMA 98, which is still sloping downward a strong sign that macro control remains bearish. As long as ETH trades below this dynamic resistance, any upside move should be treated as corrective, not trend reversal.
If Wave (B) holds above the recent low and structure remains intact, the market opens the door for Wave (C) a corrective expansion targeting the 3,200–3,250 region, aligning with prior structure and the EMA zone. That area would be a high-probability reaction zone, not a blind breakout level.
Invalidation occurs if price loses acceptance below the Wave (B) low, which would signal continuation of the bearish trend rather than correction.
ETH has likely completed a bearish impulse and is now in a textbook Elliott Wave correction (ABC). Upside is possible, but it remains corrective until the EMA 98 and prior structure are reclaimed.

ETHEREUM H4 — Decision Point Inside Premium DemandOn the ETH 4H chart, price has completed a full Cup & Handle expansion and topped at the pivot high before transitioning into a sharp corrective leg. The selloff was impulsive, not corrective, confirming that the move is a higher-timeframe pullback, not random volatility. ETH is now trading directly inside a premium demand zone, which is a critical decision area for the next multi-session move.
Structurally, this zone is important because it is the origin of the prior expansion leg. If demand holds and price forms a base here (compression, higher lows, failed breakdowns), ETH can re-accumulate and rotate higher toward Target 1 → Target 2 → Target 3, with the first key reclaim being the handle-low region and then the mid-range resistance. That scenario would signal absorption of sell pressure and continuation of the broader bullish structure.
However, if price fails to hold this demand zone and we see a clean breakdown with acceptance below it, the bearish scenario activates. That would confirm a distribution-to-expansion failure, opening the door for a deeper markdown toward lower liquidity levels, as projected by the red path.
ETH is at a make-or-break level. This is not the place to chase . it’s the place to wait for confirmation. Hold demand → bullish continuation. Lose demand → deeper correction. Let price show its hand before committing.

EURUSD Rejects Key Resistance – Bearish Continuation On the H1 timeframe, EURUSD is showing a clear rejection from a major resistance cluster, reinforcing the prevailing bearish structure. After a sharp impulsive rally, price failed to sustain acceptance above the 1.1695–1.1705 resistance zone, which aligns with prior structure resistance and the downward trendline from the recent swing high. The strong bearish reaction from this area confirms that the upside move was corrective rather than the start of a new bullish trend. Structurally, the market remains in a lower-high formation. The descending trendline continues to cap price, and repeated failures near this resistance zone indicate that sellers are still firmly in control. The EMA has flattened and rolled over, acting as dynamic resistance, with price now trading below it a classic sign of bearish continuation after a pullback. The current consolidation around 1.1685–1.1690 should be viewed as a bearish pause, not accumulation. Price action is overlapping and weak, suggesting distribution before another leg lower. As long as EURUSD remains below 1.1705, downside scenarios remain favored. From here, a continuation move toward 1.1662 is the first logical objective, followed by deeper downside targets near 1.1638, where prior demand previously reacted. Only a clean break and sustained hold above 1.1705–1.1720 would invalidate this bearish setup and force a reassessment of market structure.
In summary, EURUSD is rejecting resistance within a broader downtrend. The recent rally lacks follow-through, and current price action supports a sell-the-rally environment, with bearish continuation favored until proven otherwise.

Breakout Reaction Completed, Market Now At Decision PointOn the H4 timeframe, EURUSD has just delivered a clean bullish break from the prior consolidation, marked by a strong impulsive candle that displaced price above multiple intraday resistance levels. This move represents a short-term structure break, shifting momentum bullish after an extended downtrend. However, the market has not confirmed continuation yet instead, price is pulling back and retesting the 1.1665–1.1600 support zone, which now acts as the key decision area. From a structure perspective, this is a classic breakout → pullback scenario. If price holds above the support zone and forms higher lows, the pullback should be read as healthy absorption, opening the path for continuation toward 1.1725 → 1.1790 → 1.1808 (prior HTF liquidity and resistance). In this case, the earlier downtrend would be considered temporarily neutralized.
Conversely, failure to hold the support zone — especially a clean acceptance back below 1.1600 would invalidate the breakout and confirm the move as a liquidity grab / false break, exposing EURUSD to renewed downside pressure and continuation of the broader bearish structure.
In summary: bullish momentum has appeared, but confirmation is not complete. This is a wait for reaction zone, not a chase zone. Direction will be decided by whether buyers can successfully defend the reclaimed support.

Healthy Pullback or Trap Before the Next Push Higher?On the EURUSD H1 chart, price remains in a bullish intraday structure, but the market is currently transitioning into a corrective pullback phase after the strong impulsive rally. The initial breakout leg was clean and aggressive, confirming buyer dominance and shifting structure decisively to the upside. Since then, price has failed to make new highs and has begun rotating lower, signaling profit-taking rather than full trend reversal.
Technically, EURUSD is now trading between the short-term moving averages, with price reacting around the mid-range near 1.1680–1.1700. This zone is acting as a decision area: buyers are defending it, but momentum has clearly slowed. As long as price holds above the deeper support zone around 1.1620–1.1650, the broader bullish bias remains intact. A sweep into that support would likely serve as liquidity grab + re-accumulation, not immediate breakdown.
From a structure perspective, the current move down looks corrective overlapping candles, shallow follow-through, and no strong bearish expansion. If buyers step back in from support and reclaim 1.1700, the path opens toward Target 1 near 1.1740–1.1760, aligning with prior highs and untouched liquidity.
EURUSD is not bearish . it is cooling off after an impulse. As long as support holds, this pullback favors continuation higher, with the next upside leg dependent on a clean reaction and reclaim above the mid-range. Until support breaks decisively, downside should be treated as retracement, not trend failure.

ATH Rejection or Just a Pause Before the $5,000 Run?On the Gold (XAUUSD) H1 chart, price is firmly holding a bullish market structure, despite the recent rejection from the ATH zone near 4,880–4,900. The prior move into ATH was a strong impulsive expansion, signaling aggressive institutional buying rather than a weak breakout. The pullback that followed is orderly and corrective, not impulsive a key distinction that keeps the bullish thesis intact.
Technically, price is now reacting inside a clearly defined support zone around 4,760–4,780, aligning closely with the rising short-term EMA (blue). This confluence suggests buyers are defending structure, absorbing sell pressure after the ATH liquidity sweep. The candles here show stabilization and higher lows, which is typical re-accumulation behavior after a strong markup leg.
As long as Gold continues to hold above this support zone, the broader bias remains continuation to the upside. A confirmed push back above 4,850–4,880 would signal that the pullback phase is complete and open the path toward new ATHs, with the higher-timeframe extension pointing toward the psychological $5,000 target.
This is not distribution it’s bullish digestion. Gold is consolidating above a major support after an ATH breakout. Hold above the current support zone keeps the trend bullish, and the next confirmed expansion could accelerate price into uncharted territory toward $5,000.

BTC at a Decision Point — Relief Bounce or Lower High?On the BTCUSD H1 chart, price remains firmly in a short-term bearish structure following the sharp impulsive sell off from the 95,000 region. The breakdown from the prior consolidation occurred with strong momentum, slicing cleanly below the EMA and confirming a shift from balance to markdown. Since then, Bitcoin has been trading beneath a well-defined resistance zone around 93,200–93,500, where previous support has now flipped into supply a classic bearish market behavior.
The recent reaction from the support zone near 88,000–88,500 is technically a relief bounce, not a reversal. Structurally, the bounce is corrective: price is forming overlapping candles and shallow pullbacks, suggesting short covering rather than aggressive new demand. As long as BTC remains capped below 89,900–91,200, the probability favors a lower high forming before sellers reassert control.
If buyers can hold above the support zone and reclaim 89,900, a deeper corrective move toward 91,200–91,500 is possible, where the EMA and prior intraday structure align. However, this zone is expected to act as sell side re entry, not a breakout level. Failure to build acceptance above that area would likely trigger another leg down, reopening downside liquidity toward the lower 88,000 region and potentially below if support weakens.
Bitcoin is currently in a bearish retracement phase inside a broader intraday downtrend. The support zone is holding for now, but without a strong structural reclaim, upside moves should be treated as corrective pullbacks into resistance. Until BTC decisively breaks and holds above the resistance zone, risk remains skewed to the downside, with sellers still controlling market structure.

ETH Liquidity Sweep Complete: Accumulation or Trap On the ETHUSD H1 timeframe, the market has just completed a clean liquidity sweep below value, and the structure now transitions into a very sensitive decision zone.
Ethereum previously traded inside a high-volume liquidity range around 3,280 – 3,350, where price repeatedly stalled and failed to expand higher. The sharp bearish impulse candle slicing through this range was not random it was a distribution break, confirmed by strong momentum and a decisive loss of the EMA 89. Once price accepted below that EMA, upside continuation was structurally invalidated.
Following the breakdown, ETH rotated briefly inside a lower accumulation zone (~3,160 – 3,220). However, this was not true accumulation it was bearish acceptance, evidenced by overlapping candles, weak bounces, and failure to reclaim the EMA. The final sell-off flushed liquidity directly into the major support zone around 3,050 – 3,080, where reactive buyers are now expected to appear.
From a professional market-structure perspective, the current price action suggests sell-side liquidity has been largely cleared. This opens the door for a technical rebound, but context is critical: any bounce from this support should be treated as corrective, not trend-confirming, until price can reclaim and hold above the broken accumulation range near 3,220 – 3,240.
The projected upside path on the chart reflects a mean-reversion scenario a bounce from support, followed by a retest of prior value. If ETH fails at that retest, it would confirm the move as a classic liquidity grab + lower-high setup, increasing the probability of another downside leg. Only sustained acceptance back above the liquidity range would flip bias bullish again.
Key takeaway:
ETH is currently trading in a post-distribution environment. The dump was structural, not emotional. Support may produce a bounce, but until value is reclaimed, rallies are reactions not reversals. Smart traders now wait for confirmation at the reclaim, not at the bottom.

ETH Just Collapsed Into Support — Relief Bounce or Start Break1. Market Structure & Impulse Context
ETH has just printed a strong bearish impulse from the upper range, breaking decisively below the EMA cluster (fast + slow EMAs). This move is not corrective — it is an impulsive sell-off, signaling aggressive distribution from the resistance zone near 3,360–3,380.
When price leaves a range with this level of momentum, the first reaction into support often determines whether the move is: a trend continuation, or a liquidity sweep before reversal
Right now, ETH is at that decision point.
2. Key Zones on the Chart
Resistance Zone: 3,360 – 3,380 → Major supply + prior rejection area
Mid-Level / Reaction Zone: ~3,240 → Previous structure support turned resistance
Support Zone: 3,160 – 3,180 → First meaningful demand after the breakdown
Price is currently compressing just above the support zone, not bouncing strongly yet this is important.
3. EMA & Trend Alignment
Both EMAs have now rolled over and crossed bearish, with price trading well below them. This confirms:
- Short-term trend has flipped bearish
- Any upside move from here is counter trend unless price reclaims the EMA zone decisively
As long as price remains below the EMAs, rallies should be treated as pullbacks, not trend reversals.
4. Price Action & Liquidity Read
Current candles are small, overlapping, and indecisive classic pause after impulse behavior. This often leads to one of two outcomes:
- A technical relief bounce to rebalance liquidity
- Or support failure once weak buyers are absorbed
Liquidity is clearly resting below the support zone, while unmitigated supply remains above.
5. Scenarios to Watch
🔼 Bullish Relief Bounce (Corrective Scenario)
Support at 3,160–3,180 holds
Price pushes back toward 3,240 reaction level
Extension toward 3,350–3,360 resistance if momentum builds
⚠️ This would still be a counter-trend move unless structure flips.
🔽 Bearish Continuation (Higher Probability)
Clean break and acceptance below 3,160
Acceleration toward 3,120 → 3,080 liquidity zone
Confirms that the impulse was the start of a larger markdown
This scenario aligns with EMA structure, impulse behavior, and broader distribution context.
6. Trading Perspective
Bias: Bearish continuation unless proven otherwise
Aggressive longs are risky inside support without confirmation
Shorts favored on:
Weak bounce into 3,240
Or confirmed breakdown below 3,160
Summary
ETH has transitioned from range → distribution → impulse. The current pause at support is not yet a reversal signal. Until price reclaims key structure and EMAs, the market remains vulnerable to another downside expansion.
This is a classic moment where patience pays let the market show whether this support is real demand… or just a stop before the next drop.

EURUSD Pressed Against the Downtrend On the H4 timeframe, EURUSD remains firmly locked in a bearish market structure, with price continuing to respect a well-defined descending trendline that has capped every recovery attempt. The broader picture is clear: this is a controlled downtrend, not a capitulation move.
Structurally, the market has been printing lower highs and lower lows, while price consistently trades below the EMA cluster, reinforcing bearish trend alignment. Each bullish swing has been corrective in nature, lacking impulsive follow-through a classic sign of weak demand and dominant sellers.
The recent sell-off pushed price into the 1.1575–1.1580 support zone, where we are now seeing a short-term reaction. This bounce is technically expected, as this level has previously acted as demand and liquidity support. However, context matters: support inside a downtrend is not a buy signal it is a decision zone.
From here, two scenarios stand out clearly:
Corrective bounce scenario: Price may grind higher toward the descending trendline and EMA resistance zone around 1.1650–1.1665. If bullish momentum stalls there, that area becomes a high-probability sell zone, aligned with trend continuation logic.
Bearish continuation scenario: Failure to build acceptance above the current support, or a clean breakdown below 1.1575, would signal renewed sell pressure and open downside continuation toward 1.1520 and lower liquidity pools.
Importantly, the rounded corrective structures drawn on the chart highlight distribution behavior, not accumulation. Buyers are reactive, not proactive — while sellers remain positioned at premium levels.
➡️ Trend bias: Bearish
➡️ Key resistance: 1.1650–1.1665 (trendline + EMA)
➡️ Key support: 1.1575
➡️ Best approach: Sell rallies, not chase bounces
Until EURUSD breaks and holds above the descending trendline with strong momentum, any upside should be treated as corrective not reversal.

EURUSD Trapped in a Descending ChannelOn the H4 timeframe, EURUSD continues to respect a well-defined descending price channel, confirming that the broader structure remains bearish. Since topping near the 1.1800 region, price has consistently printed lower highs and lower lows, with each recovery leg being capped by the upper boundary of the channel.
From a price action standpoint, every bullish push is corrective in nature. We can clearly see sharp impulsive sell-offs followed by weaker, overlapping pullbacks — a textbook sign that sellers remain dominant, while buyers are only reacting, not leading. The most recent rebound attempt was once again rejected near the channel resistance, reinforcing this zone as a strong area of supply.
The EMA (yellow) is sloping downward and sitting above price, acting as dynamic resistance. As long as EURUSD trades below this moving average and remains inside the channel, bullish scenarios are considered counter-trend and higher risk. Momentum remains aligned with the downside, and there is no structural evidence of accumulation at this stage.
Currently, price is drifting toward the lower boundary of the channel, with a key horizontal level near 1.1500 acting as the next major downside magnet. This level aligns with prior liquidity and structural support, making it a logical target if bearish pressure persists. A minor bounce from the channel base is possible, but unless price breaks and holds above the channel resistance, any upside should be viewed as a selling opportunity rather than a trend reversal.
Bearish continuation scenario:
– Rejection from channel resistance → continuation lower
– Targets: 1.1550 → 1.1500
Invalidation / shift in bias:
– A strong H4 close above the descending channel and EMA, followed by acceptance, would be the first signal that bearish control is weakening.
➡️ Trend: Bearish
➡️ Structure: Descending channel
➡️ Key resistance: Channel top + EMA
➡️ Key support: 1.1500 zone
At this stage, EURUSD is not bottoming it is grinding lower within a controlled bearish structure.

EURUSD Compresses at Demand — Breakdown Trap or Reversal Setup?EURUSD on the H1 timeframe remains in a clear short-term downtrend, defined by a descending trendline and a sequence of lower highs. Each bullish attempt into the trendline has been firmly rejected, confirming sellers remain in control of structure.
Price is now pressing into a well-defined demand zone around 1.1590–1.1600, where selling momentum has slowed and candles are beginning to compress. This behavior suggests selling pressure is being absorbed, rather than accelerating lower, which is typical ahead of a reaction or short-term reversal.
The key level to monitor is the trendline break.
– A clean break and close above the descending trendline, followed by acceptance above 1.1624, would confirm a bullish shift, opening room toward 1.1655–1.1690.
– Failure to hold the demand zone would invalidate the rebound scenario and expose liquidity below 1.1590 before any meaningful recovery.
➡️ Market state: Downtrend testing demand
➡️ Bias: Neutral → Bullish only on trendline break
➡️ Bullish trigger: Break & close above 1.1624
➡️ Bearish invalidation: Sustained break below 1.1590
At this point, EURUSD is at a decision zone either forming a base for reversal or preparing for one final liquidity sweep before turning higher.

ETH Trapped Between Supply & Demand On the H1 timeframe, Ethereum is clearly transitioning from impulsive strength into a balanced range environment. After a sharp bullish breakout, price stalled inside a well-defined resistance zone around 3,380–3,420, where repeated attempts to push higher have been rejected. This behavior confirms that sell-side liquidity is actively defending the highs, preventing continuation for now.
Structurally, ETH is printing overlapping swings with equal highs and shallow pullbacks, a textbook sign of consolidation rather than trend continuation. On the downside, the support zone around 3,260–3,280 continues to attract buyers, aligning closely with the rising EMA structure. As long as this zone holds, downside pressure remains corrective, not impulsive.
However, momentum has noticeably weakened. Each push into resistance lacks follow-through, while bounces from support are becoming less aggressive. This suggests buyers are absorbing supply, but not yet strong enough to force a breakout. The market is effectively coiling, compressing volatility between supply and demand.
From a trading perspective, ETH is currently in a high-risk middle-range zone. The higher-probability opportunities will come from reactions at the extremes:
A clean rejection from resistance keeps the bias short-term bearish, opening room for a deeper pullback toward 3,200–3,150.
A strong breakout and acceptance above 3,420 would invalidate the range and signal trend continuation toward higher expansion targets.
➡️ Market state: Range / consolidation
➡️ Key resistance: 3,380–3,420
➡️ Key support: 3,260–3,280
➡️ Bias: Neutral-to-bearish below resistance, bullish only on confirmed breakout
Until the range resolves, ETH is best treated as a reaction-based market, not a directional one.

BTC Stalls at Premium After Vertical Rally — Liquidity Below Hi Guys!! On the H1 chart, Bitcoin has just completed a strong impulsive bullish leg, breaking cleanly above the EMA 89 and accelerating straight into a clearly defined resistance zone around 95,700. This type of vertical expansion typically reflects aggressive buy-side execution, but it also leaves the market structurally imbalanced. As price reaches the resistance area, momentum noticeably slows and candles begin to compress, signaling that buyers are no longer willing to chase at premium levels while early longs start to take profit.
The current price action should be read as a post-impulse distribution and pause, not immediate trend continuation. With price holding just beneath resistance and failing to produce strong bullish follow-through, the probability increases that the market will rotate lower to rebalance. Below current price lies a series of stacked liquidity pools and inefficiencies, first around 94,080, then 93,146, and deeper toward 91,800–90,900, which also aligns closely with the rising EMA structure. These levels represent logical downside magnets where sell-side liquidity rests after the sharp rally.
From a market structure perspective, a pullback into these zones would be technically healthy, allowing Bitcoin to mitigate the imbalance created by the impulsive move and test whether demand is genuinely strong or merely momentum-driven. If price reacts positively and shows acceptance within the lower liquidity zones, that would provide a stronger base for a renewed bullish continuation later on. However, only a clean and sustained acceptance above the 95,700 resistance would invalidate the corrective scenario. Until then, Bitcoin remains in a premium consolidation phase, with downside liquidity acting as the dominant draw before the next major directional decision.

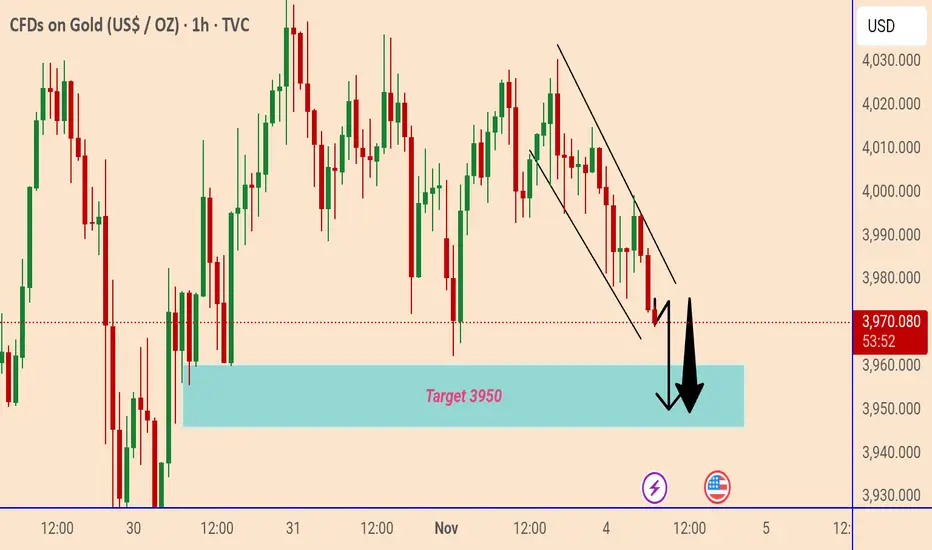
Gold Price Targets 3950 Support ZoneGold price is trading in a downward channel on the 1-hour chart, showing continued bearish momentum. The next key support and target area is around 3950 USD, where buyers may look for a potential reaction.
XAU/USD Analysis–Bearish Continuation Within Descending Channel📉 Gold (XAU/USD) H1 Analysis – March 26, 2025
🔻 Descending Channel Formation:
The price remains confined within a downward-sloping channel, signaling continued bearish pressure.
Lower highs and lower lows confirm the short-term downtrend.
📍 Key Levels & Structure:
Current Price: $3,019
Resistance Zone: Around $3,025 - $3,030 (upper boundary of the channel)
Support Zone: $3,000 psychological level and potential lower boundary near $2,985
📌 Market Imbalance (MB) Not Filled:
A minor liquidity gap remains unfilled above, indicating a possible short-term retest before continuation.
📉 Bearish Expectation:
If price fails to break above the resistance trendline, we could see a drop toward $3,000 or even lower.
Watch for rejection signals at the upper boundary for short opportunities.
🔎 Trade Considerations:
Bearish Bias: Short entries from resistance with targets at $3,010 - $3,000.
Invalidation: A breakout above $3,030 could signal bullish strength.

EUR/USD Market Trends: Insights and ForecastsRecent Movement: The price has been relatively volatile in the recent period, with several ups and downs. Currently, the price is trading slightly above the key support level around 1.0825.
Support and Resistance: The horizontal lines drawn on the chart suggest potential support and resistance levels. A break above the nearest resistance level around 1.0850 could signal further upward momentum, while a break below the support level around 1.0825 could indicate potential weakness.
Trend: It is difficult to definitively identify a clear trend based on this timeframe. The price has been fluctuating between support and resistance levels, suggesting a potential sideways or ranging market.
Short-Term (Next Few Days): The price is currently near a key support level. If it holds above this level, we might see a retest of the resistance level around 1.0850. However, a break below the support could lead to further downside.
Medium-Term (Next Week): The overall trend remains unclear. A sustained move above the resistance level could signal a bullish bias, while a sustained move below the support level could indicate a bearish bias

#Pendle 1D chartSEED_DONKEYDAN_MARKET_CAP:PENDLE 1D chart;
It accepts the trend line extending from October 2023 to the present as a balance and continues to rise.
We can see an upward movement after the squeeze with the falling trend line.
There is a ratio of 112% between the harmonic structure it has created and the target zone.

RNDR - A long term trade opportunityBINANCE:RNDRUSDT (1D CHART) Technical Analysis Update
RNDR is currently trading at $9.39 and showing overall bullish sentiment. Price has broken out from resistance multiple times and now it has hit the support again and bounced back from the support line. This is showing overall bullish momentum and we have a good long term trade opportunity here.
Entry level: $ 9.43
Stop Loss Level: $ 6.55
TakeProfit 1: $ 10.7598
TakeProfit 2: $ 12.3494
TakeProfit 3: $ 15.6090
TakeProfit 4: $ 19.4590
TakeProfit 5: $ 27.9267
TakeProfit 6: $ 35.9265
Max Leverage: 5x
Position Size: 1% of capital
Don't forget to keep stop loss.
Follow Our TradingView Account for More Technical Analysis Updates, | Like, Share and Comment Your thoughts.
Cheers
GreenCrypto

Bitcoin New Update
Next Best Current Support Is Between ($64500 - $66600)
BreakDown Will Lead A Flash Crash Till $60K With A Possible Wick
Holding The Support Can Test The ATH($73777) Again
Till Then,
Make Sure To Use Proper StopLoss Bitcoin (Update)
Next Best Current Support Is Between ($64500 - $66600)
BreakDown Will Lead A Flash Crash Till $60K With A Possible Wick
Holding The Support Can Test The ATH($73777) Again
Till Then,
Make Sure To Use Proper StopLoss
