EUR/JPY 30M: High-Probability Short Setup & Supply Reversal Zone📉 EUR/JPY 30M: High-Probability Short Setup at Supply Reversal Zone
📝 Market Overview and Trend Context
The EUR/JPY pair is currently in a phase of strong recovery following a significant drop from a prior high established around the 181.400 level. This sharp, corrective rally (indicated by the upward price action starting December 2nd) is now approaching a critical area of unmitigated institutional supply.
The analysis focuses on exploiting the expected resumption of the selling pressure from this proven zone, treating the current bullish move as a deep retracement into an area where prior sellers initiated their positions.
🔑 Key Zones for Institutional Order Flow
The chart highlights two confluent zones that form the basis of the short hypothesis:
1. Reversal Zone / Volume Burst 🔴
Zone Location: This is the combined area (green and light-red boxes) spanning approximately 181.250 to 181.400.
Significance: This area is the precise origin of the prior sharp move down, making it a high-quality Supply Zone where a large concentration of selling orders is expected to reside.
The lower part, labeled "Reversal Zone", is the critical price level where resistance is first expected.
The upper part, "Volume Burst", represents the last opportunity for sellers to defend the price before the structure is broken.
Technical Confluence: The prior structural high is situated just above this zone, making it a key area of defense for existing sellers and a target for liquidity grabs.
2. Order Flow Origin (OFR)
Location: The level around 180.400.
Significance: This marks the point from which the previous aggressive move originated. While not an immediate target, a successful short trade from the supply zone would ultimately aim to break this lower structural point, confirming a shift in market control back to the bears.
📊 Trading Hypothesis: Shorting the Supply Test
The trade plan anticipates a rejection from the institutional supply zone:
Direction: Short (Sell)
Entry Strategy: Entry is optimal upon price tapping the Reversal Zone (starting around 181.250). Crucially, the chart demands a "Bearish Pattern Must" confirmation. This means traders should drop to a lower timeframe (e.g., 5M or 15M) and wait for a clear bearish reversal pattern (e.g., bearish engulfing candle, a double top on the smaller timeframe, or a break of minor structure) before initiating the short trade.
Stop Loss (S/L): The Stop Loss must be placed securely above the entire Volume Burst area (e.g., above 181.450). This placement protects the trade against a clear invalidation of the supply structure.
Take Profit (T/P) 1 (Initial Target): A strong initial target is the current swing low or the next clean demand zone, typically in the 180.700 area.
Take Profit (T/P) 2 (Continuation Target) : If price aggressively breaks T/P 1, the ultimate target is a run towards the OFR low around 180.400, confirming a full reversal of the recent bullish momentum.
⚠️ Risk Management and Invalidation
The greatest risk to this setup is the continuous bullish momentum breaking the prior high. A confirmed close above the Volume Burst zone (181.400) would signal a continuation of the bullish trend and invalidate the short setup. Adherence to the "Bearish Pattern Must" entry condition is paramount for reducing risk and avoiding false early entries.
Chartanalysis

EUR/USD 30M: Targeting a Mini Zone for a Bullish Continuation🚀 EUR/USD 1H/30M: Targeting a Volume Burst Zone for a Bullish Continuation
🎯 Key Analysis: Seeking Long Entry from Demand
This analysis focuses on the EUR/USD pair on the 1-hour chart (labeled as 1H in the corner, but the title references 30 Mints Analysis—suggesting the core idea is for intraday trading based on a higher timeframe structure). The core strategy is to identify a high-probability Demand Zone after a major market event (the prior spike) and anticipate a bullish continuation.
📉 Prior Price Action and Market Context
The chart shows a significant price movement just before the analysis period:
Strong Upward Move: Price saw a sharp, aggressive rally, creating a new swing high.
Order Flow Reversal (OFR): Following the rally, the price experienced an equally sharp, deep pullback. The level labeled "OFR" (likely standing for Order Flow Reversal or the initiation point of the pullback) marks the immediate distribution that occurred after the high was printed.
Current Status: Price has stabilized following the sharp drop and is now consolidating just above the identified entry zone.
💡 The Bullish Setup: Mini Reversal Zone (Demand)
The trade hypothesis is based on price pulling back into a high-quality demand zone before moving higher.
1. Volume Burst / Mini Reversal Zone (Demand Entry) 🟢
Zone Location: The primary interest zone is the green shaded box, spanning approximately 1.15900 to 1.16050.
Significance: This area is the "Mini Reversal Zone" which coincides with a "Volume Burst" zone. This suggests it's the origin of the aggressive buying that launched the previous rally (the base of the strong move).
Action Plan: This zone is anticipated to be a high-probability area for buyers to step in again, absorbing the selling pressure from the current pullback.
Target Entry: Entry is suggested near the upper boundary of this zone, specifically around 1.16000 (a psychological level) or slightly below, maximizing the risk/reward ratio.
2. The "Need Pattern" 📈
The chart indicates a "Need Pattern" arrow pointing into the entry zone. This suggests the analyst expects a specific candlestick pattern (e.g., an engulfing candle, pin bar, or double bottom) or a clear shift in lower timeframe momentum within this zone to confirm the long entry.
📈 Proposed Trade Plan & Target
Direction: Long (Buy)
Entry: Wait for price to enter the Mini Reversal Zone (~1.16000 - 1.16050) and confirm with a bullish pattern ("Need Pattern").
Stop Loss (S/L): Place the Stop Loss safely below the Volume Burst zone (e.g., below 1.15850) to protect against continuation of the bearish move.
Take Profit (T/P) : The initial target would be a retest of the prior high, or a move back to the OFR level (around 1.16250 - 1.16300) for a strong risk/reward. The long-term target is a break of the previous high, as shown by the upper arrow.
⚠️ Risk Disclaimer
This is a counter-trend move relative to the sharp pullback. Traders must wait for confirmation (the "Need Pattern") in the Mini Reversal Zone to manage risk effectively. Failure to hold the demand zone could signal a deeper move down.

Still Watching the Market Move Without You? Fix That Today.1. Current Market Structure
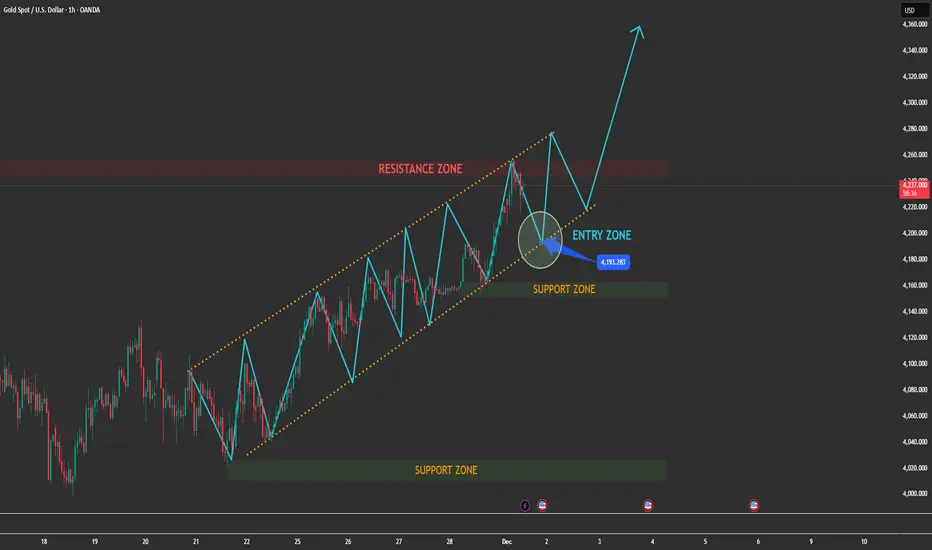
- Gold is moving inside a well-defined ascending channel, respecting each swing high and swing low with precision — a clear sign that the bullish structure is still intact.
- Key observations:
+ Price has just rejected from the resistance zone at the top of the channel.
+ The current correction is healthy and normal within an uptrend, not a reversal signal.
+ Buyers are still defending the structure as long as price stays above the mid-channel + support zone.
+ Momentum remains bullish — any pullback into the highlighted ENTRY ZONE becomes a high-probability continuation setup.
This is exactly how a strong trending market behaves before its next leg up.
2. MAIN TRADING SCENARIO (HIGH PROBABILITY) – LOOK FOR LONG
➤ Scenario: Price pulls back into the ENTRY ZONE (channel bottom + support zone)
Expectations:
Price retests the lower boundary of the ascending channel
Buyers step in at the confluence area (trendline + structure)
A bullish rejection pattern → strong confirmation for LONG entries
Reasons this setup is high probability:
✓ Confluence of trendline support + horizontal support zone
✓ Clear bullish market structure (higher highs – higher lows)
✓ Retracement after hitting channel resistance is expected
✓ No sign of bearish reversal structure at the moment
Upside Target:
Once price bounces from the entry zone:
TP1: Retest of the resistance zone
TP2: Breakout of the channel → continuation to higher highs (as marked on the chart)
3. Alternative Scenario (Low Probability)
If price breaks below the channel and closes under the support zone:
Market shifts into a corrective phase
Wait for structure to rebuild
No aggressive sells — only reassess when major levels break decisively
But at the moment, the bullish structure remains strong.
4. Conclusion
Gold is still respecting its bullish channel perfectly.
The upcoming pullback is NOT weakness — it is an opportunity.
→ Priority: LOOK FOR LONG in the ENTRY ZONE.
→ Target: A new bullish impulse wave forming toward higher highs.
USD/JPY Analysis : Potential Reversal & Supply From Target Zone 📈 USD/JPY 1H: Potential Reversal and Supply Retracement Play
🔑 Key Context: Bearish Trend with Demand Zone Reaction
The chart initially shows a strong downward trend or significant pullback, characterized by lower swing highs and lower swing lows on the 1-hour chart. This bearish movement breached a prior low established around November 27th.
Prior Structure: Price fell sharply, breaking below a level that was part of a previous consolidation or minor distribution phase (the area marked 'D-R Supply' boundary).
Current Action: The price has recently made a strong low and is now showing signs of an aggressive move back up (a recovery rally).
🎯 Identifying Key Zones
The analysis highlights three critical zones based on supply/demand and technical structure:
1. Reversal Zone (Demand) 🟢
This is the lowest green box, around 154.650 - 154.800.
Significance: This zone acted as a strong Demand area, causing the significant bullish reversal/bounce we are currently seeing. It's the point where buyers stepped in aggressively, stopping the immediate bearish momentum. The low of the move touched the upper boundary of this zone before the strong rally began.
2. D-R Supply (Drop-Base-Drop/Rally-Base-Drop Supply) 🔴
This is the overall consolidation area that was previously broken, roughly between 155.600 and 156.400.
Significance: This large area represents where a significant amount of selling pressure entered the market, leading to the large drop. The current move upward is likely a retracement back into this supply structure.
3. Target and Volume Burst Zone 🔵 & 🟢
Target (Blue Box): This level, around 156.350 - 156.450, appears to be the immediate objective for the current bullish move. It lines up with the bottom of the old consolidation area (the D-R Supply).
Volume Burst (Top Green Box): This zone, from approximately 156.450 to 156.650, represents the upper part of the broken supply zone. This is a potential high-probability area where the initial sellers are likely to defend their positions, leading to a strong reaction (a "Volume Burst" of selling/distribution).
💡 Trading Hypothesis: Retracement to Supply
The current price action suggests the following trade setup:
Scenario : The bounce from the Reversal Zone (Demand) is expected to continue as a retracement to test the broken D-R Supply zone above.
Entry: Traders who entered at the Demand Reversal Zone would be looking to hold the position. New entries might look for continuation patterns to join the current rally.
Take Profit: The Target (blue box) and the lower part of the Volume Burst zone are key areas for taking profit on long positions, as price is expected to encounter significant resistance there.
Continuation/New Trade: Once the price reaches the Volume Burst area, a new short trade setup could be considered, anticipating a rejection and resumption of the overall bearish bias or a continuation of the downtrend from that high-resistance level.
⚠️ Caveats and Confirmation
The current rally needs to maintain momentum and successfully break above the CZ (Confirmation Zone) level marked around 156.000 to confirm the target is achievable.
Failure to sustain the rally above the 156.000 area could indicate a shallower retracement or a potential double-bottom/range setup.
Risk Management: Any long trade should place a stop-loss below the Reversal Zone low.

The Market Doesn’t Lie — But It Always Tests Your Nerve📈 NZD/USD TECHNICAL OUTLOOK — BUY FROM SUPPORT, TARGET THE BREAKOUT
1. Market Structure Overview
NZD/USD is currently correcting inside a descending pullback after a strong bullish impulse.
The structure is forming:
- A higher–low sequence, showing buyers are still in control
- A clear Support Zone where price previously reacted strongly
- A Resistance Zone above acting as the obstacle before a bullish breakout
Current price action is simply a retracement phase, not a bearish reversal.
2. Key Zone to Watch — LOOK FOR LONG
Your chart correctly marks the Entry Zone at the Support Zone.
Here’s why it’s high probability:
✓ Confluence for BUY
- Previous demand reacted sharply
- Market is forming a potential double-bottom or liquidity sweep
- Price is approaching the end of its corrective wave
- Momentum loss on the bearish leg
This area is where institutions typically accumulate long orders.
3. Main Scenario (High Probability)
[/b ]BUY FROM SUPPORT → BREAKOUT → FULL BULLISH CONTINUATION
When price taps the Support Zone:
-Look for rejection
- Look for a higher low
- Enter LONG on confirmation
- Stop loss below structure (as marked)
Take-Profit Levels:
- TP1: Mid-range / mini resistance
- TP2: Major Resistance Zone
- TP3: Full extension (your highest TP zone)
This matches your drawn black path:
Dip → higher low → breakout → strong bullish continuation.
4. Secondary Scenario (Lower Probability)
Price consolidates at Support but does not break higher immediately.
Even if so — this still favors accumulation, not selling.
As long as price stays above the Support Zone → the bias remains bullish.
5. Intraday Bias: BULLISH
- Structure: Uptrend
- Current move: Healthy pullback
- Key reaction zone: Support
- Best trade: BUY on rejection
- Risk management: SL below the liquidity sweep zone
This is a clean, textbook continuation setup.

BTCUSDT 30M Analysis: Reverse Zone Re-Test Before Major Drop 📊 BTCUSDT 30-Minute Technical Analysis – Reversal Zone Under Pressure
This 30-minute BTCUSDT chart highlights an important bearish setup forming after a sharp downside move. Bitcoin is currently consolidating near a Reversal Zone, suggesting that price may attempt a retest before continuing lower.
🔻 Market Structure Overview
Bitcoin recently experienced:
A strong impulsive sell-off
A brief consolidation phase
A minor recovery back into a previous support now acting as resistance
This structure indicates that sellers are still in control.
🟥 Reversal Zone (Major Resistance Area)
The highlighted red zone is the primary bearish reaction area.
Why this zone matters:
Price broke below this level with strong momentum
It is now acting as a potential supply zone
A bearish candlestick pattern in this area would confirm sellers stepping in
Your chart clearly notes: “Bearish Pattern Need On That Zone.”
A rejection here is the most important bearish confirmation.
🟦 Mini Reversal Zone (Previous Demand Area)
Below current price sits a smaller demand zone.
This zone previously showed:
Buyer reactions
Short-term reversals
Support in the recent downtrend
If price breaks below this mini zone, BTCUSDT may aim for deeper liquidity levels, confirming bearish continuation.
📉 Expected Price Behavior
Based on the projected path drawn on your chart:
Price will retest the Reversal Zone
A bearish engulfing, pin bar, or rejection wick may form
Price may drop aggressively after confirmation
Final target is a deeper zone around the previous swing lows
The downward arrow illustrates the expected continuation if bulls fail to defend nearby support.
⭐ Key Takeaways
Bitcoin remains in a bearish structure on the 30M timeframe
A strong bearish pattern in the Reversal Zone is required for confirmation
Rejection from this resistance may trigger another downside wave
Break and hold above the zone would invalidate the short-term bearish outlook
🧠 Short Summary for Minds
Bitcoin is approaching a key Reversal Zone on the 30-minute chart. If a bearish pattern forms here, BTCUSDT may continue dropping toward lower support levels. Sellers remain strong unless bulls break above the resistance zone.

BTCUSD (15m) – Support Rejection & EMA RecoveryBTCUSD (15m) – Support Rejection & EMA Recovery
Bitcoin dropped into a key support zone and showed a strong rejection wick, signaling buyer interest. Price has now pushed back above the 7 EMA and is challenging the 21 EMA, which is the first sign of short-term momentum shifting.
Two possible outcomes from this area:
1. Bullish Scenario (Green Path)
If BTC holds above the support zone and continues reclaiming the EMAs, price may look for a short-term recovery toward the next intraday highs.
2. Bearish Scenario (Red Path)
If price fails at the EMAs and falls back below the support zone, continuation to the downside becomes more likely.
Summary
Strong support reaction.
EMAs acting as early momentum indicators.
Both bounce and breakdown are possible depending on how price behaves around 21 EMA.

XAUUSD – Bullish Structure Holding Above EMAsXAUUSD – Bullish Structure Holding Above EMAs
Gold continues to trade in an upward structure, with price respecting both the 7-EMA and 21-EMA on the 15-minute chart. Momentum remains constructive as buyers maintain control above the intraday trendline and volume supports the ongoing push.
The setup highlights a potential continuation zone, with price consolidating above key EMAs and forming higher lows. As long as structure holds, the market may look for liquidity toward the next intraday highs.
This idea focuses on the current price behavior, EMAs alignment, and bullish market sentiment—not financial advice.

XAUUSD Analysis - Trendline Rejection & Potential Bounce Setup📊 XAUUSD 30-Minute Technical Analysis – Trendline Pressure & Key Demand Zone
This 30-minute XAUUSD chart shows gold currently trading under a clear descending trendline, indicating short-term bearish pressure. Price has rejected the trendline multiple times, confirming sellers are still active in the market.
🔻 Current Market Structure
Gold is forming lower highs and lower lows, respecting the downtrend structure. Recent candles show rejection from the trendline once again, suggesting a potential continuation toward the lower support zone.
🟦 Mini Reversal Zone (MRZ)
A key short-term demand area exists between 4,190 – 4,185 (marked in blue).
This zone has previously acted as a minor support, and the price may attempt a temporary bounce from here.
🟩 Major Demand Zone / Volume Burst Area
The stronger reversal area sits below the MRZ, highlighted in green.
This is where the chart indicates:
High buying volume previously entered the market
Bullish reactions were seen earlier
The next impulsive leg may start once price enters this volume burst zone
This zone will be crucial for spotting bullish reversal patterns, such as:
Bullish engulfing
Pin bar / hammer
Break and retest setups
🔍 What We Need
Inside the marked demand zones, we need a positive bullish pattern to confirm buyer strength. Entering without confirmation may be risky due to ongoing trendline resistance.
📉 Expected Price Path
The projected price movement shows:
A drop from current levels toward the MRZ
A potential short pullback
Final sweep into the Volume Burst Zone
A possible bullish reversal from that deeper area
If a strong bullish pattern forms in the green zone, buyers may push back toward the trendline and possibly attempt a breakout.
⚠️ Important Notes
Trendline remains the immediate barrier for buyers
Bearish continuation is possible until the deeper support zone is tested
Only bullish confirmation patterns can validate a reversal
✅ Short Summary (For Minds / Social Posting)
Gold is still under bearish pressure on the 30M chart, moving inside a descending trendline. Price is expected to test the Mini Reversal Zone and possibly drop deeper into the Volume Burst Demand Zone. A bullish reversal is only valid if a strong positive pattern forms in these areas.

Mastercard: Further Downside Pressure? Mastercard extended its recent bout of weakness, briefly dipping below support at $527.33 before quickly rebounding. In our primary scenario, we anticipate that the sell-off will continue along magenta wave (4), likely driving price into our green Long Target Zone between $493.51 and $453.69. Alternatively, it’s possible that the turquoise wave alt.2 has already been completed. If so, a direct breakout above $623.64 could occur, which would invalidate our Target Zone (probability: 35%).

$RDDT Long Setup - $280 Target During Q1 2026Reddit is one of those gifts that keep on giving since the IPO. Right now, support seems strong and it doesn't seem to be going away, at least from some current indicators. As always, none of this is investment or financial advice. Please do your own due diligence and research.

$TSLA: $350 Target - $380 Short (Support Breaking)The support for Tesla seems to be breaking, and the oscillators are due for a negative downtrend along with the RSI close being too high. The analysts at the same time are neutral and this has been given a buy over a strong buy target with catalysts like lower earnings in some countries and a lack of competitive advantage over BYD for actual output of vehicles produced and sold. Management is also unsure of Musk who has a huge multitrillion dollar pay package incentive which will make the company even lower on cash. Therefore, the next target for a NASDAQ:TSLA short in my opinion, is $380 or less within Q1 of 2026. As always, none of this is investment or financial advice. Please do your own due diligence and research.

Platinum has a Potential Downtrend - $1500 ShortIf support breaks, especially considering the oscillation patterns, then we could be talking about a $1500 price point per oz. As always, none of this is investment or financial advice. Please do your own due diligence and research.

Gold Continued Support Feasible - Next Target for $4500? I believe if the oscillators play out, we can have another trendline support, even with aroon down, it could be quite minimal and a retracement for $4500 support per oz is possible. Gold as an asset and commodity seems to be getting scarcer and the demand for Gold including even in electronics is something I expect will increase. As always, none of this is investment or financial advice. Please do your own due diligence and research.

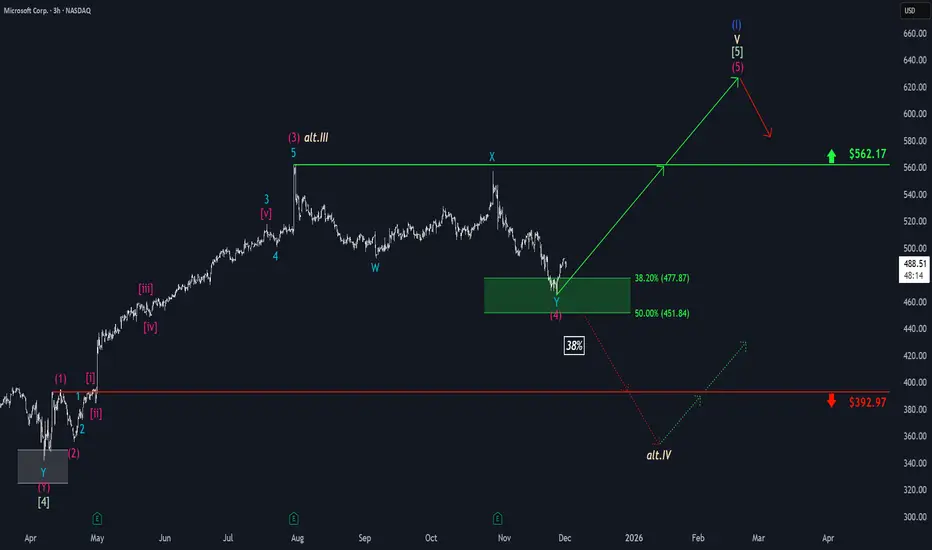
Microsoft: Target Zone Hit!Microsoft has reached our green Long Target Zone between $451.84 and $477.87 as anticipated. In the meantime, the stock has successfully completed the magenta wave (4) and has since broken out of the Target Zone to the upside. We now expect further gains as wave (5) unfolds, targeting a move above the resistance at $562.17, where the larger blue wave (I) is expected to conclude. After that, we anticipate a pronounced correction phase. However, there remains a 38% chance that MSFT could break down through the Target Zone and fall below the support at $392.97. In this case, we would reclassify the last significant high at $562.17 as the top of the beige wave alt.III and prepare for a new low in wave alt.IV .
GOLD at cut n reverse area? whats next??#GOLD - market perfectly moved as per our last idea regarding gold and now market just trade above his resistance area.
that resistance area is turned into supporting area after break above and sustain. that is 4245
keep close that area 4245 and holding of that area means we can expect further bounce otherwise not at all.
NOTE: we will go for cut n reverse below 4245 on confirmation.
good luck
trade wisely

EUR/USD Is Walking on Thin Ice📉 EUR/USD TECHNICAL ANALYSIS — RISING WEDGE LOSING MOMENTUM
1. Market Structure Overview
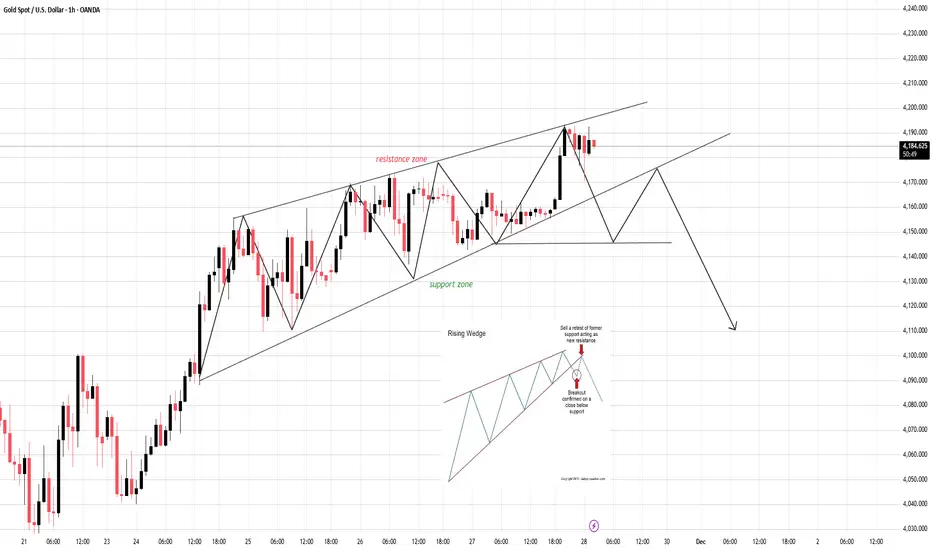
EUR/USD is moving inside a Rising Wedge, a classic bearish reversal pattern.
Key observations from current price action:
- The higher highs are becoming weaker, showing fading bullish momentum.
- The lower trendline has been tested multiple times, increasing the probability of a breakdown.
- The price is hovering near your entry zone, right at the confluence between:
✓ Rising Wedge support
✓ Micro lower-high structure
- Candles show rejection wicks on the upside, indicating pressure from sellers.
This structure suggests the market is preparing for a bearish shift.
2. Main Scenario — Breakdown is More Likely (Preferred)
If EUR/USD breaks below the Rising Wedge support with a firm candle close:
👉 Expect a sharp sell continuation toward the demand zone.
SELL confirmation checklist:
- A candle closes below the dotted support line
- Price retests that broken line and rejects → your entry zone
- A new lower high forms
When this happens, sellers will dominate the next movement.
Downside Targets
Target 1: Support zone in the green zone
Target 2: Previous swing low of the wedge
Target 3: Extended bearish continuation if momentum accelerates
3. Secondary Scenario — Weak Bounce but Still Bearish
If price bounces slightly from the wedge bottom but fails to break the upper resistance zone, then:
- Market remains weakly bullish but highly vulnerable
- Momentum will continue to compress
- Eventually, a breakdown becomes the high-probability outcome
- Buy positions are not recommended here — risk > reward
4. Intraday Bias
📌 Bias: Bearish to moderately bearish
📌 Setup: Sell the retest near the entry zone
📌 Invalidation: Clean breakout above the resistance zone
Sellers are in control as long as the price stays inside the wedge and below the resistance zone.
5. Final Verdict
EUR/USD is signaling a high-probability bearish reversal:
Rising Wedge losing power
Buyer exhaustion visible
Support line weakened
Retest zone beautifully aligned for SELL positions
👉 Expect: Breakdown → Retest → Sell-off toward major support.

Gold Is Loading Pressure — The Next Breakout Will Be Violent1. Market Structure Overview
Price is currently respecting a rising channel, showing a consistent sequence of higher highs – higher lows, but with gradually compressed momentum near the upper boundary and the resistance zone.
Key observations:
- Price is hovering near the upper trendline of the ascending channel.
- The resistance zone is directly above current price, causing hesitation and wicks.
- The chart shows a potential indecision → correction → continuation pattern forming.
This reflects a market preparing for a bullish continuation, but only after a controlled pullback.
2. Expected Scenarios for Today
✓ Primary Scenario – Bullish Retest Before Breakout (High Probability)
Price is likely to:
- Pull back toward the midline/lower edge of the ascending channel (yellow zone).
- Form a higher low within structure.
- Execute a clean retest of the ENTRY ZONE highlighted on your chart.
- Break above the Resistance Zone → Continue toward higher targets.
This matches your projected structure perfectly.
Entry Logic:
- Wait for price to retest the rising trendline and show bullish confirmation.
- The ENTRY ZONE is valid and aligns with trend continuation.
Upside Targets:
- TP1: 4,215–4,225
- TP2: 4,250+
- TP3 (extended): 4,280+ if the breakout is impulsive.
✓ Secondary Scenario – Compression Before Break
If price stays inside the channel and moves sideways:
- Market remains bullish but indecisive.
- This builds liquidity for a stronger breakout later.
- No selling is recommended unless structure breaks.
This scenario still favors bulls—just slower.
3. Trend Bias (Intraday)
The dominant trend is:
➡️ BULLISH – Buy the dip, do NOT chase breakouts
Signs confirming bullish bias:
- Higher lows remain intact.
- Structure respects the ascending channel perfectly.
- Resistance is tested multiple times → weakening.
- Volume spikes on bullish waves, fades on corrections.
4. Professional Conclusion
Gold remains in a strong bullish continuation structure inside the rising channel.
Your ENTRY ZONE is positioned perfectly for a high-quality retest trade.
Plan of Action:
- Wait for the pullback to the trendline.
- Confirm bullish rejection.
- Enter long within the zone.
- Target the liquidity sweep above resistance.
Smart, calculated, high-probability setup. 🔥

Rising Wedge on the Edge — The Breakdown Is Only One Candle AwayCURRENT MARKET ANALYSIS & TODAY’S EXPECTED MOVE
1. Current Market Structure
The market is currently respecting the structure of a Rising Wedge — a pattern where price continues rising but momentum weakens, volatility compresses, and the probability of a bearish breakdown increases.
Key observations:
- Price is moving near the upper boundary of the wedge.
- Newly formed highs lack strength → buying pressure is fading.
- Recent candles show long upper wicks, indicating strong sell pressure at resistance.
- The lower support line has been tested multiple times, increasing the likelihood of a breakdown.
- Buyers are losing control while sellers are beginning to step in.
2. Primary Scenarios for Today
✓ Scenario 1 – Breakdown of the Rising Wedge (High-probability scenario)
If a candle closes decisively below the lower support, the market is likely to:
- Drop quickly toward the next support levels.
- Trigger strong seller participation on the retest of the broken trendline (support → resistance).
- Confirm a high-quality SELL entry.
Downside Targets:
- Target 1: Nearest support zone
- Target 2: Previous low of the wedge
- Target 3: Major support below (depending on your timeframe)
✓ Scenario 2 – Price holds but remains weak
If price bounces from the lower edge but fails to break the upper boundary:
- The structure remains weakly bullish but vulnerable.
- Any upward move is fragile and easy to reverse.
- Not suitable for chasing BUY positions.
- Bulls need a strong breakout above the upper trendline to reverse the bias — which currently has a lower probability.
3. Intraday Trend Bias
Today’s intraday bias remains: DOWN (or at least corrective to the downside).
Confirmation signs:
- Support becomes easier to break the more it is tested.
- Volume is weak on bullish moves.
- Price action is tightening → preparing for a breakout.
- Sellers will wait for a clean retest, as shown in your reference chart.
4. Conclusion
The market is approaching the end-phase of a Rising Wedge, a classic bearish reversal pattern.
Priority today: Wait for breakdown → retest → SELL.
Avoid chasing BUY setups due to high reversal risk.
Expected development:
Break support → Retest → Continue dropping
“Your edge is built from discipline — not every setup must be traded, but every trade must follow your plan.”
Drop your market bias in the comments — do you expect the breakdown or a surprise breakout?
Solana: Is the Bottom In, or More Downside Ahead? SOL has already climbed more than 15% from last Friday’s low at its peak, potentially signaling the completion of wave ii in orange. For now, however, we’re still keeping open the possibility that this move could dip to a new low—within our green Target Zone ($155.80–$113.20). In any case, once this interim correction wraps up, wave iii in orange should kick off an impulsive rally, only losing steam above resistance at $295.31.

GOOGL Stock Forming a BIG Pattern — Key Levels You MUST Watch!In this video, I break down a clear chart pattern forming on GOOGL (Alphabet) stock, using detailed technical analysis.
You’ll see exactly how the pattern developed, what levels matter right now, and where the stock could move next.
🔍 What’s Covered in This Analysis:
GOOGL’s current chart structure
Clear pattern formation (triangle / channel / flag / wedge — based on your chart)
Key support & resistance zones
Breakout / breakdown levels
Trend strength and momentum
Short-term price targets
Medium-term technical outlook
Risk levels & invalidation points
📈 Why This Matters
Alphabet (GOOGL) is showing a highly tradable technical setup, and understanding this chart pattern can help you spot the next big move before it happens.
Perfect for:
Day traders
Swing traders
Long-term technical investors
Anyone following large-cap tech stocks

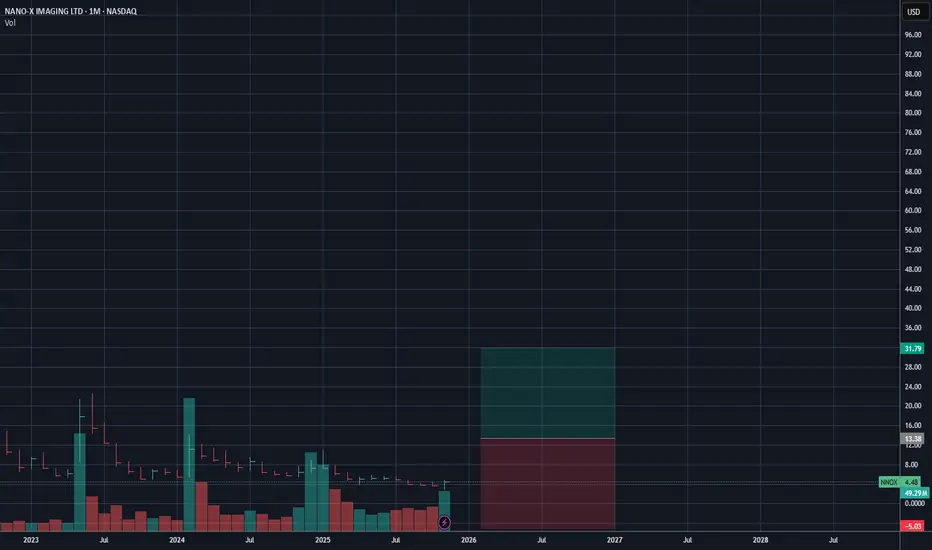
My Sentiment for $NNOX is Still LongNanox Imaging is one of those stocks I lost long term in, and kind of got attached to. However, my sentiment based on their tech and acquisitions is still long. The biggest issue is short sale volume, the need for better PR and faster project updates, the loss of their founder, and uncertainty of the future of Nanox Imaging along with the high risk in biotech. $18.41 as a target by 2027 is still feasible, however, NASDAQ:NNOX has to deliver. They have long ways to go to revamp their brand image after what happened with short sellers. As always, none of this is investment or financial advice. Please do your own due diligence and research.
USOIL at breakout level, what's next??#USOIL - market just near to his breakout level and that is 58.80
Keep close that level and sustain above means a push to higher side on the table.
Good luck
Trade wisley
