NZDJPY Break to DownsidePrice has been trading in a broader bearish context and pushing price lower. As price approached this zone, we finally saw a reaction, but the response from buyers was weak. The bounce was showing a lack of strong buying interest.
This kind of behavior usually precedes continuation, not reversal.
For any bullish case to be considered, price would need to push over the zone with strong momentum and hold above it. Until that happens, sellers remain in control and downside continuation is favored.
Chart Patterns

euraud buy signal. Don't forget about stop-loss.
Write in the comments all your questions and instruments analysis of which you want to see.
Friends, push the like button, write a comment, and share with your mates - that would be the best THANK YOU.
P.S. I personally will open entry if the price will show it according to my strategy.
Always make your analysis before a trade

Navigating the "Everything Rally": Silver super high priceNavigating the "Everything Rally": Silver, Scarcity, and the Search for Value
As of early January 2026, global financial markets are caught in a rare and powerful "Everything Rally." From technology stocks to precious metals, prices are pushing toward historic milestones, fueled by a potent mix of geopolitical shifts and an insatiable industrial appetite for raw materials. However, as silver touches record levels, investors are facing a classic dilemma: how to balance the fear of missing out with the reality of owning "non-productive" assets in a frothy market.
Silver’s Historic Surge
Silver has solidified its position as the standout performer of the new year. After a massive 150% gain in 2025, the metal recently hit a multi-decade peak near $80 per ounce. This rally is driven by a structural supply crisis—2026 marks the fifth consecutive year of global deficits—and explosive demand from the AI and green energy sectors.
Despite this momentum, silver saw a sharp 5.2% correction on January 8, as technical rebalancing and profit-taking by major funds introduced a dose of reality. This volatility highlights silver’s nature as a non-productive asset. Unlike a business that generates cash flow or pays dividends, silver's value is purely speculative, based on what the next buyer is willing to pay. For holders, it also carries a "negative yield" in the form of storage and insurance costs.
High Prices and "Irrational Exuberance"
The optimism isn't limited to metals. The S&P 500 and NASDAQ have hit new highs, and even mid-cap companies like InPost are seeing triple-digit volatility—surging over 20% this week on news of a potential €6 billion takeover by a consortium led by Advent International.
Analysts warn that the decoupling of asset prices from traditional valuations suggests a market driven by "FOMO" (Fear Of Missing Out). With silver’s market cap recently rivaling tech giants and gold trading near $4,400, the margin for error has become razor-thin.
The Pivot to Safety: Looking for Value
In a market where almost everything feels expensive, the most prudent strategy may be to look for "low-price" safe alternatives that still offer productivity:
Fixed-Income & High-Quality Bonds: With inflation stabilizing near 3%, 2-to-5-year bonds now offer a predictable yield that precious metals cannot provide.
Undervalued Value Sectors: While AI tech is priced for perfection, sectors like utilities and financials are trading at much lower multiples and offer steady dividends.
Strategic Cash Positions: In a "peak" market, holding cash in high yield money market funds provides "dry powder," allowing investors to buy the dip when the inevitable correction hits.

$NVDA — Bearish Resolution RiskBears are attempting a breakdown from this two-week compression range. After a prolonged compression, a decisive move is usually the next phase — and at the moment, it looks like bears are gaining control.
I expect NVIDIA to revisit double-digit prices this year. While the company will likely continue to beat earnings in the near term, there comes a point where earnings beats alone are no longer sufficient to sustain valuation — and I believe we’re approaching that phase now.

$AES: Powering the AI Revolution with a Cup & Handle BreakoutThe Bull Case Description
Technical Setup: The Cup and Handle Breakout AES has spent the last several months building a large, rounded "Cup" base, followed by a tight, downward-sloping "Handle" that has successfully stayed in the upper half of the pattern.
Fundamental Bull Case: The "AI Power" Catalyst
Data Center Dominance: AES is the #1 global seller of renewable energy to corporations. It currently has 8.2 GW in signed power purchase agreements (PPAs), specifically targeting the exponential power needs of AI hyperscalers.
Clean Energy Pivot: The company is on track to triple its renewables capacity by 2027 and exit the majority of its coal generation by the end of 2025. This makes it a primary beneficiary of the "Clean, Firm, and Fast" power demand shift.
Financial Stability: Despite a higher debt-to-equity ratio, AES offers a strong 4.9% dividend yield and is projected to see an 8.4% EPS increase in 2026.
Institutional Support: High-tier analysts like Argus and Morgan Stanley have recently upgraded the stock to "Buy," citing its leadership in battery storage and energy transition.
The Verdict: AES represents a rare combination of Deep Value (P/E of ~9.0) and High Growth (AI energy demand). When the technical "Handle" breaks, the institutional rotation into "Energy for AI" should provide the fuel for a multi-month rally.

$AAPL falling from the treeSimple, but effective analysis for buying call options or leaps. If you're a long term holder then skip this analysis. I'm here for the monthly income.
1. Zoom out
2. Fib it
3. Look at the volume shelf that shows where buying may begin again.
4. Review the BX Trender which indicates selling pressure on the weekly.
Charting is never an exact science, but it gives me insight on how I want to place my bets. Right now, AAPL is showing a slight pullback. Just watch the fibs and volume shelfs for this one.

Bullish set up SilverI'm currently shorting silver with TP's between 73 and 72.
I can see a few things possibly happen with XAGUSD.
Price could drop and tap into the OB or bounce back from the lower edge of the blue bar following the yellow arrow. Or price could retract first and follow the path of the red arrow.
Either way, my bias on silver is super bullish (like all the precious metals rn).
There is a high demand for silver in the world for all kinds of applications. On top of that are the uncertainties in America and China's policy towards silver supporting the bull run.

STORJ READY FOR 10X🔥 Fortune AI Radar — CRYPTOCAP:STORJ
Fresh activity detected on CRYPTOCAP:STORJ today.
Data suggests increasing market interest & buyers stepping in.
Technicals currently lean bullish, with momentum trending upward.
Whales showing hints of accumulation and hype rising among traders.
This coin is flashing strong signals on short-term charts — worth keeping an eye on 👀
Not financial advice — always research before taking decisions

PTB BOTTOMED OUT🔥 Fortune AI Radar — HOSE:PTB
Fresh activity detected on HOSE:PTB today.
Data suggests increasing market interest & buyers stepping in.
Technicals currently lean bullish, with momentum trending upward.
Whales showing hints of accumulation and hype rising among traders.
This coin is flashing strong signals on short-term charts — worth keeping an eye on 👀
Not financial advice — always research before taking decisions

FHE BOTTOMED OUT🔥 Fortune AI Radar — ASX:FHE
Fresh activity detected on ASX:FHE today.
Data suggests increasing market interest & buyers stepping in.
Technicals currently lean bullish, with momentum trending upward.
Whales showing hints of accumulation and hype rising among traders.
This coin is flashing strong signals on short-term charts — worth keeping an eye on 👀
Not financial advice — always research before taking decisions

Holding the trendlineNASDAQ:FTNT holding the trendline for quite some time, in these uncertain times. Since ATH, it's been struggling to regain momentum.

BREV WILL BE 10X SOON🔥 Fortune AI Radar — $BREV
Fresh activity detected on $BREV today.
Data suggests increasing market interest & buyers stepping in.
Technicals currently lean bullish, with momentum trending upward.
Whales showing hints of accumulation and hype rising among traders.
This coin is flashing strong signals on short-term charts — worth keeping an eye on 👀
Not financial advice — always research before taking decisions

US30 Technical Breakdown – 08/01/2026📍 US30 Technical Breakdown – 08/01/2026
US30 is pulling back after rejecting the 49,500 resistance zone, with price now rotating lower into the 48,900–48,850 area. Momentum has shifted short-term bearish as price trades below the fast EMAs, but the broader bullish structure remains intact as long as key support holds 🧭📉.
📊 Market Behavior:
🔹 Strong rejection from 49,500 → sellers defended the highs aggressively
🔹 EMAs rolling over → short-term momentum bearish
🔹 Price retracing into prior breakout zone → decision area
🔹 Buyers still active on dips, but no strong bounce yet
📌 Key Levels:
🔹 Resistance:
49,100 → intraday supply / EMA resistance
49,500 → major rejection high
50,000 → psychological level + expansion target
🔹 Support:
48,850 → immediate structure support (current zone)
48,400 → key demand / trend support
47,910 → major support from prior range
🧠 Bias:
Neutral-to-bullish while above 48,400 📈
📈 Reclaim of 49,100 → opens path back toward 49,500
📉 Breakdown below 48,850 → continuation into 48,400 → 47,910

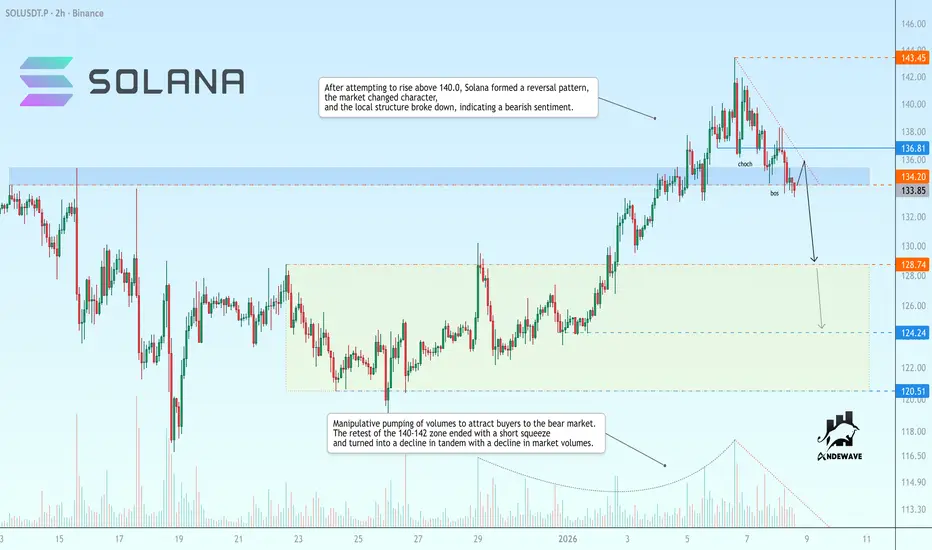
SOLUSDT is poised to break support before falling Manipulative pumping of volumes to attract buyers to the bear market. The retest of the 140-142 zone ended with a short squeeze and turned into a decline in tandem with a decline in market volumes
After attempting to rise above 140.0, Solana formed a reversal pattern, the market changed character, and the local structure broke down, indicating a bearish sentiment.
If the coin closes below 134, the market may intensify the sell-off and decline to 128.75 - 124.25
Scenario: A retest of 134.2 - 136.8 may confirm market weakness. If the price consolidates below this area, it may cause further price decline
Gold 30Min Engaged ( Bearish Volume Reversal entry Detected )⚡Base : Hanzo Trading Alpha Algorithm
The algorithm calculates volatility displacement vs liquidity recovery, identifying where probability meets imbalance.
It trades only where precision, volume, and manipulation intersect —only logic.
Technical Reasons
/ Direction — SHORT / Reversal 4450 Area
☄️Bearish rejection confirmed through sharp candle body.
☄️Lower-high forming beneath resistance supply region.
☄️Volume decreasing confirms exhaustion in price rally.
☄️Sellers regained imbalance with heavy top rejection.
☄️Algorithm detects fading demand and shift to control.
⚙️ Hanzo Alpha Trading Protocol
The Alpha Candle defines the day’s real control zone — the first battle of momentum.
From this origin, the Volume Window reveals where the next precision strike begins.
⚙️ Hanzo Volume Window / Map
Window tracked from 10:30 — mapping true market behavior.
POC alignment exposes institutional bias and breakout potential zones.
⚙️ Hanzo Delta Window / Pulse
Delta window monitors real buying vs. selling power behind each move.
Tracks volume aggression to expose who controls the candle — buyers or sellers.
When Delta aligns with Volume Map, momentum becomes undeniable.

Sys: Triple Top with Bearish Divergence Triple Top with Bearish Divergence (Strong Resistance at 173-174 level)
Sys could dip more or accumulate at current level
Trader buy only when daily candle closes above 175
Investor can accumulate slowly, 161 is the support zone
Note: "Trading involves substantial risk,
and the information presented here is for educational purposes only; it is not financial advice."

Short bias EURAUDBeen taking succesful shorts on this pair for weeks now. I believe price will retrace to 1 of the marked out zones before going lower.
1,723 would be a great TP, but I think this pair will go a lot lower.
If price manages to break below 1,70, we might see a drop to the 1,65 area.
Supported with positive swaps this pair is ideal to hold longer term.
Alerts are set, so lets wait until PA gives us more context

Potential reversal ahead?US30 showed a retracement of the former bullish impulse.
Opening today shows some bullish demand at opening bell.
One conclusion could be, that the retracement may have come to an end....

High risk/high reward potential swing playKNR had ~ $11M working capital in past financials, planning expansion/acquisitions and got beaten down badly during tax loss selling season, currently valued below $6M. There's elevated risk here but also a potential for multi-bagger trade.

Bull Thesis: The Wendy's Company (WEN) - With Extra FriesWendy's, despite recent challenges with U.S. comparable sales, is fundamentally undervalued and has a strategic plan in place to reverse the trend.
Strategic Overhaul: The company recently unveiled "Project Fresh," a comprehensive strategic plan aimed at revitalizing the brand, reigniting growth, and accelerating profitability. This initiative includes a focus on menu innovation (like the new Chicken Tenders) and operational improvements.
Deep Valuation Discount: Independent analysis suggests WEN is significantly undervalued (as much as 29%) compared to its intrinsic value, with a Discounted Cash Flow (DCF) model suggesting a fair value around $13.15 per share. Its current P/E ratio is substantially lower than its peer and industry averages, indicating the market is mispricing its durable, cash-generative franchise model.
High-Margin Franchise Model: WEN operates with a "light-asset tollbooth" model, which generates high owner earnings and free cash flow. This model shields the company from the full impact of food and labor cost inflation compared to fully company-owned chains, providing a resilient financial foundation for a long-term rally.
Trade Idea:
Initial Position $8.72 Small Buy Establishing a position near the current trading range while the stock is consolidating. This level acts as a key pivot/minor support, reflecting the recent lows.
Second Position $8.16 Add (Average Down) This level is likely a major, multi-year support zone or a key Fibonacci retracement from a prior major low. Adding here significantly improves the overall cost basis and offers a strong risk-reward ratio, as a move below $8.16 would signal a deeper structural breakdown.
Target Exit $9.65 Profit Take This is a highly achievable short-term technical resistance level that is still well below most analyst price targets (median target is around $11.25 to $12.53). Hitting this target represents a quick capture of the initial momentum and a potential test of a prior high/resistance area before Q3 earnings on November 7th.

btc on buy reverse#BTCUSD wait for H1 closure with a wick above 89372 to buy.
Buy limit 89372 on H1 closure with a wick, target 90400, SL 89k
But if H1 closes below 89200 sell will reach 88400 down.

META: The Reversal Zone | Short term Swing Long Trade PlanThe chart shows the price has fallen sharply and is currently testing a zone where three significant technical features converge:
Long-Term Trend Line (Yellow): The price has fallen back to the long-term ascending yellow trend line. This line represents the primary bullish trend established since the major low (around 2022/2023). A successful bounce here is essential for maintaining the longer-term uptrend.
Horizontal Pivot Line (Pink/White): The current price is sitting directly on the horizontal support/resistance line (pink or white line near the price). This level acted as a strong pivot point in the past, suggesting significant trading interest.
Breakout Retest (Red Line): The price is also re-testing the long-term descending red trend line from which it previously broke out. This former resistance line often turns into new support.
Conclusion: The convergence of the ascending yellow trend line, the horizontal pivot, and the retest of the old red resistance creates an extremely strong confluence support zone in the $573 to $590 region.
Trade Idea:
ENTRY $590 - $598 Enter upon confirmation of support holding (e.g., an intraday reversal candle).
TARGET 1 $652 This is the recent short-term resistance pivot shown on the chart. This is the primary target for a short-term swing trade.

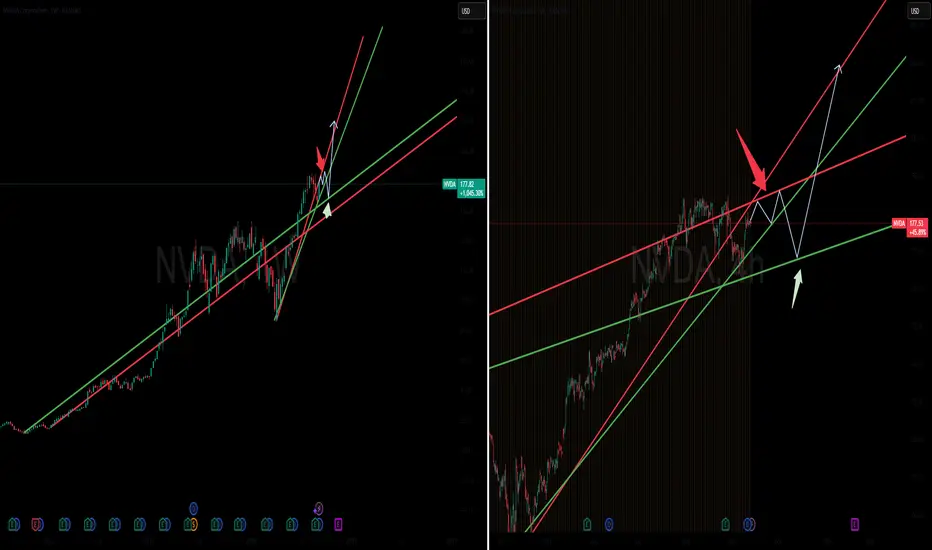
The NVDA Trade: The Tactical Case for an NVDA RetracementNVIDIA's price has been confined within a well-defined ascending channel, with its upward trajectory governed by a diagonal support trendline and its upside limited by a confluence of resistance. The stock's recent attempts to advance have been definitively rejected by this overhead resistance zone, signaling a lack of sufficient buying pressure at current price levels.
The Trading Hypothesis
The primary thesis is that the price will re-engage with and test the strength of the lower diagonal support trendline one final time. The failure to decisively break the dual overhead resistance marks a key moment, suggesting that a retracement is necessary to reset market conditions and establish a more stable foundation for a future rally.
This projected move involves a retracement back to the lower boundary of the existing channel. The price action here will be critical. Should this diagonal support fail to hold—a high-probability scenario given the recent rejections at resistance—it would trigger a breakdown of the prevailing uptrend.
This breakdown would likely initiate a more substantial corrective wave, driving the price toward the next major horizontal support level. This lower support line, identified on the chart, represents a key demand zone where new long-term buyers may step in, providing the necessary liquidity to halt the decline and potentially form a new base.
Entry Point: The Red Arrow
The red arrow on the chart signifies the optimal entry point for initiating a short position.
Exit Point: The Green Arrow
The green arrow marks the strategic exit point for the short position. This level is defined by the next major horizontal support line