GBPUSD - The hunt for liquidity before the trend continues FX:GBPUSD entered a local correction phase amid a pullback in the dollar after a strong rally. The main trend is bearish, and growth after the correction may continue.
A correction has been forming since the opening of the session. The dollar is recovering slightly, while the pound is correcting towards the daily level of 1.377 and the Fibonacci area of 0.5-0.6. If the bulls hold back the correction, the market may return to the trend.
The main/medium-term trend is bullish. The correction and false breakout of support may shift the imbalance of forces towards buyers, which could trigger growth from strong levels.
Resistance levels: 1.3831, 1.38688
Support levels: 1.377, 1.3748
A false breakdown of support and the upward trend line could trigger growth within the main trend
Best regards, R. Linda!
Chart Patterns
Eh' Manual For BernieBernie..... born Emmanuel, renamed by the mountains after he accidentally set his own boots on fire was the only creature in the high ridges who understood the Rocky Mountain Ginge’s obsession with glowing sap.
Mostly because Bernie loved fire the way poets love metaphors: recklessly, wholeheartedly, and with no regard for personal safety.
The Ginge trusted him.
Bernie trusted flames.
This was the problem.
One evening, after a long day of “goo hunting,” the Ginge proudly held out a fresh glob of Ember Sap, still pulsing with that warm, molten glow.
“Bernie like goo?” the Ginge asked, grinning.
Bernie’s eyes widened. “It’s… beautiful.”
He leaned in too close.
The sap flickered.
The glow brightened.
And then as if remembering what it once was it caught fire again.
A sudden WHOOMPH lit up the ridge.
Bernie staggered back, beard smoking, eyebrows gone, hands waving like a man trying to negotiate with physics.
“IT LIKES ME!” he shouted, thrilled and terrified.
The Ginge blinked. “Bernie spicy now.”
Snow melted in a perfect circle around them.
Bernie, still smoldering, nodded proudly. “Put that in the manual.”
“What manual?” the Ginge asked.
Bernie grinned through the soot.
“The one they’ll write about me someday.”
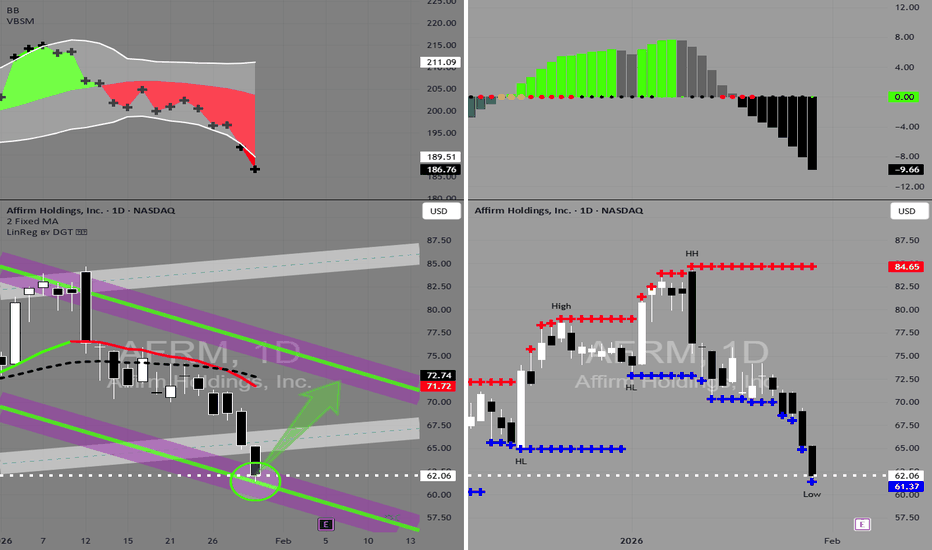
AFRM in BUY ZONEMy trading plan is very simple.
I buy or sell when at either of these events happen:
* Price tags the top or bottom of parallel channel zones
* Money flow volume spikes beyond it's Bollinger Bands
So...
Here's why I'm picking this symbol to do the thing.
Price in buying zone at bottom of channels
Money flow momentum is spiked negative and at bottom of Bollinger Band
Entry at $61.50
Target is upper channel around $70
Set your own stop.
Ripple (XRP): Sellers Are Pressuring | Getting Ready For -70%XRP seems to be getting ready for a solid short opportunity. Buyers got pushed back by the EMAs, and now we are seeing increasing pressure from sellers, which could very likely end in a breakdown.
Maybe this move plays out simply because XRP never really moves with the rest of the market, or maybe not — but from our perspective, this setup makes sense. Even if the broader market pushes higher, XRP historically tends to get sold into strength.
P.S: Red zone is DCA zone
Swallow Academy
USDJPY Under Pressure! SELL!
My dear followers,
I analysed this chart on USDJPY and concluded the following:
The market is trading on 154.22 pivot level.
Bias - Bearish
Technical Indicators: Both Super Trend & Pivot HL indicate a highly probable Bearish continuation.
Target - 153.74
Safe Stop Loss - 154.53
About Used Indicators:
A super-trend indicator is plotted on either above or below the closing price to signal a buy or sell. The indicator changes color, based on whether or not you should be buying. If the super-trend indicator moves below the closing price, the indicator turns green, and it signals an entry point or points to buy.
Disclosure: I am part of Trade Nation's Influencer program and receive a monthly fee for using their TradingView charts in my analysis.
———————————
WISH YOU ALL LUCK
Hellena | Oil (4H): SHORT to support area 62.295.Colleagues, earlier I described the upward movement as a full-fledged ABC correction, and the price justified expectations and completed the planned upward movement, but at the moment I think it is worth considering that wave A has been extended.
This fits well with both the old and new scenarios.
I expect wave “B” to begin its movement soon.
I will not set distant goals and will wait for the price to reach the first support area — the maximum of wave “3” of the middle order at 62.295.
I admit the possibility of updating the maximum of wave “A” approximately in the resistance area of 65.199.
In general, if correction “B” continues too far down, I will return to the old scenario.
Manage your capital correctly and competently! Only enter trades based on reliable patterns!
EUR/USD Daily AnalysisOn the daily timeframe, EUR/USD appears to be stabilizing after encountering resistance at the upper boundary of the price channel shown on the chart.
The pair is now attempting to break below its previous swing high — which has turned into current support — while bearish signals are emerging on lower timeframes.
Accordingly, further downside is expected, with potential targets at 1.1670, followed by 1.1300.
The bearish outlook remains valid as long as the pair continues to trade below 1.2156.
Nifty 50: Dual SMC Setups for Union Budget Special Session Market Analysis
The Nifty 50 ended January 30th at 25,315 after a volatile session that saw intraday lows of 25,213.65. We are currently coiling within a major Symmetrical Triangle. While the broad trend remains corrective, the 15-minute timeframe shows an internal ascending support (the "inner trend") near 25,350, indicating that buyers are attempting to defend higher levels ahead of the Union Budget 2026.
The Two-Scenario Strategy
Due to the high-impact nature of the Budget session on Sunday, Feb 1st, we are tracking two high-confluence zones to manage extreme volatility:
Setup 1: The FVG Fill (Primary Plan)
Logic: Price retraces to fill the 15m Fair Value Gap (FVG) and reacts off the 50% Fibonacci Discount zone, maintaining the internal ascending support.
Entry: 25,247
Stop Loss: 25,140 (Structural invalidation below the internal support and 200-DMA)
Target: 25,600 (Primary supply zone and triangle breakout target)
Risk/Reward: 1:4.6
Setup 2: The Liquidity Sweep (Contingency)
Logic: If primary support fails, we look for a "liquidity grab" or stop-hunt below the 25,140–25,150 horizontal demand zone to mitigate the Bullish Order Block (OB) near the 200-day EMA (approx. 25,184).
Entry: 25,040
Stop Loss: 24,993 (Below the major psychological floor)
Target: 25,600
Risk/Reward: 1:7.3
Conclusion
The internal structure remains bullish as long as the higher-low sequence holds. A decisive close above 25,450 will confirm the "inner trend" has won, likely leading to a fast move toward 25,600+ once policy clarity emerges post-Budget.
XAU/USD: Bearish Correction from Premium Supply ZoneGold (XAU/USD) is currently undergoing a technical pullback on the 15-minute timeframe after reaching an extreme premium valuation. Following a massive bullish expansion, the price has encountered a high-interest institutional supply zone near the 5,650 - 5,693 range. The current price action indicates a "Mean Reversion" phase as the market seeks to rebalance the recent vertical surge.
Technical Deep-Dive:
Supply Zone Interaction: The upper purple box represents a significant resistance barrier where initial selling pressure has materialized. The failure to sustain momentum above 5,650 suggests that buyers are taking profits, allowing for a corrective structure to develop.
Correction Trajectory: As illustrated by the black forecast path, the market is expected to perform a series of lower highs. The projected move focuses on a retest of intermediate liquidity before continuing its descent toward established value areas.
Key Downside Objectives:
Primary Target: 5,450 – This minor demand zone serves as the first major area of interest for a potential bounce.
Major Target: 5,378 – A deeper retracement level that aligns with the green support block, where a significant pool of buy orders is anticipated.
Risk Management: The bearish outlook for this correction remains valid as long as the price holds below the 5,693 peak. A decisive close above this supply zone would invalidate the retracement thesis and signal a continuation into uncharted territory.
Trading Strategy: This setup favors a "Sell the Retest" approach within the distribution phase. Traders should monitor for bearish confirmation—such as a rejection wick or a shift in lower-timeframe structure—before targeting the expansion toward the identified support zones below.
GBPJPY is showing clear strong bullish trend bullish viewGBPJPY – 4H Timeframe | Bullish Trend 📈
GBPJPY is showing a clear bullish trend, with price approaching a key support zone, offering a potential buying opportunity 🔍
🔹 Buy Zone:
• 211.700 – Key support area & bullish reaction zone ✅
🎯 Technical Target:
• 214.200 – Supply zone
Bullish bias remains valid as long as price holds above support. Wait for confirmation before entry and stay disciplined.
⚠️ Use proper risk management
This is not financial advice. Always protect your capital.
👍 Like | 💬 Comment | 🔁 Share | ➕ Follow for more trading insights
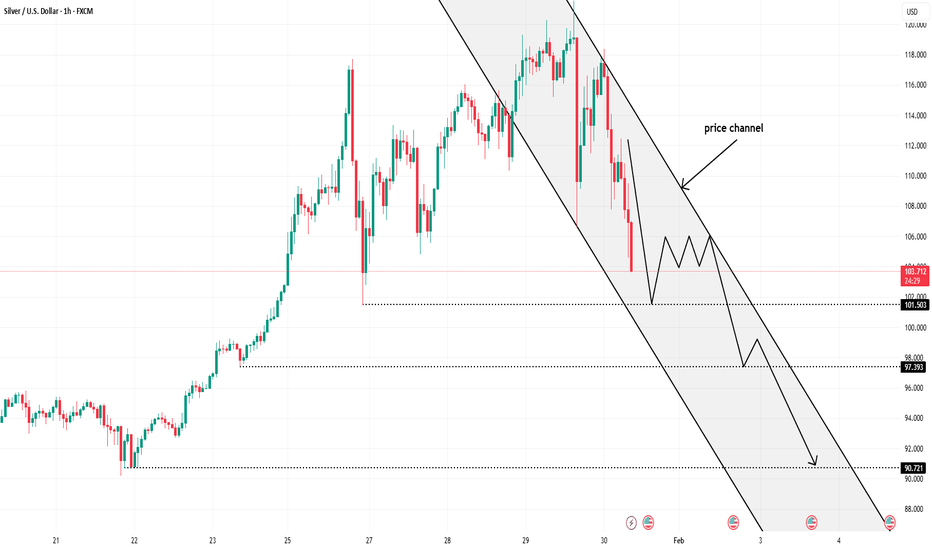
Silver Has Broken Structure — The Channel Now Defines DownsideSilver has clearly transitioned from an impulsive uptrend into a bearish price channel, and the latest sell-off confirms that this is no longer a healthy pullback. After failing to hold the previous highs, price broke structure decisively and began printing lower highs and lower lows, signaling a shift in short-term market control from buyers to sellers. The descending channel now acts as the primary framework. Every rebound inside this structure has been corrective and capped by channel resistance, which is classic sell-the-rally behavior. The sharp bearish candles show initiative selling, not just profit-taking, suggesting that supply is active and confident. As long as price remains below the channel midline and upper boundary, upside attempts are likely to be faded. From a supplydemand perspective, the failed rebound zones above are acting as overhead supply, while price is gravitating toward lower liquidity pools. The next key downside magnets sit around the 102.00 area first, followed by the deeper support near 97.30, and ultimately the larger liquidity pocket closer to 90.70 if momentum accelerates.
Macro:
Silver is highly sensitive to USD strength, real yields, and risk sentiment. Any stabilization in the U.S. dollar or easing of safe-haven demand typically pressures silver more aggressively than gold. This macro backdrop aligns with the current technical picture of distribution turning into markdown rather than a pause before continuation higher.
Silver is no longer in accumulation or trend continuation mode. It is now respecting a bearish channel, and until price reclaims the channel and breaks structure back to the upside, the path of least resistance remains down, with rallies serving as opportunities for sellers, not confirmation for longs.
Sell CHF/JPY at right shoulder of H&S patternI believe all the JPY crosses could be at an important reflection point and therefore I am looking to buy the JPY. There is a possible Head & Shoulders pattern forming on this pair with profit at the neckline incase the pattern doesn't complete.
Sell Limit : 200.30 right shoulder
Stop : 201.59 above head of H&S
Profit : 196.75 before neck line of H&S
Risk 1 : 2.75 / stop is 129 pips
Is Bitcoin Going to $65K?, Why Bearish Structure is Strong Bitcoin price action remains in a corrective phase, with price now trading below several key support levels on the lower time frames. As price approaches major decision zones, the focus shifts to the weekly timeframe, where higher-time-frame structure provides clearer context for direction.
On the weekly chart, Bitcoin has shown a clear rejection from the midpoint of the larger trading range. This midpoint has acted as a strong pivot historically, and failure to reclaim it suggests that recent upside moves were corrective rather than trend-defining. As long as price continues to trade below this level, downside risk remains elevated.
From a market structure perspective, Bitcoin is still operating within a macro lower-low environment, keeping the broader trend bearish. This structural weakness increases the probability that the current correction has further to run rather than resolving into immediate continuation higher.
If bearish conditions persist, the next major area of interest sits below $70,000, with the $65,000 region standing out as a key high-time-frame support zone. This level represents a potential tracking pivot where price may attempt to stabilize or form a longer-term base.
Until Bitcoin can reclaim the weekly range midpoint and invalidate the lower-low structure, the path of least resistance continues to point lower, keeping $65,000 in focus.
Silver Is Rolling Over Inside a Descending ChannelSilver has completed a clean trend transition. After a strong, well-respected ascending channel (green), price failed to sustain upside momentum and printed multiple rejection wicks at the channel top, signaling buyer exhaustion. That failure marked the start of a trend rotation, not just a pullback.
Technically, price has now broken down into a descending channel (gray), with structure flipping from higher highs to lower highs and lower lows. The orange and green moving averages have rolled over, and price is trading below dynamic resistance, confirming bearish control in the short term. Each bounce has been corrective and capped near the mid-channel — classic sell-the-rally behavior, not accumulation.
From a supply–demand perspective, the circled highs represent a distribution zone where smart money sold into late buyers. The sharp impulsive drops that followed show initiative selling, not profit-taking. As long as price remains below the descending channel resistance, rallies are likely to be faded, with downside continuation toward the lower channel boundary.
Precious metals are sensitive to real yields and USD strength. Any stabilization or rebound in the U.S. dollar, or easing of safe-haven urgency, typically pressures silver harder than gold due to its higher volatility and industrial exposure. This macro backdrop supports the current corrective-to-bearish phase rather than a fresh bullish expansion.
Silver is no longer trending up it is rotating lower inside a bearish channel. Until price reclaims the channel and holds above moving averages, the path of least resistance remains down, with bounces serving as liquidity for sellers, not signals of a new uptrend.
Bitcoin Down to 60's, 50's in 2026October should be the bottom based on cycles.
ATL 2015 to ATH 2017 = 1064d
ATH 2017 to ATL 2018 = 364d
ATL 2018 to ATH 2021 = 1064d
ATH 2021 to ATL 2022 = 364d
The pattern would print this cycle's ATH on the 6th of October 2025.
We indeed saw the top on October 2025. 364 days takes us to early October low.
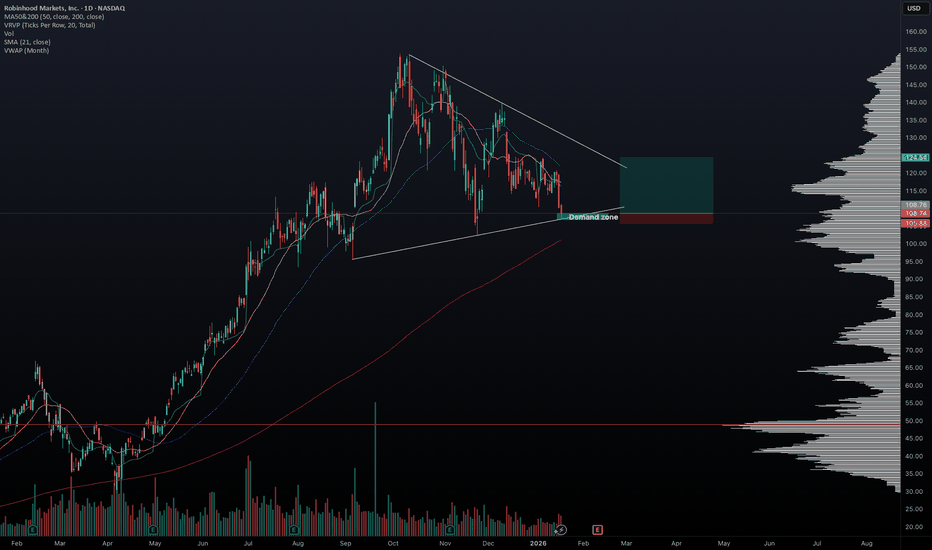
01/18/2026 HOOD longHello traders,
I’m seeing many S&P stocks forming wedge patterns (QQQ is also forming a wedge), and HOOD is one of them. While the exact catalyst for the next market move is unclear, it appears something is cooking, and a directional move may be approaching. HOOD is currently sitting near the lower boundary of its wedge and could bounce toward the upper range. Let’s stay disciplined and trade cautiously in this choppy market.
May the trend be with you.
AP


