ETHUSD – 30M Triangle Pattern AnalysisETHUSD – 30M Triangle Pattern Analysis
Ethereum is forming a symmetrical triangle pattern, created by higher lows and lower highs, showing price compression after a strong bullish move. This pattern usually reflects indecision before expansion.
🔺 Pattern Structure (Reason)
The ascending trendline shows buyers stepping in higher on each pullback.
The descending trendline shows sellers defending lower highs.
Price volatility is decreasing, indicating energy building for a breakout.
The pattern formed after an uptrend, giving it a slight bullish continuation bias, though confirmation is required.
📈 EMA & Price Action Context
EMA 9 & EMA 21 are closely aligned, reflecting short-term balance.
EMA 50 (~3,242) is acting as a dynamic mid-support inside the structure.
Price is currently trading near the middle of the triangle, where noise is common.
🎯 Targeted Price Levels (Measured Move)
Upper Breakout Scenario:
Break and acceptance above ~3,260–3,280
Upside Target: ~3,380 – 3,420 (measured from triangle height)
Lower Breakdown Scenario:
Break and acceptance below ~3,200
Downside Target: ~3,080 – 3,100
(Targets are projections, not guarantees.)
🔎 Key Trading Logic
Avoid bias inside the triangle; confirmation comes after breakout.
Expansion is expected once price exits the structure with acceptance.
False breakouts are possible near the apex, so structure confirmation is important.
Chartpattren

XAUUSD – Head & Shoulders Breakdown Analysis (30-min)XAUUSD – Head & Shoulders Breakdown Analysis (30-min)
The chart shows a classic Head and Shoulders (H&S) reversal pattern, signaling weakening bullish momentum and a potential bearish continuation.
Pattern Structure
Left Shoulder: Price rallies and pulls back, forming the first peak.
Head: A higher high follows, marking the strongest bullish push.
Right Shoulder: A lower high forms, showing buyers are losing strength.
Neckline: A key horizontal support zone around 4,440–4,445, highlighted by multiple price reactions.
Confirmation Signals
Price is trading below short-term EMAs (9 & 7) and struggling near EMA 21, indicating short-term bearish pressure.
The right shoulder failed to reach the height of the head, confirming momentum divergence.
Volume has generally decreased on the right shoulder, which is typical before a breakdown.
A clean break and hold below the neckline would confirm the pattern.
Target Calculation
Measured move method:
Distance from Head → Neckline projected downward from the neckline.
This gives a downside objective near 4,380.
Bias & Invalidation
Bearish bias remains valid while price stays below the right-shoulder trendline and neckline.
Invalidation: A strong breakout and close above the right shoulder / ~4,480–4,490 would weaken the bearish setup.
Summary
Pattern: Head & Shoulders (Bearish Reversal)
Key support (neckline): ~4,440
Breakdown target: ~4,380
Risk note: Wait for a confirmed neckline break to avoid false moves.
This setup reflects trend exhaustion after a strong rally, favoring sellers unless bulls reclaim key resistance.

Rising Wedge Signals Sell from HighGold (XAUUSD) – H1 Complete Analysis (Rising Wedge + RSI + Volume)
On the H1 timeframe, Gold is showing signs of a distribution phase. During the recent session, price has formed a Rising Wedge pattern, which is considered a bearish reversal or bearish continuation pattern, especially when it appears near the end of a move.
The Rising Wedge structure is clearly visible, where price is making higher highs and higher lows, but both trendlines are gradually converging. This indicates that although price is moving higher, buying strength is weakening. In many cases, the market uses this structure to collect liquidity at higher levels before breaking down to the downside.
The RSI analysis further confirms this weakness. RSI is trading around the 57–60 zone, close to overbought territory, but it is not showing strong bullish continuation. While price continues to move higher, RSI is failing to follow with the same strength, sign ling loss of momentum and increasing the probability of a bearish move. This behavior is commonly seen in sell-from-high setups.
Volume behavior provides an important confirmation. As price moved higher within the rising wedge, volume gradually declined, which suggests that smart money is not aggressively buying at higher levels but is instead distributing positions. In such conditions, once the lower support of the wedge is broken, a strong bearish move accompanied by a volume spike is often seen.
When all three factors are combined Rising Wedge (bearish pattern), weak RSI momentum, and declining volume the sell-from-high bias on Gold H1 becomes stronger.
Trade Idea:
The preferred approach is to look for sell opportunities near the upper boundary of the wedge or recent highs, but only after proper confirmation, such as a bearish candle close or a clear break below wedge support.
Targets: TP1: Midpoint of the wedge
Main Target: 4300 zone (next liquidity)
Stop Loss:
Above the recent high or above the wedge structure (tight risk management)

DXY Analysis – Rectangle Range PatternDXY
Analysis – Rectangle Range Pattern
The chart shows the US Dollar Index (DXY) moving inside a clear rectangle range, where price is repeatedly bouncing between support and resistance. This signals a consolidation phase before a bigger breakout move.
🟩 Rectangle Zone
Resistance Zone: around 98.63 – 98.70
Support Zone: around 98.47 – 98.50
Multiple rejections at both ends confirm a valid range.
Price is currently sitting near support, with EMAs (7/21/50) sloping downward, showing short-term bearish pressure.
📉 Short Setup (Bearish Scenario)
A short setup activates only if price breaks below the rectangle support with solid volume.
🔻 Short Entry
Sell below: 98.45 (clean break & candle close)
🎯 Targets
TP1: 98.30
TP2: 98.18
TP3: 98.05
🛑 Stop-Loss
SL above broken support: 98.55
Reasoning:
Price is at the bottom of the rectangle. A break below this level signals continuation of the downtrend, supported by bearish EMA alignment.
📈 Long Setup (Bullish Scenario)
A long setup activates only if the price breaks above the rectangle resistance.
🔺 Long Entry
Buy above: 98.72 (strong breakout + retest is safer)
🎯 Targets
TP1: 98.85
TP2: 98.95
TP3: 99.10
🛑 Stop-Loss
SL below the breakout zone: 98.60
Reasoning:
A breakout above the range + EMA crossover would shift momentum bullish after long consolidation.
📌 Summary
Market is in a sideways rectangle pattern.
No breakout yet — wait for direction confirmation.
Break below = short continuation.
Break above = long reversal attempt.

ETH 15m Analysis – Symmetrical TriangleETH 15m Analysis – Symmetrical Triangle
Price is consolidating inside a symmetrical triangle, showing lower highs and higher lows. This pattern usually leads to a directional breakout, and the breakout decides the next move.
EMAs (7/21/50) are close together, showing momentum compression before expansion.
✅ 📈 Long Setup (Bullish Breakout)
A long setup becomes valid if price breaks above the triangle resistance with a candle close.
🔺 Long Entry
Buy above: 3208–3210
🎯 Targets
TP1: 3225
TP2: 3240
TP3: 3260
🛑 Stop-Loss
SL below breakout: 3192
Reasoning:
A breakout above the triangle indicates renewed bullish momentum with EMAs supporting an upward push.
✅ 📉 Short Setup (Bearish Breakdown)
A short setup becomes valid if price breaks below triangle support.
🔻 Sell Entry
Sell below: 3180–3178
🎯 Targets
TP1: 3160
TP2: 3145
TP3: 3125
🛑 Stop-Loss
SL above broken support: 3195
Reasoning:
A break below the lower trendline signals sellers taking control, likely pulling price back toward EMA50 or lower.
📌 Summary
ETH is squeezing inside a symmetrical triangle.
Volume contraction confirms the compression phase.
Break above = bullish continuation.
Break below = bearish correction.

BTCUSD – Observing a Bullish Flag Structure on the 4H ChartBitcoin’s 4-hour chart is showing a period of consolidation following a strong upward movement. The recent rally created a steep impulse leg, and price is now moving within a compact range that resembles a bullish flag–type structure. This type of structure often appears when the market is taking a pause after increased momentum.
Several moving averages (EMA 7/21/50) are positioned below the current price, indicating that short-term trend conditions continue to lean on the supportive side. Price is holding above these EMAs while staying inside the consolidation zone.
If price continues to maintain support near this range, traders will often watch for a potential continuation scenario. On the other hand, if the market slips below the lower boundary, it may signal that the consolidation phase is extending or losing momentum.
This idea focuses on illustrating the pattern and highlighting how price is interacting with the EMAs, without suggesting any specific trading action.

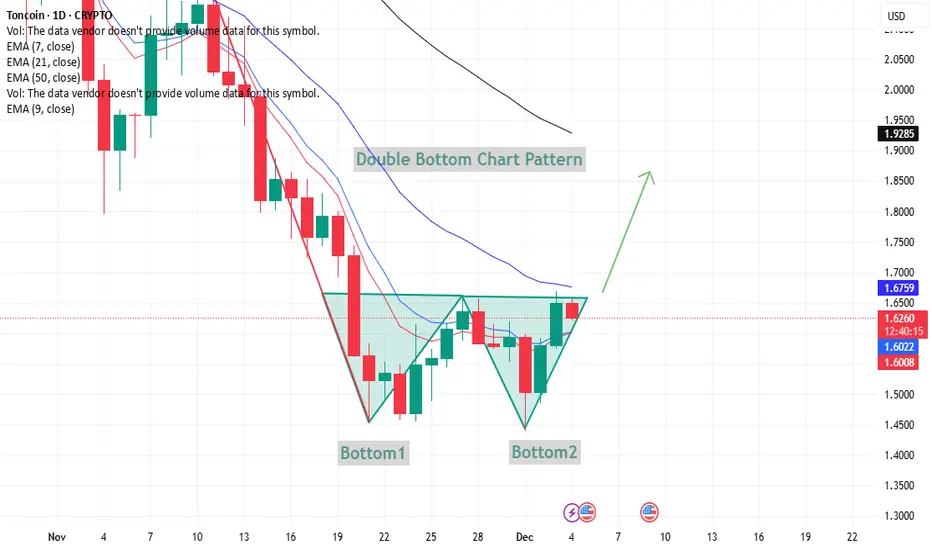
TONUSD – Double Bottom Formation TONUSD – Double Bottom Formation (Neutral Technical View)
The chart shows a double bottom structure, where price formed two lows (Bottom 1 and Bottom 2) near the same zone. This is generally watched as a potential reversal signal when price moves back toward the neckline.
Key observations:
Bottom 1 and Bottom 2 highlight buyers defending the same support area.
Price is now approaching the neckline zone around 1.65–1.67, which is an important technical barrier.
If candles can hold above the short-term EMAs (9 and 21), it strengthens the idea of momentum shifting upward.
A close above the neckline would indicate continuation toward higher resistance levels, while rejection could keep the pair in consolidation.
Bullish Channel Breakdown Signals Bearish ContinuationThis is a 3-hour XAUUSD (Gold vs US Dollar) chart from TradingView showing a clear trend transition:
Strong bullish trend earlier, guided by a rising ascending channel.
Price respected the upper and lower channel boundaries while making higher highs.
A sharp bearish breakdown occurred, with price decisively falling below the trend channel — signaling a potential trend reversal.
After the breakdown, price attempted a weak pullback but failed to reclaim the channel.
Two key downside targets are marked:
1st Target: ~4,255
2nd Target: ~4,170
The blue dynamic bands (volatility / Donchian-style channel) show expansion followed by contraction, supporting increased downside momentum.
The projected arrows suggest continued bearish pressure into early 2026 if support levels fail.
Overall, the chart highlights a shift from bullish structure to bearish continuation, with clearly defined downside objectives.

XAUUSD H4 Buy Limit | Trend Continuation Setup📊 XAUUSD Technical Analysis (H4)
Price is moving within an ascending structure and continues to respect the bullish trendline.
After a healthy pullback into the demand zone, a continuation to the upside is expected.
🔹 Entry Zone: Buy Limit at 4258 – 4216
❌ Stop Loss: Two H4 candle closes below 4196
✅ Target: 4353
📌 Once the buy limit is activated, partial risk management will be applied.
After price reaches 4290, the position will be secured by moving to break-even (risk-free).
⚠️ Always manage your risk properly.
Wishing you success and victory,🧿❤️✌️
FXG Team Management” 🏅

USD/JPY)Bullish trend analysis Read The captionSMC Trading point update
Technical analysis of USDJPY – 4H chart using SMC + Fibonacci OTE + EMA support.
⸻
Market Context (4H)
• Primary bias: Bullish continuation
• Higher-timeframe structure remains bullish
• Price is holding above EMA 200, confirming HTF trend
• Recent drop is a corrective pullback, not a reversal
⸻
Structure & Price Behavior
• Price made an impulsive move up → now correcting
• Pullback is moving into a discount zone
• Market is aligning with OTE (Optimal Trade Entry) levels
• EMA 200 + EMA 50 are acting as dynamic support
This is a textbook pullback → continuation setup.
⸻
Key Buy Zone (OTE + HTF Demand)
~155.40 – 155.70
Why this zone matters:
• Fibonacci OTE (0.705 – 0.79)
• HTF demand zone
• EMA 200 confluence
• Prior structure support
• Marked reaction area (green arrow)
This is where smart money typically reloads longs.
⸻
Trade Idea (Primary Scenario)
BUY Setup
• Entry: 155.40 – 155.70
• Stop Loss: Below 155.00
• Targets:
• TP1: 156.50
• TP2: 157.20
• Final TP: 157.75 (marked target point / liquidity above highs)
Risk–Reward: ~1:3+
⸻
Confirmation Checklist
Wait for confirmation inside the zone:
• Bullish engulfing candle
• Strong rejection wicks
• Lower-TF CHoCH
• No acceptance below EMA 200
⸻
Invalidation
• 4H close below ~155.00
• Acceptance below HTF demand + EMA 200
If invalidated → expect deeper correction toward lower support.
⸻ Mr SMC Trading point
Summary
This setup shows a high-probability bullish continuation
• Trend intact
• Pullback into discount
• OTE + EMA + demand confluence
• Clear upside liquidity target
Please support boost this analysis

EUR/USD) Bullish trend analysis Read The captionSMC Trading point update
Technical analysis of EURUSD – 4H chart, aligned with SMC + structure + EMA support.
⸻
Market Context (4H)
• Primary bias: Bullish continuation
• Higher-timeframe structure remains higher highs & higher lows
• Price is trading above EMA 200, confirming bullish HTF bias
• Current move is a healthy correction, not trend reversal
⸻
What Price Is Doing
• Price is consolidating inside a descending corrective channel
• The pullback has reached a discount area
• Price tapped a bullish order block (OB) + EMA support
• This is typical re-accumulation before continuation
⸻
Key Zones
HTF Demand / Order Block
~1.1720 – 1.1740
• Marked OB zone
• Confluence with EMA 50 & EMA 200
• Previous resistance → support flip
• Strong reaction zone (green arrow)
Invalidation Zone
~1.1680
• Acceptance below this level weakens bullish structure
⸻
Trade Idea (Primary Scenario)
BUY Setup (Continuation Play)
• Entry: 1.1720 – 1.1740
• Stop Loss: Below 1.1680
• Targets:
• TP1: 1.1780
• TP2: 1.1820
• Final TP: 1.1867 (HTF target / liquidity above highs)
Risk–Reward: ~1:3+
⸻
Confirmation Checklist
Look for:
• Bullish engulfing or strong rejection from OB
• Lower-TF CHoCH
• Failure to close below demand
• Momentum expansion to the upside
⸻
Invalidation
• 4H close below 1.1680
• Acceptance below HTF demand + EMA 200
If invalidated → expect deeper pullback toward lower demand.
⸻ Mr SMC Trading point
Summary
This setup represents a classic bullish continuation:
• Trend intact
• Correction into discount
• OB + EMA confluence
• Clear upside liquidity target
Please support boost this analysis

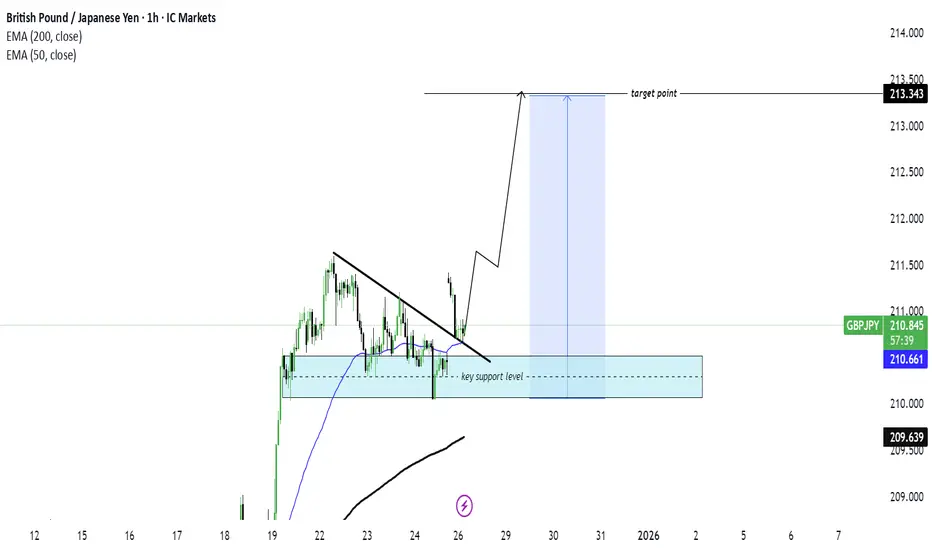
GBP/JPY) Bullish trend analysis Read The captionSMC Trading point update
Technical analysis of GBPJPY – 1H chart using SMC + structure break + support flip.
⸻
Market Context
• Bias: Bullish continuation
• Strong impulsive move up → market entered consolidation
• Structure shows accumulation above key support
• EMA alignment:
• EMA 50 above EMA 200
• EMA 50 acting as dynamic support
⸻
What the Market Did
• After the impulsive rally, price formed a descending corrective structure
• That structure was broken to the upside → bullish BOS
• Price is now holding above a key support zone (blue area)
This signals re-accumulation, not distribution.
⸻
Key Support / Demand Zone (Blue Area)
~210.20 – 210.60
Why this zone matters:
• Previous resistance → support flip
• Multiple reactions (acceptance)
• EMA 50 sitting inside the zone
• Liquidity sweep below support → quick recovery
This is where buyers are defending positions.
⸻
Trade Idea (Continuation Long)
Buy on pullback or buy on confirmation
• Entry: 210.30 – 210.60
• Stop Loss: Below support (~209.90)
• Targets:
• TP1: 211.50 (recent high)
• TP2: 212.60
• Final TP: 213.30 – 213.50 (marked target point / liquidity above highs)
Risk–Reward: ~1:3+
⸻
Confirmation Triggers
Best confirmations:
• Bullish engulfing candle from support
• Strong rejection wick (liquidity grab)
• Lower-TF CHoCH
• Momentum expansion after pullback
⸻
Invalidation
• 1H close below ~209.90
• Acceptance below EMA 50 + support zone
If this happens → bullish continuation idea is invalid, and price may rotate deeper.
⸻ Mr SMC Trading point
Summary
This setup is a classic bullish continuation after consolidation:
• Trend intact
• Structure break
• Support flip + EMA confluence ✔
Please support boost this analysis
BTC/ISD)Bullish trend analysis Read The captionSMC Trading point update
Technical analysis of BTCUSDT – 1H chart using SMC + Fibonacci OTE + EMA confluence.
⸻
Market Context
• Bias: Bullish continuation
• Clear impulsive bullish displacement broke previous structure
• Price is holding above EMA 50 & EMA 200
• Current move down is a controlled pullback, not a reversal
⸻
What the Market Is Doing
• After the impulse, price retraced to rebalance inefficiency
• Pullback is occurring into discount within an uptrend
• Structure remains intact → buyers still in control
⸻
Key Buy Zone (Blue Area)
~87,600 – 88,050
This zone is high-probability because of:
• Fib OTE zone (0.705 – 0.79)
• SMC demand / order block
• EMA 50 support (~87,983)
• Prior consolidation before impulse
• Long lower wicks → sell-side liquidity taken
This is where smart money typically reloads longs.
⸻
Fibonacci Logic
Measured from the impulse low → high:
• 0.5 / 0.62 = shallow retracement
• 0.705 – 0.79 = optimal trade entr
Ideal location for trend continuation setups
⸻
Trade Idea (Continuation Long)
Buy on confirmation inside demand
• Entry: 87,650 – 88,050
• Stop Loss: Below demand (~87,100)
• Targets:
• TP1: 88,900 (recent high)
• TP2: 89,600
• Final TP: 90,360 (marked target point / liquidity above highs)
Risk–Reward: ~1:3 to 1:4
⸻
Confirmation Triggers (Important)
Only enter if you see:
• Bullish engulfing or strong rejection wick
• Lower-timeframe CHoCH
• Failure to accept below the OTE zone
• Momentum expansion after tapping demand
⸻
Invalidation
• 1H close below ~87,100
• Acceptance below EMA 50 + demand
If this happens → bullish idea is invalid, and price may seek deeper liquidity.
⸻ Mr SMC Trading point
Summary
This is a textbook bullish continuation setup:
• Strong impulse
• OTE + demand + EMA confluence
• Clear upside liquidity target
Please support boost this analysis

XAU/USD)Bullish trend analysis Read The captionSMC Trading point update
Technical analysis of XAUUSD (Gold) – 4H chart using SMC + EMA + HTF support logic.
⸻
Market Context (4H)
• Primary bias: Bullish continuation (after correction)
• Strong impulsive sell-off was corrective, not a trend change
• Overall higher-timeframe structure is still bullish
• Price is now reacting from a key HTF support zone
⸻
What Just Happened
• Price swept sell-side liquidity aggressively
• Immediate rejection from lows → strong bullish reaction
• This indicates smart-money absorption at discount
• Market is now in a recovery / rebalancing phase
⸻
Key Levels on Chart
HTF Demand / Strong Support Zone
~4,285 – 4,325
• Labeled as key strong support level
• Previous consolidation base
• Where institutions previously accumulated
• Area of highest-probability defense
FVG / Re-entry Zone
~4,345 – 4,365
• Inefficiency left by impulsive drop
• Ideal pullback / continuation zone
• Price already reacting here (green arrow)
⸻
Trade Idea (Primary Scenario)
BUY Setup (Continuation Play)
• Entry: 4,345 – 4,365
• Stop Loss: Below 4,285
• Targets:
• TP1: 4,403 (EMA 50 / mid-structure)
• TP2: 4,480
• Final TP: 4,520 (marked target point / liquidity above highs)
RR potential: ~1:3+
⸻
Confirmation Checklist
Before committing size, look for:
• Bullish engulfing from FVG
• Strong rejection wicks
• Lower-timeframe CHoCH
• Price holding above the strong support zone
⸻
Invalidation
• 4H close below ~4,285
• Acceptance below HTF demand
If that happens → bullish continuation is invalid, and deeper downside is possible.
⸻ Mr SMC Trading point
Summary
This setup shows classic HTF liquidity grab → reaction → continuation:
• Sell-side liquidity taken
• Strong HTF demand respected
• FVG acting as re-entry
• Clear upside liquidity target
Please support boost this analysis

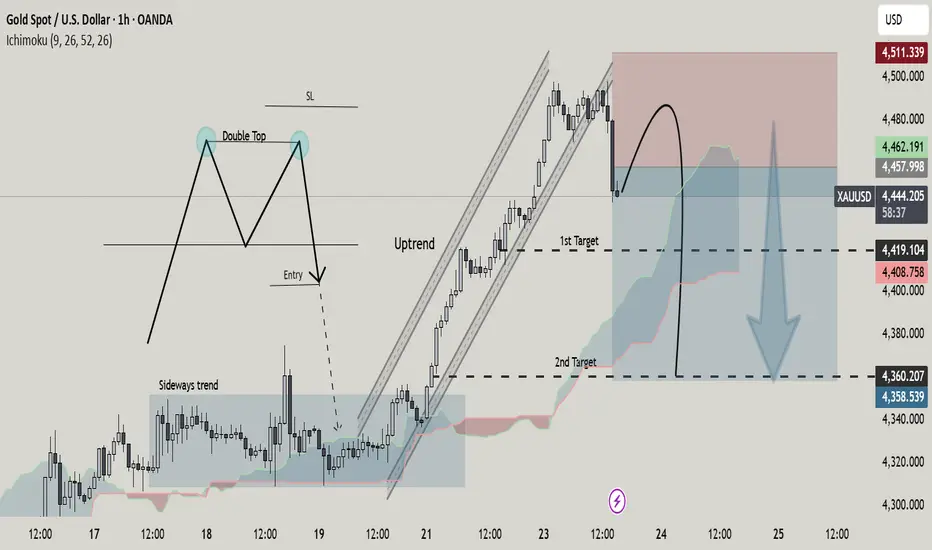
Double Top Reversal Signals End of Bullish MomentumPrice was in a strong bullish channel (uptrend), making higher highs and higher lows. A Double Top formed near the highs, signaling buyer exhaustion and a potential trend reversal.Price failed to hold above resistance and showed rejection near the top, aligning with the Ichimoku resistance / cloud reaction. After the double top, momentum weakens → bearish pullback / correction expected. 1st Target: Prior structure support (mid-range level)
2nd Target: Deeper support aligned with Ichimoku cloud base Invalidation is above the double-top highs (SL zone).
Below that, sellers remain in control.
Overall:
This chart illustrates a classic trend exhaustion → reversal setup, ideal for traders watching price action + Ichimoku confluence.
EUR/USD) Bullish trend analysis Read The captionSMC Trading point update
Technical analysis of EURUSD – 2H chart using SMC + Fibonacci OTE + EMA trend continuation.
⸻
Market Context
• Bias: Bullish continuation
• Overall structure shows higher highs & higher lows
• Strong impulsive move followed by healthy corrective channels
• Price is holding above EMA 200, confirming HTF bullish bias
• EMA 50 is acting as dynamic intraday support
⸻
What Price Is Doing
• After a strong bullish displacement, price entered a descending corrective channel
• That channel has now broken to the upside (bullish BOS)
• Current pullback is a retest / re-accumulation, not weakness
This is classic trend → correction → continuation behavior.
⸻
Key Buy Zone (Blue Area)
~1.1735 – 1.1750
Why this zone is high-probability:
• SMC demand / order block
• Fib OTE zone (0.705 – 0.79)
• EMA 50 + EMA 200 confluence
• Previous resistance → support flip
• Multiple reactions already marked (green arrows)
This zone represents institutional rebalance, not retail buying.
⸻
Fibonacci Logic
Measured from the latest impulse low → swing high:
• 0.5 / 0.62 = shallow pullback
• 0.705 – 0.79 = optimal trade entry (OTE)
Textbook continuation location in a bullish market
⸻
Trade Idea (Continuation Long)
Buy on confirmation inside demand
• Entry: 1.1735 – 1.1750
• Stop Loss: Below demand (~1.1710)
• Targets:
• TP1: 1.1780 (recent high)
• TP2: 1.1820
• Final TP: 1.1880 – 1.1890 (marked target point / liquidity above highs)
Risk–Reward: ~1:3+
⸻
Confirmation Triggers (Important)
Only take the trade if you see:
• Bullish engulfing or strong rejection wick from the zone
• Lower-timeframe CHoCH
• Failure to accept below the OTE zone
• Momentum expansion after tapping demand
⸻
Invalidation
• 2H close below ~1.1710
• Acceptance below EMA 200 + demand zone
If this occurs → bullish continuation idea is invalid, and price may rotate deeper.
⸻ Mr SMC Trading point
Summary
This setup is a textbook bullish continuation:
• Trend intact
• Corrective structure resolved
• OTE + demand + EMA confluence
• Clear upside liquidity target
Key edge: wait for price to confirm buyers inside discount — don’t chase the highs.
Please support boost this analysis

EUR/USD)Bullish trend analysis Read The captionSMC Trading point update
Technical analysis of EURUSD – 1H chart using SMC + Fibonacci OTE + EMA confluence.
⸻
Market Context
• Bias: Bullish continuation
• Overall structure remains higher highs & higher lows
• Price is still above the EMA 200, keeping the higher-timeframe bullish bias intact
• The recent downside move is a corrective pullback, not a reversal
⸻
Why Price Is Pulling Back
• After the impulsive rally, price tapped short-term resistance (0 level)
• Profit-taking caused a retracement into discount
• Pullback is orderly and aligned with trend structure
⸻
Key Buy Zone (Blue Area)
~1.1728 – 1.1742
This zone is high-probability due to strong confluence:
• SMC demand / order block
• Fib OTE zone (0.705 – 0.79)
• EMA 200 support
• Rising internal trendline
• Marked buyer reaction (green arrow)
This area is where institutions typically rebalance long positions.
⸻
Fibonacci Logic
Measured from the latest impulse low → high:
• 0.5 / 0.62 = shallow retracement
• 0.705 – 0.79 = optimal trade entry (OTE)
Ideal location for trend continuation longs
⸻
Trade Idea (Continuation Long)
Buy on confirmation inside demand
• Entry: 1.1730 – 1.1740
• Stop Loss: Below demand (~1.1705)
• Targets:
• TP1: 1.1779 (EMA 50 / mid-range)
• TP2: 1.1800
• Final TP: 1.1820 (marked target point / liquidity above highs)
Risk–Reward: ~1:3+
⸻
Confirmation Triggers (Very Important)
Only take the trade if you see:
• Bullish engulfing or strong rejection wick
• Lower-timeframe CHoCH
• Failure to accept below the OTE zone
• Momentum expansion after tapping demand
⸻
Invalidation
• 1H close below ~1.1705
• Acceptance below EMA 200 + demand
If this happens → bullish idea is invalid, and price may seek deeper support.
⸻ Mr SMC Trading point
Summary
This setup is a textbook bullish pullback:
• Trend intact
• OTE + demand confluence
• Clear upside liquidity target
Please support boost this analysis

XAU/USD)Bullish trend analysis Read The captionSMC Trading point update
Technical analysis of XAUUSD (Gold) – 1H chart using SMC + Fibonacci OTE + trend-channel continuation.
⸻
Market Context
• Bias: Bullish continuation
• Price is respecting a well-defined ascending channel
• Market structure remains higher highs & higher lows
• EMAs:
• EMA 50 above EMA 200
• EMA 50 acting as dynamic support
• Recent consolidation near highs = absorption, not reversal
⸻
What Price Is Doing
• After the impulsive rally, price paused at internal resistance
• This pause is forming a controlled pullback
• The projected path shows a dip into discount → continuation higher
This is classic trend continuation behavior.
⸻
Key Buy Zone (Lower Blue Area)
~4,475 – 4,495
Strong confluence here:
• SMC demand / order block
• Fib OTE zone (0.705 – 0.79)
• EMA 50 support (~4,498)
• Rising channel support
• Clear reaction point (green arrow)
This is the high-probability long zone, not the current price.
⸻
Fibonacci Logic
Measured from the impulse low → recent high:
• 0.5 / 0.62 = shallow retracement
• 0.705 – 0.79 = optimal trade entry (OTE)
Institutions typically rebalance longs here in an uptrend
⸻
Trade Idea (Continuation Long)
Buy on confirmation inside demand
• Entry: 4,475 – 4,495
• Stop Loss: Below demand & channel (~4,455)
• Targets:
• TP1: 4,535 (recent high)
• TP2: 4,560
• Final TP: 4,575 – 4,580 (marked target / upper channel liquidity)
Risk–Reward: ~1:3 or better
⸻
Confirmation Triggers (Important)
Only execute if you see:
• Bullish engulfing or strong rejection wick from the zone
• Lower-timeframe CHoCH
• Failure to accept below the OTE zone
• Momentum expansion after tapping demand
⸻
Invalidation
• 1H close below ~4,455
• Acceptance below channel support + EMA 50
If this occurs → bullish continuation idea is invalid, and price may rotate deeper.
⸻Mr smc Trading point
Summary
This setup is a textbook bullish pullback:
• Trend intact
• OTE + demand + EMA confluence
• Clear upside liquidity target
Key edge: wait for price to come discount and confirm buyers, don’t chase highs.
Please support boost this analysis

Busted Chart Patterns...What They Are?Hello traders,
Ever saw that textbook double bottom with all rules applied? Price broke the swing high and stayed above, clear entry, stop loss and tp targets. All of a sudden, price reverts and continues the move downwards. But why? its a double bottom for god's sake!! Every guru said its a guaranteed trade.
This was not a double bottom. This was "busted double bottom". So what is a busted pattern?
--------------------------------------------------------------------------
🔍 What defines a busted chart pattern?
A pattern is considered "busted" when all of the following occur:
1️⃣ Typical price breakout
Price closes above resistance or below support, or outside a pattern boundary (e.g., triangle trendline).
2️⃣ Limited follow-through
Price travels no more than ~10-15% in the breakout direction.
3️⃣ Failure & reversal
Volume and momentum stalls and price reverses
4️⃣ Invalidation close
Bearish breakout → price closes back above the top of the pattern
Bullish breakout → price closes back below the lowest low of the pattern
--------------------------------------------------------------------------
🔄 Can a single pattern bust more than once?
Yes.
Patterns can experience: Single (most common), double or triple bust.
Price could oscillate for days, weeks or months, repeatedly failing in both directions. Usually that is a clear sign of distribution, accumulation, or liquidity sweeping.
--------------------------------------------------------------------------
🧩 How this fits modern price action?
Busted patterns often align with:
- Liquidity grabs
- False breakouts
- Stop-hunt behavior
--------------------------------------------------------------------------
🛠️ How to capitalize on this in our trading?
If the normal pattern momentum is fading, wait for failure confirmation
- Use the reclaimed level as invalidation
- Expect expansion in the opposite direction
- Risk is often cleaner than chasing breakouts
--------------------------------------------------------------------------
📌 Examples
Busted Head & Shoulders
Busted Double Top
--------------------------------------------------------------------------
Patterns fail not because they are “wrong.” But because our mindset becomes one-sided.
Educational content only. Always manage risk and do your own analysis.
This knowledge and concepts are adapted from Thomas Bulkowski’s chart pattern research
If you find value in this content, please support the effort with a like & a comment

XAU/USD)Bullish trend analysis Read The captionSMC Trading point update
Technical analysis of XAUUSD (Gold) – 1H chart using trend structure + SMC + Fibonacci OTE.
⸻
Market Context
• Overall bias: Bullish
• Price is respecting a rising channel
• Market structure still shows higher highs & higher lows
• Recent drop is a healthy pullback, not a trend reversal
⸻
Why Price Is Pulling Back
• Price reacted near short-term resistance (0 level)
• Profit-taking + liquidity sweep caused a retracement
• Pullback is heading into a discount zone within an uptrend
⸻
Key Buy Zone (Blue Area)
~4,465 – 4,480
This zone has strong confluence:
• SMC demand / order block
• Fib OTE zone (0.705 – 0.79)
• EMA 50 support
• Rising trendline support
• Clear reaction level (green arrow)
This is where buyers are expected to defend the trend.
⸻
Fibonacci Logic
Measured from the recent impulse low → high:
• 0.5 / 0.62 → shallow retracement
• 0.705 – 0.79 → institutional rebalance zone
Textbook area for trend continuation entries
⸻
Trade Idea (Continuation Long)
Buy on confirmation inside demand
• Entry: 4,465 – 4,480
• Stop Loss: Below demand & trendline (~4,450)
• Targets:
• TP1: 4,500 (internal structure high)
• TP2: 4,525
• Final TP: 4,551 (marked target point / liquidity above highs)
Risk–Reward: ~1:3 or better
⸻
Confirmation Triggers (Important)
Only enter if you see:
• Bullish engulfing or strong rejection wick
• Lower-TF CHoCH
• Failure to close below the demand zone
• Momentum expansion after tapping the zone
⸻
Invalidation
• 1H close below ~4,450
• Acceptance below trendline + EMA 50
If this happens → bullish idea is invalid, and price may seek the lower support.
⸻ Mr SMC Trading point
Summary
This setup is a high-probability bullish pullback:
• Trend intact
• Fib OTE + demand
• Clear upside liquidity target
Please support boost this analysis

XAU/USD)Bullish trend analysis Read The captionSMC Trading point update
Technical analysis of XAUUSD (Gold) – 1H chart using SMC + Fibonacci + trend continuation.
⸻
Market Context
• Overall bias: Bullish
• Price is respecting an ascending trend structure
• Higher highs & higher lows remain intact
• Recent move down is a controlled pullback, not a reversal
• EMA structure:
• EMA 50 above EMA 200
• EMA 50 acting as dynamic support
⸻
Pullback Logic
After the impulsive rally:
• Price retraced into:
• Trendline support
• EMA 50
• Fib discount zone
• This signals healthy consolidation before continuation
⸻
Key Demand Zone (Blue Area)
~4,455 – 4,465
Confluence:
• SMC demand / order block
• Fib 0.62 – 0.79 retracement
• EMA 50
• Rising trendline support
• Marked reaction (green arrow) → buyers stepping in
This is the high-probability buy zone.
⸻
Fibonacci Insight
Measured from the latest impulse low → high:
• 0.5 → shallow reaction
• 0.62 – 0.79 → optimal institutional rebalance zone (OTE)
Price reacting here supports trend continuation
⸻
Trade Idea (Example Plan)
Buy confirmation inside demand
• Entry: 4,455 – 4,465
• Stop Loss: Below demand & trendline (~4,440)
• Targets:
• TP1: 4,500 (range high)
• TP2 / Final: 4,540 (marked target point)
Risk–Reward: ~1:3 or better
⸻
Confirmation Triggers (Important)
Enter only if you see:
• Bullish engulfing / strong rejection wick
• Lower-timeframe CHoCH
• Momentum expansion from the zone
⸻
Invalidation
• 1H close below ~4,440
• Clean break and acceptance below EMA 50 + trendline
If this happens → bullish idea is invalid, and price may seek the lower FVG/demand.
⸻ Mr SMC Trading point
Summary
This setup is a textbook bullish pullback:
• Trend intact
• EMA + Fib + demand confluence
• Clear upside liquidity target
Please support boost this analysis

USD/JPY)Bullish trend analysis Read The captionSMC Trading point update
Technical analysis of USDJPY – 4H chart using trend structure + SMC + EMA/FVG confluence.
⸻
Market Context
• Overall bias: Bullish
• Price is trading inside a rising channel
• Market structure remains higher highs & higher lows
• Recent downside move = corrective pullback, not a trend reversal
⸻
Why Price Pulled Back
• Price previously tapped upper channel resistance
• Profit-taking + liquidity sweep caused a retracement
• Pullback is controlled and respecting higher-timeframe structure
⸻
Key Buy Zone (Blue Area)
~ – 155.30
This zone is high-probability because of strong confluence:
• SMC demand zone
• Unfilled FVG (fair value gap)
• EMA 200 support
• Lower channel boundary
• Prior bullish reaction (green arrow)
This is where smart money is likely defending longs.
⸻
Trade Idea (Trend Continuation Long)
Buy on confirmation inside the demand zone
• Entry: 155.00 – 155.30
• Stop Loss: Below demand (~154.50)
• Targets:
• TP1: 156.10 (EMA 50 / mid-channel)
• TP2: 157.30
• Final TP: 158.50 (marked target point / channel high)
Risk–Reward: ~1:3 to 1:4
⸻
Confirmation Triggers (Important)
Only take the trade if you see:
• Bullish engulfing or strong rejection wick (4H or 1H)
• Lower-timeframe CHoCH
• Failure to close below the FVG
• Momentum expansion from the zone
⸻
Invalidation
• 4H close below ~154.50
• Acceptance below channel support + EMA 200
If this happens → bullish continuation idea is invalid, and price may rotate lower.
⸻ Mr SMC Trading point
Summary
This setup is a textbook bullish continuation:
• Trend intact
• Demand + FVG + EMA confluence
• Clear upside liquidity target
Please support boost this analysis

BTC/ISD)bullish trend analysis Read The captionSMC Trading point update
Technical analysis of BTCUSD – intraday (likely 1H–4H) chart using SMC + Fibonacci OTE + mean-reversion logic.
⸻
Market Context
• Bias: Bullish continuation (corrective pullback)
• Price sold off impulsively, then started to slow down into discount
• The move down shows decreasing momentum, suggesting sell-side liquidity absorption, not continuation lower
⸻
Why Price Pulled Back
• Liquidity was taken above the recent swing high
• Price retraced into a deep discount area
• This is a classic rebalancing move after an impulsive leg
⸻
Key Demand / Order Block Zone (Blue Area)
~85,800 – 86,700
Strong confluence:
• Fib OTE zone (0.705 – 0.79)
• Clearly marked order block (ob)
• Prior reaction lows
• Psychological support around 86k
• Green arrow → first buyer response already visible
This is the highest-probability long area on the chart.
⸻
Fibonacci Logic
Measured from impulse low → swing high:
• 0.62 → shallow reaction
• 0.705 – 0.79 → institutional rebalance zone
Textbook location for trend continuation entries
⸻
Trade Idea (Example Plan)
Buy on confirmation inside demand
• Entry: 86,000 – 86,700
• Stop Loss: Below demand (~85,200)
• Targets:
• TP1: 88,050 (EMA / mid-range)
• TP2: 89,800 – 90,000
• Final TP: 90,700+ (marked target point / liquidity above highs)
RR potential: ~1:3 to 1:5
⸻
Best Confirmation Signals
Before entering, look for:
• Bullish engulfing or strong rejection wick from the zone
• Lower-TF CHoCH
• Compression → expansion behavior
• Failure of price to accept below the order block
⸻
Invalidation
• Strong close below ~85,200
• Acceptance below the OB with momentum
If that happens → bullish idea is invalid, and price likely seeks deeper HTF liquidity.
⸻ Mr SMC Trading point
Summary
This setup is a classic BTC continuation play
• Deep discount
• OTE + order block
• Liquidity above acting as magnet
Please support boost this analysis
