USDCHF H4 | Possible Bearish Reversal IncomingThe Swissie (USD/CHF) is reacting off the sell entry, which is a pullback resistance that aligns with the 38.2% Fibonacci retracement and could reverse from this level to the downside.
Sell entry is at 0.8030, which is a pullback resistance that lines up with the 38.2% Fibonacci retracement.
Stop loss is at 0.8103, which is a swing high resistance that aligns with the 127.2% Fibonacci extension.
Take profit is at 0.7945, which is a pullback support that lines up with the 161.8% Fibonacci extension.
High Risk Investment Warning
Trading Forex/CFDs on margin carries a high level of risk and may not be suitable for all investors. Leverage can work against you.
Stratos Markets Limited (tradu.com ):
CFDs are complex instruments and come with a high risk of losing money rapidly due to leverage. 65% of retail investor accounts lose money when trading CFDs with this provider. You should consider whether you understand how CFDs work and whether you can afford to take the high risk of losing your money.
Stratos Europe Ltd (tradu.com ):
CFDs are complex instruments and come with a high risk of losing money rapidly due to leverage. 66% of retail investor accounts lose money when trading CFDs with this provider. You should consider whether you understand how CFDs work and whether you can afford to take the high risk of losing your money.
Stratos Global LLC (tradu.com ):
Losses can exceed deposits.
Please be advised that the information presented on TradingView is provided to Tradu (‘Company’, ‘we’) by a third-party provider (‘TFA Global Pte Ltd’). Please be reminded that you are solely responsible for the trading decisions on your account. There is a very high degree of risk involved in trading. Any information and/or content is intended entirely for research, educational and informational purposes only and does not constitute investment or consultation advice or investment strategy. The information is not tailored to the investment needs of any specific person and therefore does not involve a consideration of any of the investment objectives, financial situation or needs of any viewer that may receive it. Kindly also note that past performance is not a reliable indicator of future results. Actual results may differ materially from those anticipated in forward-looking or past performance statements. We assume no liability as to the accuracy or completeness of any of the information and/or content provided herein and the Company cannot be held responsible for any omission, mistake nor for any loss or damage including without limitation to any loss of profit which may arise from reliance on any information supplied by TFA Global Pte Ltd.
The speaker(s) is neither an employee, agent nor representative of Tradu and is therefore acting independently. The opinions given are their own, constitute general market commentary, and do not constitute the opinion or advice of Tradu or any form of personal or investment advice. Tradu neither endorses nor guarantees offerings of third-party speakers, nor is Tradu responsible for the content, veracity or opinions of third-party speakers, presenters or participants.
Chf

Bullish rise?CAD/CHF has broken out of the pivot and could rise to the 1st resistance.
Pivot: 0.58239
1st Support: 0.57827
1st Resistance: 0.58631
Risk Warning:
Trading Forex and CFDs carries a high level of risk to your capital and you should only trade with money you can afford to lose. Trading Forex and CFDs may not be suitable for all investors, so please ensure that you fully understand the risks involved and seek independent advice if necessary.
Disclaimer:
The above opinions given constitute general market commentary, and do not constitute the opinion or advice of IC Markets or any form of personal or investment advice.
Any opinions, news, research, analyses, prices, other information, or links to third-party sites contained on this website are provided on an "as-is" basis, are intended only to be informative, is not an advice nor a recommendation, nor research, or a record of our trading prices, or an offer of, or solicitation for a transaction in any financial instrument and thus should not be treated as such. The information provided does not involve any specific investment objectives, financial situation and needs of any specific person who may receive it. Please be aware, that past performance is not a reliable indicator of future performance and/or results. Past Performance or Forward-looking scenarios based upon the reasonable beliefs of the third-party provider are not a guarantee of future performance. Actual results may differ materially from those anticipated in forward-looking or past performance statements. IC Markets makes no representation or warranty and assumes no liability as to the accuracy or completeness of the information provided, nor any loss arising from any investment based on a recommendation, forecast or any information supplied by any third-party.

Bearish reversal off pullback resistance?NZD/CHF is rising towards the pivot, which is a pullback resistance that lines up with the 61.8% Fibonacci retracement and could reverse to the 1st support.
Pivot: 0.47599
1st Support: 0.46757
1st Resistance: 0.48168
Risk Warning:
Trading Forex and CFDs carries a high level of risk to your capital and you should only trade with money you can afford to lose. Trading Forex and CFDs may not be suitable for all investors, so please ensure that you fully understand the risks involved and seek independent advice if necessary.
Disclaimer:
The above opinions given constitute general market commentary, and do not constitute the opinion or advice of IC Markets or any form of personal or investment advice.
Any opinions, news, research, analyses, prices, other information, or links to third-party sites contained on this website are provided on an "as-is" basis, are intended only to be informative, is not an advice nor a recommendation, nor research, or a record of our trading prices, or an offer of, or solicitation for a transaction in any financial instrument and thus should not be treated as such. The information provided does not involve any specific investment objectives, financial situation and needs of any specific person who may receive it. Please be aware, that past performance is not a reliable indicator of future performance and/or results. Past Performance or Forward-looking scenarios based upon the reasonable beliefs of the third-party provider are not a guarantee of future performance. Actual results may differ materially from those anticipated in forward-looking or past performance statements. IC Markets makes no representation or warranty and assumes no liability as to the accuracy or completeness of the information provided, nor any loss arising from any investment based on a recommendation, forecast or any information supplied by any third-party.

GBP/CHF - Wedge Breakout (28.08.2025)The GBP/CHF pair on the M30 timeframe presents a Potential Buying Opportunity due to a recent Formation of a Wedge Breakout Pattern. This suggests a shift in momentum towards the upside and a higher likelihood of further advances in the coming hours.
Possible Long Trade:
Entry: Consider Entering A Long Position around Trendline Of The Pattern.
Target Levels:
1st Resistance – 1.0862
2nd Resistance – 1.0877
🎁 Please hit the like button and
🎁 Leave a comment to support for My Post !
Your likes and comments are incredibly motivating and will encourage me to share more analysis with you.
Best Regards, KABHI_TA_TRADING
Thank you.
Disclosure: I am part of Trade Nation's Influencer program and receive a monthly fee for using their TradingView charts in my analysis.

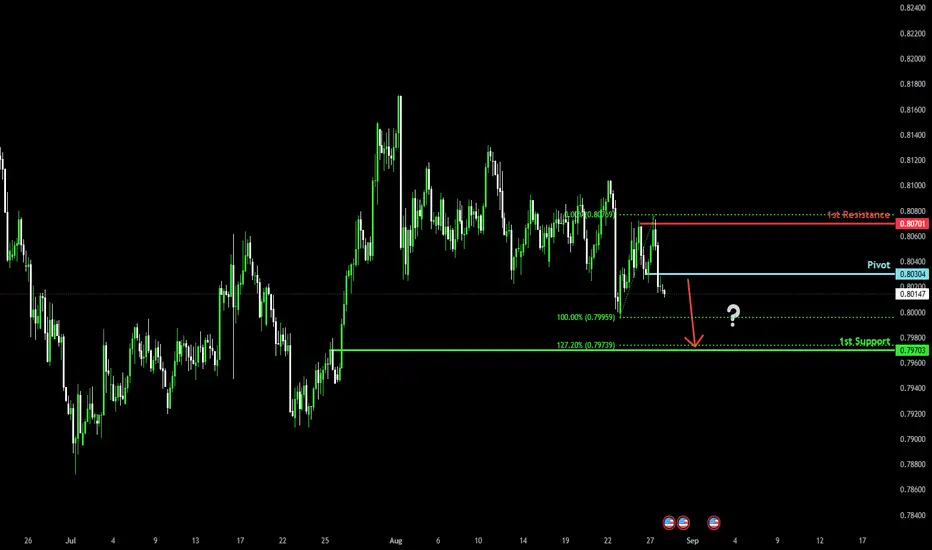
Bullish bounce?USD/CHF is falling towards the support level, which is a pullback support that aligns with the 127.2% Fibonacci extension and the 100% Fibonacci projection and could bounce from this level to our take profit.
Entry: 0.7971
Why we like it:
There is a pullback support that lines up with the 127.2% Fibonacci extension and the 100% Fibonacci projection.
Stop loss: 0.7923
Why we like it:
There is a multi-swing low support.
Take profit: 0.8026
Why we ike it:
There is a pullback resistance.
Enjoying your TradingView experience? Review us!
Please be advised that the information presented on TradingView is provided to Vantage (‘Vantage Global Limited’, ‘we’) by a third-party provider (‘Everest Fortune Group’). Please be reminded that you are solely responsible for the trading decisions on your account. There is a very high degree of risk involved in trading. Any information and/or content is intended entirely for research, educational and informational purposes only and does not constitute investment or consultation advice or investment strategy. The information is not tailored to the investment needs of any specific person and therefore does not involve a consideration of any of the investment objectives, financial situation or needs of any viewer that may receive it. Kindly also note that past performance is not a reliable indicator of future results. Actual results may differ materially from those anticipated in forward-looking or past performance statements. We assume no liability as to the accuracy or completeness of any of the information and/or content provided herein and the Company cannot be held responsible for any omission, mistake nor for any loss or damage including without limitation to any loss of profit which may arise from reliance on any information supplied by Everest Fortune Group.
Please be advised that the information presented on TradingView is provided to Vantage (‘Vantage Global Limited’, ‘we’) by a third-party provider (‘Everest Fortune Group’). Please be reminded that you are solely responsible for the trading decisions on your account. There is a very high degree of risk involved in trading. Any information and/or content is intended entirely for research, educational and informational purposes only and does not constitute investment or consultation advice or investment strategy. The information is not tailored to the investment needs of any specific person and therefore does not involve a consideration of any of the investment objectives, financial situation or needs of any viewer that may receive it. Kindly also note that past performance is not a reliable indicator of future results. Actual results may differ materially from those anticipated in forward-looking or past performance statements. We assume no liability as to the accuracy or completeness of any of the information and/or content provided herein and the Company cannot be held responsible for any omission, mistake nor for any loss or damage including without limitation to any loss of profit which may arise from reliance on any information supplied by Everest Fortune Group.

Potential bearish drop?The Swissie (USD/CHF) is rising towards the pivot which is a pullback resistance and could drop to the 1st support.
Pivot: 0.7030
1st Support: 0.7970
1st Resistance: 0.8070
Risk Warning:
Trading Forex and CFDs carries a high level of risk to your capital and you should only trade with money you can afford to lose. Trading Forex and CFDs may not be suitable for all investors, so please ensure that you fully understand the risks involved and seek independent advice if necessary.
Disclaimer:
The above opinions given constitute general market commentary, and do not constitute the opinion or advice of IC Markets or any form of personal or investment advice.
Any opinions, news, research, analyses, prices, other information, or links to third-party sites contained on this website are provided on an "as-is" basis, are intended only to be informative, is not an advice nor a recommendation, nor research, or a record of our trading prices, or an offer of, or solicitation for a transaction in any financial instrument and thus should not be treated as such. The information provided does not involve any specific investment objectives, financial situation and needs of any specific person who may receive it. Please be aware, that past performance is not a reliable indicator of future performance and/or results. Past Performance or Forward-looking scenarios based upon the reasonable beliefs of the third-party provider are not a guarantee of future performance. Actual results may differ materially from those anticipated in forward-looking or past performance statements. IC Markets makes no representation or warranty and assumes no liability as to the accuracy or completeness of the information provided, nor any loss arising from any investment based on a recommendation, forecast or any information supplied by any third-party.
USDCHF H4 | Bearish reversalUSD/CHF is rising towards the sell entry, which is a pullback resistance and could reverse from this level to the downside.
Sell entry is at 0.8087, which is a pullback resistance.
Stop loss is at 0.8121, which is a pullback resistance that is slightly below the 127.2% Fibonacci extension.
Take profit is at 0.7996, which is a pullback support.
High Risk Investment Warning
Trading Forex/CFDs on margin carries a high level of risk and may not be suitable for all investors. Leverage can work against you.
Stratos Markets Limited (tradu.com ):
CFDs are complex instruments and come with a high risk of losing money rapidly due to leverage. 65% of retail investor accounts lose money when trading CFDs with this provider. You should consider whether you understand how CFDs work and whether you can afford to take the high risk of losing your money.
Stratos Europe Ltd (tradu.com ):
CFDs are complex instruments and come with a high risk of losing money rapidly due to leverage. 66% of retail investor accounts lose money when trading CFDs with this provider. You should consider whether you understand how CFDs work and whether you can afford to take the high risk of losing your money.
Stratos Global LLC (tradu.com ):
Losses can exceed deposits.
Please be advised that the information presented on TradingView is provided to Tradu (‘Company’, ‘we’) by a third-party provider (‘TFA Global Pte Ltd’). Please be reminded that you are solely responsible for the trading decisions on your account. There is a very high degree of risk involved in trading. Any information and/or content is intended entirely for research, educational and informational purposes only and does not constitute investment or consultation advice or investment strategy. The information is not tailored to the investment needs of any specific person and therefore does not involve a consideration of any of the investment objectives, financial situation or needs of any viewer that may receive it. Kindly also note that past performance is not a reliable indicator of future results. Actual results may differ materially from those anticipated in forward-looking or past performance statements. We assume no liability as to the accuracy or completeness of any of the information and/or content provided herein and the Company cannot be held responsible for any omission, mistake nor for any loss or damage including without limitation to any loss of profit which may arise from reliance on any information supplied by TFA Global Pte Ltd.
The speaker(s) is neither an employee, agent nor representative of Tradu and is therefore acting independently. The opinions given are their own, constitute general market commentary, and do not constitute the opinion or advice of Tradu or any form of personal or investment advice. Tradu neither endorses nor guarantees offerings of third-party speakers, nor is Tradu responsible for the content, veracity or opinions of third-party speakers, presenters or participants.

USDCHF H4 | Bullish bounce offThe Swissie (USD/CHF) has bounced off the buy entry which is an overlap support that lines up with the 138.2% Fibonacci extension and could potentially rise from this level to the take profit.
Buy entry is at 0.7992, which acts as an overlap support that aligns with the 138.2% Fibonacci extension.
Stop loss is at 0.7943, which is a pullback support.
Take profit is at 0.8086, which is a pullback resistance.
High Risk Investment Warning
Trading Forex/CFDs on margin carries a high level of risk and may not be suitable for all investors. Leverage can work against you.
Stratos Markets Limited (tradu.com ):
CFDs are complex instruments and come with a high risk of losing money rapidly due to leverage. 65% of retail investor accounts lose money when trading CFDs with this provider. You should consider whether you understand how CFDs work and whether you can afford to take the high risk of losing your money.
Stratos Europe Ltd (tradu.com ):
CFDs are complex instruments and come with a high risk of losing money rapidly due to leverage. 66% of retail investor accounts lose money when trading CFDs with this provider. You should consider whether you understand how CFDs work and whether you can afford to take the high risk of losing your money.
Stratos Global LLC (tradu.com ):
Losses can exceed deposits.
Please be advised that the information presented on TradingView is provided to Tradu (‘Company’, ‘we’) by a third-party provider (‘TFA Global Pte Ltd’). Please be reminded that you are solely responsible for the trading decisions on your account. There is a very high degree of risk involved in trading. Any information and/or content is intended entirely for research, educational and informational purposes only and does not constitute investment or consultation advice or investment strategy. The information is not tailored to the investment needs of any specific person and therefore does not involve a consideration of any of the investment objectives, financial situation or needs of any viewer that may receive it. Kindly also note that past performance is not a reliable indicator of future results. Actual results may differ materially from those anticipated in forward-looking or past performance statements. We assume no liability as to the accuracy or completeness of any of the information and/or content provided herein and the Company cannot be held responsible for any omission, mistake nor for any loss or damage including without limitation to any loss of profit which may arise from reliance on any information supplied by TFA Global Pte Ltd.
The speaker(s) is neither an employee, agent nor representative of Tradu and is therefore acting independently. The opinions given are their own, constitute general market commentary, and do not constitute the opinion or advice of Tradu or any form of personal or investment advice. Tradu neither endorses nor guarantees offerings of third

Bullish reversal off pullback support?The Swissie (USD/CHF) is falling towards the pivot and could bounce to the 1st resistance.
Pivot: 0.7915
1st Support: 0.7869
1st Resistance: 0.8089
Risk Warning:
Trading Forex and CFDs carries a high level of risk to your capital and you should only trade with money you can afford to lose. Trading Forex and CFDs may not be suitable for all investors, so please ensure that you fully understand the risks involved and seek independent advice if necessary.
Disclaimer:
The above opinions given constitute general market commentary, and do not constitute the opinion or advice of IC Markets or any form of personal or investment advice.
Any opinions, news, research, analyses, prices, other information, or links to third-party sites contained on this website are provided on an "as-is" basis, are intended only to be informative, is not an advice nor a recommendation, nor research, or a record of our trading prices, or an offer of, or solicitation for a transaction in any financial instrument and thus should not be treated as such. The information provided does not involve any specific investment objectives, financial situation and needs of any specific person who may receive it. Please be aware, that past performance is not a reliable indicator of future performance and/or results. Past Performance or Forward-looking scenarios based upon the reasonable beliefs of the third-party provider are not a guarantee of future performance. Actual results may differ materially from those anticipated in forward-looking or past performance statements. IC Markets makes no representation or warranty and assumes no liability as to the accuracy or completeness of the information provided, nor any loss arising from any investment based on a recommendation, forecast or any information supplied by any third-party.

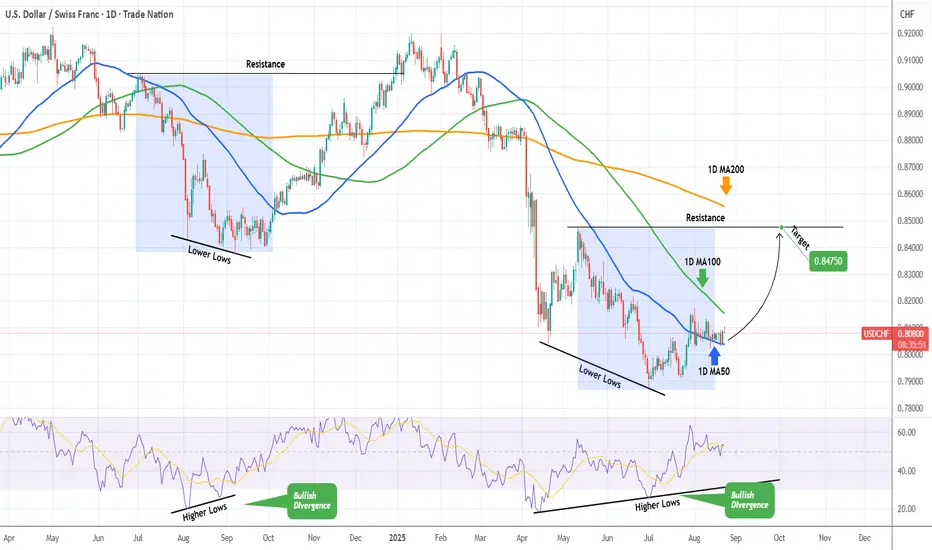
USDCHF Strong buy signal on a 2024 fractal.Last time we looked at the USDCHF pair (June 19, see chart below), we took the most optimal sell at the top of the Channel Down, which easily hit the 0.80565 Target:
This time we are getting a strong buy signal as not only is the price supported on the 1D MA50 (blue trend-line) in what seems like a Bull Flag, but also the 1D RSI is on a huge Bullish Divergence (Higher Lows against the price's Lower Lows), similar to he August 2024 pattern.
That sequence rose all the way to the upper Resistance (even broke it), so we do expect the pair to resume the rally and Target 0.84750. That might also be just in time to test the 1D MA200 (orange trend-line) for the first time since April 03.
-------------------------------------------------------------------------------
** Please LIKE 👍, FOLLOW ✅, SHARE 🙌 and COMMENT ✍ if you enjoy this idea! Also share your ideas and charts in the comments section below! This is best way to keep it relevant, support us, keep the content here free and allow the idea to reach as many people as possible. **
-------------------------------------------------------------------------------
Disclosure: I am part of Trade Nation's Influencer program and receive a monthly fee for using their TradingView charts in my analysis.
💸💸💸💸💸💸
👇 👇 👇 👇 👇 👇
Bearish reversal off?The Swissie (USD/CHF) is rising towards the pivot and could reverse to the multi swing low support.
Pivot: 0.81198
1st Support: 0.8033
1st Resistance: 0.8171
Risk Warning:
Trading Forex and CFDs carries a high level of risk to your capital and you should only trade with money you can afford to lose. Trading Forex and CFDs may not be suitable for all investors, so please ensure that you fully understand the risks involved and seek independent advice if necessary.
Disclaimer:
The above opinions given constitute general market commentary, and do not constitute the opinion or advice of IC Markets or any form of personal or investment advice.
Any opinions, news, research, analyses, prices, other information, or links to third-party sites contained on this website are provided on an "as-is" basis, are intended only to be informative, is not an advice nor a recommendation, nor research, or a record of our trading prices, or an offer of, or solicitation for a transaction in any financial instrument and thus should not be treated as such. The information provided does not involve any specific investment objectives, financial situation and needs of any specific person who may receive it. Please be aware, that past performance is not a reliable indicator of future performance and/or results. Past Performance or Forward-looking scenarios based upon the reasonable beliefs of the third-party provider are not a guarantee of future performance. Actual results may differ materially from those anticipated in forward-looking or past performance statements. IC Markets makes no representation or warranty and assumes no liability as to the accuracy or completeness of the information provided, nor any loss arising from any investment based on a recommendation, forecast or any information supplied by any third-party.

USDCHF H4 | Potential bearish dropBased on the H4 chart analysis, we could see that the price has reacted off the sell entry, which is a pullback support, and could drop from this level to the downside.
Sell entry is at 0.8049, which is a pullback resistance.
Stop loss is at 0.8087, which is a multi swing high resistance.
Take profit is at 0.7985, which is a pullback support that lines up with the 138.2% Fibonacci extension.
High Risk Investment Warning
Trading Forex/CFDs on margin carries a high level of risk and may not be suitable for all investors. Leverage can work against you.
Stratos Markets Limited (tradu.com ):
CFDs are complex instruments and come with a high risk of losing money rapidly due to leverage. 65% of retail investor accounts lose money when trading CFDs with this provider. You should consider whether you understand how CFDs work and whether you can afford to take the high risk of losing your money.
Stratos Europe Ltd (tradu.com ):
CFDs are complex instruments and come with a high risk of losing money rapidly due to leverage. 66% of retail investor accounts lose money when trading CFDs with this provider. You should consider whether you understand how CFDs work and whether you can afford to take the high risk of losing your money.
Stratos Global LLC (tradu.com ):
Losses can exceed deposits.
Please be advised that the information presented on TradingView is provided to Tradu (‘Company’, ‘we’) by a third-party provider (‘TFA Global Pte Ltd’). Please be reminded that you are solely responsible for the trading decisions on your account. There is a very high degree of risk involved in trading. Any information and/or content is intended entirely for research, educational and informational purposes only and does not constitute investment or consultation advice or investment strategy. The information is not tailored to the investment needs of any specific person and therefore does not involve a consideration of any of the investment objectives, financial situation or needs of any viewer that may receive it. Kindly also note that past performance is not a reliable indicator of future results. Actual results may differ materially from those anticipated in forward-looking or past performance statements. We assume no liability as to the accuracy or completeness of any of the information and/or content provided herein and the Company cannot be held responsible for any omission, mistake nor for any loss or damage including without limitation to any loss of profit which may arise from reliance on any information supplied by TFA Global Pte Ltd.
The speaker(s) is neither an employee, agent nor representative of Tradu and is therefore acting independently. The opinions given are their own, constitute general market commentary, and do not constitute the opinion or advice of Tradu or any form of personal or investment advice. Tradu neither endorses nor guarantees offerings of third-party speakers, nor is Tradu responsible for the content, veracity or opinions of third-party speakers, presenters or participants.

Bullish bounce off pullback support?GBP/CHF is falling towards the pivot and could bounce to the 1st resistance.
Pivot: 1.0791
1st Support: 1.0718
1st Resistance: 1.0873
Risk Warning:
Trading Forex and CFDs carries a high level of risk to your capital and you should only trade with money you can afford to lose. Trading Forex and CFDs may not be suitable for all investors, so please ensure that you fully understand the risks involved and seek independent advice if necessary.
Disclaimer:
The above opinions given constitute general market commentary, and do not constitute the opinion or advice of IC Markets or any form of personal or investment advice.
Any opinions, news, research, analyses, prices, other information, or links to third-party sites contained on this website are provided on an "as-is" basis, are intended only to be informative, is not an advice nor a recommendation, nor research, or a record of our trading prices, or an offer of, or solicitation for a transaction in any financial instrument and thus should not be treated as such. The information provided does not involve any specific investment objectives, financial situation and needs of any specific person who may receive it. Please be aware, that past performance is not a reliable indicator of future performance and/or results. Past Performance or Forward-looking scenarios based upon the reasonable beliefs of the third-party provider are not a guarantee of future performance. Actual results may differ materially from those anticipated in forward-looking or past performance statements. IC Markets makes no representation or warranty and assumes no liability as to the accuracy or completeness of the information provided, nor any loss arising from any investment based on a recommendation, forecast or any information supplied by any third-party.

USDCHF H4 | Bearish dropBased on the H4 chart analysis, we can see that the price has rejected off the sell entry and could potentially drop from this level to the downside.
Sell entry is at 0.8087, which is a pullback resistance.
Stop loss is at 0.8120, which is a pullback resistance.
Take profit is at 0.8018, which is a pullback support that is slightly below the 61.8% Fibonacci projection.
High Risk Investment Warning
Trading Forex/CFDs on margin carries a high level of risk and may not be suitable for all investors. Leverage can work against you.
Stratos Markets Limited (tradu.com ):
CFDs are complex instruments and come with a high risk of losing money rapidly due to leverage. 65% of retail investor accounts lose money when trading CFDs with this provider. You should consider whether you understand how CFDs work and whether you can afford to take the high risk of losing your money.
Stratos Europe Ltd (tradu.com ):
CFDs are complex instruments and come with a high risk of losing money rapidly due to leverage. 66% of retail investor accounts lose money when trading CFDs with this provider. You should consider whether you understand how CFDs work and whether you can afford to take the high risk of losing your money.
Stratos Global LLC (tradu.com ):
Losses can exceed deposits.
Please be advised that the information presented on TradingView is provided to Tradu (‘Company’, ‘we’) by a third-party provider (‘TFA Global Pte Ltd’). Please be reminded that you are solely responsible for the trading decisions on your account. There is a very high degree of risk involved in trading. Any information and/or content is intended entirely for research, educational and informational purposes only and does not constitute investment or consultation advice or investment strategy. The information is not tailored to the investment needs of any specific person and therefore does not involve a consideration of any of the investment objectives, financial situation or needs of any viewer that may receive it. Kindly also note that past performance is not a reliable indicator of future results. Actual results may differ materially from those anticipated in forward-looking or past performance statements. We assume no liability as to the accuracy or completeness of any of the information and/or content provided herein and the Company cannot be held responsible for any omission, mistake nor for any loss or damage including without limitation to any loss of profit which may arise from reliance on any information supplied by TFA Global Pte Ltd.
The speaker(s) is neither an employee, agent nor representative of Tradu and is therefore acting independently. The opinions given are their own, constitute general market commentary, and do not constitute the opinion or advice of Tradu or any form of personal or investment advice. Tradu neither endorses nor guarantees offerings of third-party speakers, nor is Tradu responsible for the content, veracity or opinions of third-party speakers, presenters or participants.

Bearish drop?AUD/CHF has rejewcted off the resstiance level which is an overlap resistance and could potentially drop from this level to our takeprofit.
Entry: 0.52575
Why we like it:
There is an overlap resistance level.
Stop loss: 0.5292
Why we like it:
There is a swing high resistance level.
Take profit: 0.51852
Why we like it:
There is a multi swing low support.
Enjoying your TradingView experience? Review us!
Please be advised that the information presented on TradingView is provided to Vantage (‘Vantage Global Limited’, ‘we’) by a third-party provider (‘Everest Fortune Group’). Please be reminded that you are solely responsible for the trading decisions on your account. There is a very high degree of risk involved in trading. Any information and/or content is intended entirely for research, educational and informational purposes only and does not constitute investment or consultation advice or investment strategy. The information is not tailored to the investment needs of any specific person and therefore does not involve a consideration of any of the investment objectives, financial situation or needs of any viewer that may receive it. Kindly also note that past performance is not a reliable indicator of future results. Actual results may differ materially from those anticipated in forward-looking or past performance statements. We assume no liability as to the accuracy or completeness of any of the information and/or content provided herein and the Company cannot be held responsible for any omission, mistake nor for any loss or damage including without limitation to any loss of profit which may arise from reliance on any information supplied by Everest Fortune Group.

USDCHF OUTLOOK - SWING SETUPExpecting a bullish dollar in the next few months, which in turn will be bullish for USDCHF.
Note: ****I forgot to publish/share the trade setup after annotation.
"May fortune attend thee, and thy trade prosper." .......L2Earned

AUDCHF - Already Overbought!Hello TradingView Family / Fellow Traders. This is Richard, also known as theSignalyst.
📈AUDCHF has been overall bullish trading within the rising channel marked in red and it is currently retesting the upper bound of the channel acting as an over-bought zone.
Moreover, the blue zone is a strong weekly resistance.
📚 As per my trading style:
As #AUDCHF approaches the red circle zone, I will be looking for bearish reversal setups (like a double top pattern, trendline break , and so on...)
📚 Always follow your trading plan regarding entry, risk management, and trade management.
Good luck!
All Strategies Are Good; If Managed Properly!
~Rich
Disclosure: I am part of Trade Nation's Influencer program and receive a monthly fee for using their TradingView charts in my analysis.

Could the price bounce from here?The Swissie (USD/CHF) is reacting to the pivot and could bounce to the 1st resistance.
Pivot: 0.8040
1st Support: 0.7879
1st Resistance: 0.8171
Risk Warning:
Trading Forex and CFDs carries a high level of risk to your capital and you should only trade with money you can afford to lose. Trading Forex and CFDs may not be suitable for all investors, so please ensure that you fully understand the risks involved and seek independent advice if necessary.
Disclaimer:
The above opinions given constitute general market commentary, and do not constitute the opinion or advice of IC Markets or any form of personal or investment advice.
Any opinions, news, research, analyses, prices, other information, or links to third-party sites contained on this website are provided on an "as-is" basis, are intended only to be informative, is not an advice nor a recommendation, nor research, or a record of our trading prices, or an offer of, or solicitation for a transaction in any financial instrument and thus should not be treated as such. The information provided does not involve any specific investment objectives, financial situation and needs of any specific person who may receive it. Please be aware, that past performance is not a reliable indicator of future performance and/or results. Past Performance or Forward-looking scenarios based upon the reasonable beliefs of the third-party provider are not a guarantee of future performance. Actual results may differ materially from those anticipated in forward-looking or past performance statements. IC Markets makes no representation or warranty and assumes no liability as to the accuracy or completeness of the information provided, nor any loss arising from any investment based on a recommendation, forecast or any information supplied by any third-party.

Falling towards major support?USD/CAD is falling toward he support level, which is an overlap support that aligns with the 78.6% Fibonacci projection and could bounce from this level to our take profit.
Entry: 0.8018
Why we like it:
There is an overlap support that lines up with the 78.6% Fibonacci projection.
Stop loss: 0.7972
Why we like it:
There is a pullback support that lines up with the 161.8% Fibonacci extension.
Take profit: 0.8111
Why we like it:
There is a pullback resistance.
Enjoying your TradingView experience? Review us!
Please be advised that the information presented on TradingView is provided to Vantage (‘Vantage Global Limited’, ‘we’) by a third-party provider (‘Everest Fortune Group’). Please be reminded that you are solely responsible for the trading decisions on your account. There is a very high degree of risk involved in trading. Any information and/or content is intended entirely for research, educational and informational purposes only and does not constitute investment or consultation advice or investment strategy. The information is not tailored to the investment needs of any specific person and therefore does not involve a consideration of any of the investment objectives, financial situation or needs of any viewer that may receive it. Kindly also note that past performance is not a reliable indicator of future results. Actual results may differ materially from those anticipated in forward-looking or past performance statements. We assume no liability as to the accuracy or completeness of any of the information and/or content provided herein and the Company cannot be held responsible for any omission, mistake nor for any loss or damage including without limitation to any loss of profit which may arise from reliance on any information supplied by Everest Fortune Group.

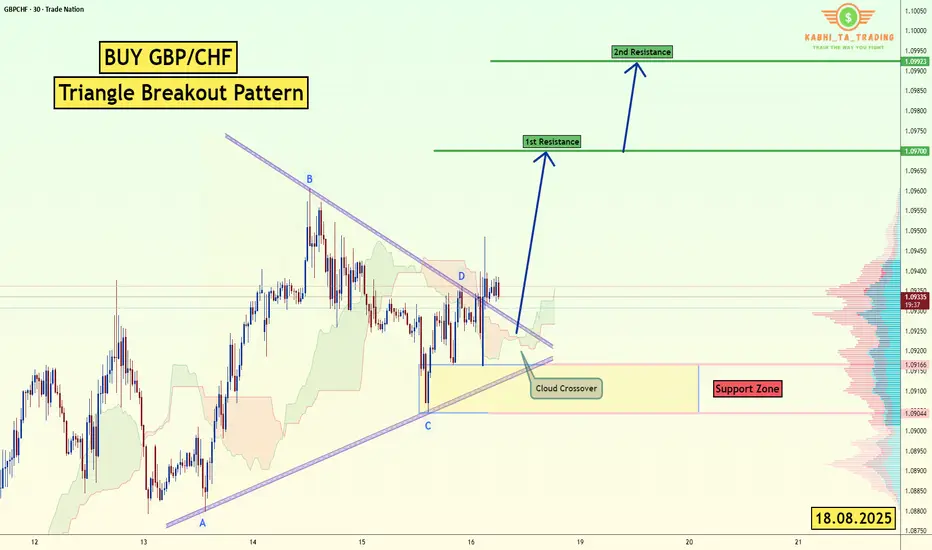
GBP/CHF - Triangle Breakout (18.08.2025) The GBP/CHF pair on the M30 timeframe presents a Potential Buying Opportunity due to a recent Formation of a Triangle Breakout Pattern. This suggests a shift in momentum towards the upside and a higher likelihood of further advances in the coming hours.
Possible Long Trade:
Entry: Consider Entering A Long Position around Trendline Of The Pattern.
Target Levels:
1st Resistance – 1.0970
2nd Resistance – 1.0993
🎁 Please hit the like button and
🎁 Leave a comment to support for My Post !
Your likes and comments are incredibly motivating and will encourage me to share more analysis with you.
Best Regards, KABHI_TA_TRADING
Thank you.
Disclosure: I am part of Trade Nation's Influencer program and receive a monthly fee for using their TradingView charts in my analysis.
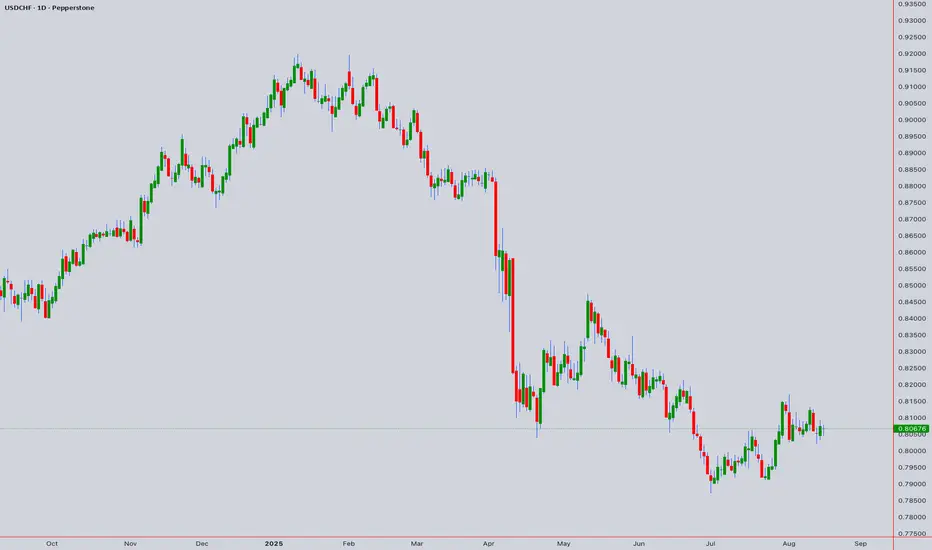
# USDCHF Technical Analysis & Forecast# USDCHF Technical Analysis & Forecast
**Base Price:** 0.80676 (August 15, 2025)
## Executive Summary
The USDCHF pair at 0.80676 presents a critical juncture with multiple technical confluences suggesting potential directional moves across various timeframes.
## Japanese Candlestick Analysis
### Intraday Patterns (5M-1H)
- **Key Reversal Patterns:** Look for Doji, Hammer, or Shooting Star formations around psychological levels
- **Continuation Patterns:** Marubozu candles indicating strong momentum
- **Support/Resistance:** 0.8050, 0.8080, 0.8100 as key levels
### Swing Patterns (4H-Monthly)
- **Engulfing Patterns:** Critical at weekly open/close levels
- **Evening/Morning Star:** Watch for three-candle reversals at major S/R
- **Harami Patterns:** Indicating potential consolidation phases
## Harmonic Pattern Analysis
### M & W Patterns
- **M-Top Formation:** Potential resistance around 0.8120-0.8150 zone
- **W-Bottom:** Support confluence near 0.7980-0.8020 region
- **Neckline:** Critical break levels at 0.8065 and 0.8085
### ABCD Patterns
- **Bullish ABCD:** Target projection to 0.8180-0.8220
- **Bearish ABCD:** Downside target 0.7920-0.7950
- **Extension Ratios:** 127.2%, 161.8%, 200% Fibonacci extensions
## Elliott Wave Analysis
### Wave Structure
- **Current Position:** Likely in Wave 4 correction of larger impulse
- **Wave 5 Target:** 0.8250-0.8300 for bullish completion
- **Alternative Count:** ABC correction with C-wave target 0.7850
### Time Projections
- **Intraday:** 2-4 hour wave cycles
- **Swing:** 5-8 day wave completions
- **Primary:** 3-5 week major wave cycles
## Wyckoff Analysis
### Market Phases
- **Accumulation Zone:** 0.7980-0.8050
- **Distribution Zone:** 0.8150-0.8250
- **Spring Test:** Watch for false breaks below 0.8000
- **Upthrust:** Potential fake breaks above 0.8200
### Volume Analysis
- **Climactic Volume:** Key reversal indicator
- **No Demand:** Weakness on rallies
- **Stopping Volume:** Support zone confirmation
## W.D. Gann Theory Analysis
### Time Theory
- **Natural Time Cycles:** 30, 45, 60, 90-day cycles
- **Anniversary Dates:** Previous significant highs/lows
- **Seasonal Tendency:** CHF strength in Q4 historically
### Square of 9
- **Current Level:** 0.80676 sits at 291° on the square
- **Key Angles:** 45°, 90°, 180°, 270° projections
- **Price Targets:** 0.8125 (315°), 0.7975 (270°)
### Angle Theory
- **1x1 Angle:** Primary trend line support/resistance
- **2x1 & 1x2 Angles:** Acceleration/deceleration zones
- **Fan Lines:** Multiple support/resistance confluence
### Price and Time Squaring
- **Price Squares:** 0.8100 (major square), 0.7900 (support square)
- **Time Squares:** 144 hours, 233 hours for next major moves
- **Geometric Relationships:** 50% retracement levels critical
## Ichimoku Kinko Hyo Analysis
### Cloud Analysis
- **Kumo Position:** Price above/below cloud significance
- **Cloud Twist:** Future support/resistance at 0.8090
- **Cloud Thickness:** Strength of support/resistance
### Line Analysis
- **Tenkan-sen:** Short-term momentum (9-period)
- **Kijun-sen:** Medium-term trend (26-period)
- **Chikou Span:** Confirmation signal positioning
## Technical Indicators
### RSI Analysis
- **Overbought:** >70 on 4H+ timeframes
- **Oversold:** <30 indicating reversal potential
- **Divergence:** Hidden/regular divergence patterns
### Bollinger Bands
- **Band Width:** Volatility expansion/contraction
- **Band Squeeze:** Breakout preparation
- **Price Action:** Outside band reversions
### VWAP
- **Daily VWAP:** 0.8055 as key pivot
- **Weekly VWAP:** 0.8020 major support
- **Volume Profile:** High volume nodes at 0.8040, 0.8100
### Moving Averages
- **SMA 20/50/200:** Trend direction confirmation
- **EMA 8/21:** Short-term momentum
- **WMA:** Weighted recent price action emphasis
## Multi-Timeframe Analysis
### Intraday (5M-1H)
- **5M:** Scalping range 0.8055-0.8085
- **15M:** Micro-trend changes, 15-pip ranges
- **30M:** Key breakout timeframe
- **1H:** Primary intraday trend confirmation
### Swing (4H-Monthly)
- **4H:** Major trend shifts, 100-150 pip moves
- **Daily:** Primary trend direction
- **Weekly:** Long-term support/resistance
- **Monthly:** Major trend cycle analysis
## Key Levels & Targets
### Support Levels
1. **0.8050** - Immediate support
2. **0.8020** - Weekly VWAP support
3. **0.7980** - Major support zone
4. **0.7950** - Monthly support
### Resistance Levels
1. **0.8085** - Immediate resistance
2. **0.8100** - Psychological resistance
3. **0.8150** - Major resistance zone
4. **0.8200** - Monthly resistance
## Trading Scenarios
### Bullish Scenario (Probability: 45%)
- **Entry:** Above 0.8090
- **Target 1:** 0.8150
- **Target 2:** 0.8220
- **Stop Loss:** Below 0.8040
### Bearish Scenario (Probability: 40%)
- **Entry:** Below 0.8050
- **Target 1:** 0.7980
- **Target 2:** 0.7920
- **Stop Loss:** Above 0.8100
### Neutral/Range Scenario (Probability: 15%)
- **Range:** 0.8040-0.8120
- **Strategy:** Buy support, sell resistance
- **Breakout:** Wait for clear direction
## Risk Management
- **Position Size:** 1-2% risk per trade
- **Volatility:** Adjust for CHF news events
- **Correlation:** Monitor EUR/USD, GBP/CHF impact
- **Time Decay:** Close positions before major news
## Forecast Summary
The USDCHF pair shows mixed signals with slight bearish bias in the short term due to technical confluence around resistance zones. Key levels to watch are the 0.8050 support and 0.8100 resistance. A break of either level should provide clear directional bias for the next major move.
For those interested in further developing their trading skills based on these types of analyses, consider exploring the mentoring program offered by Shunya dot Trade.(world wide web shunya dot trade)
I welcome your feedback on this analysis, as it will inform and enhance my future work.
Regards,
Shunya.Trade
world wide web shunya dot trade
⚠️ Disclaimer: This post is educational content and does not constitute investment advice, financial advice, or trading recommendations. The views expressed here are based on technical analysis and are shared solely for informational purposes. The stock market is subject to risks, including capital loss, and readers should exercise due diligence before investing. We do not take responsibility for decisions made based on this content. Consult a certified financial advisor for personalized guidance.
Bearish drop?The Swissie (USD/CHF) is rising towards the pivot which is a pullback resistance that lines up with the 61.8% Fibonacci retracement and could drop to the 1st support.
Pivot: 0.8088
1st Support: 0.8123
1st Resistance: 0.8159
Risk Warning:
Trading Forex and CFDs carries a high level of risk to your capital and you should only trade with money you can afford to lose. Trading Forex and CFDs may not be suitable for all investors, so please ensure that you fully understand the risks involved and seek independent advice if necessary.
Disclaimer:
The above opinions given constitute general market commentary, and do not constitute the opinion or advice of IC Markets or any form of personal or investment advice.
Any opinions, news, research, analyses, prices, other information, or links to third-party sites contained on this website are provided on an "as-is" basis, are intended only to be informative, is not an advice nor a recommendation, nor research, or a record of our trading prices, or an offer of, or solicitation for a transaction in any financial instrument and thus should not be treated as such. The information provided does not involve any specific investment objectives, financial situation and needs of any specific person who may receive it. Please be aware, that past performance is not a reliable indicator of future performance and/or results. Past Performance or Forward-looking scenarios based upon the reasonable beliefs of the third-party provider are not a guarantee of future performance. Actual results may differ materially from those anticipated in forward-looking or past performance statements. IC Markets makes no representation or warranty and assumes no liability as to the accuracy or completeness of the information provided, nor any loss arising from any investment based on a recommendation, forecast or any information supplied by any third-party.

USDCHF H4 | Bullish bounce offUSD/CHF has bounced off the buy entry which is an overlap support that aligns with the 78.6% Fibonacci projection and could rise to the take profit.
Buy entry is at 0.8019, which is an overlap support that lines up with the 78.6% Fibonacci projection.
Stop loss is at 0.7970, which is a pullback support that lines up with the 78.6% Fibonacci retracement.
Take profit is at 0.8122, which is a pullback resistance.
High Risk Investment Warning
Trading Forex/CFDs on margin carries a high level of risk and may not be suitable for all investors. Leverage can work against you.
Stratos Markets Limited (tradu.com ):
CFDs are complex instruments and come with a high risk of losing money rapidly due to leverage. 65% of retail investor accounts lose money when trading CFDs with this provider. You should consider whether you understand how CFDs work and whether you can afford to take the high risk of losing your money.
Stratos Europe Ltd (tradu.com ):
CFDs are complex instruments and come with a high risk of losing money rapidly due to leverage. 66% of retail investor accounts lose money when trading CFDs with this provider. You should consider whether you understand how CFDs work and whether you can afford to take the high risk of losing your money.
Stratos Global LLC (tradu.com ):
Losses can exceed deposits.
Please be advised that the information presented on TradingView is provided to Tradu (‘Company’, ‘we’) by a third-party provider (‘TFA Global Pte Ltd’). Please be reminded that you are solely responsible for the trading decisions on your account. There is a very high degree of risk involved in trading. Any information and/or content is intended entirely for research, educational and informational purposes only and does not constitute investment or consultation advice or investment strategy. The information is not tailored to the investment needs of any specific person and therefore does not involve a consideration of any of the investment objectives, financial situation or needs of any viewer that may receive it. Kindly also note that past performance is not a reliable indicator of future results. Actual results may differ materially from those anticipated in forward-looking or past performance statements. We assume no liability as to the accuracy or completeness of any of the information and/or content provided herein and the Company cannot be held responsible for any omission, mistake nor for any loss or damage including without limitation to any loss of profit which may arise from reliance on any information supplied by TFA Global Pte Ltd.
The speaker(s) is neither an employee, agent nor representative of Tradu and is therefore acting independently. The opinions given are their own, constitute general market commentary, and do not constitute the opinion or advice of Tradu or any form of personal or investment advice. Tradu neither endorses nor guarantees offerings of third-party speakers, nor is Tradu responsible for the content, veracity or opinions of third-party speakers, presenters or participants.
