Bearish reversal off key resistance?EUR/CHF has rejected off the resistance that aligns with the 61.8% Fibonacci retracement and could drop from this level to our take profit.
Entry: 0.93257
Why we like it:
There is an overlap resistance that aligns with the 61.8% Fibonacci retracement.
Stop loss: 0.93606
Why we like it:
There is a pullback resistance level.
Take profit: 0.92574
Why we like it:
There is a pullback support level.
Enjoying your TradingView experience? Review us!
Please be advised that the information presented on TradingView is provided to Vantage (‘Vantage Global Limited’, ‘we’) by a third-party provider (‘Everest Fortune Group’). Please be reminded that you are solely responsible for the trading decisions on your account. There is a very high degree of risk involved in trading. Any information and/or content is intended entirely for research, educational and informational purposes only and does not constitute investment or consultation advice or investment strategy. The information is not tailored to the investment needs of any specific person and therefore does not involve a consideration of any of the investment objectives, financial situation or needs of any viewer that may receive it. Kindly also note that past performance is not a reliable indicator of future results. Actual results may differ materially from those anticipated in forward-looking or past performance statements. We assume no liability as to the accuracy or completeness of any of the information and/or content provided herein and the Company cannot be held responsible for any omission, mistake nor for any loss or damage including without limitation to any loss of profit which may arise from reliance on any information supplied by Everest Fortune Group.
Chf

USDCHF H4 | Bearish Reversal?The price has rejected off our sell entry level at 0.7992, which acts as an overlap resistance that aligns with the 61.8% Fibonacci retracement.
Our stop loss is set at 0.8025, which is a pullback resistance that is slightly below the 78.6% Fibonacci retracement.
Take profit is set at 0.7942, which is a pullback support that aligns with the 50% Fibonacci retracement.
High Risk Investment Warning
Stratos Markets Limited (

Potential bullish reversal?Swissie (USD/CHF) could make a short-term pullback to the pivot, which acts as a pullback support and could bounce to the 1st resistance.
Pivot: 0.7959
1st Support: 0.7855
1st Resistance: 0.8104
Disclaimer:
The opinions given above constitute general market commentary and do not constitute the opinion or advice of IC Markets or any form of personal or investment advice.
Any opinions, news, research, analyses, prices, other information, or links to third-party sites contained on this website are provided on an "as-is" basis, are intended to be informative only, and are not advice, a recommendation, research, a record of our trading prices, an offer of, or solicitation for, a transaction in any financial instrument and thus should not be treated as such. The information provided does not involve any specific investment objectives, financial situation, or needs of any specific person who may receive it. Please be aware that past performance is not a reliable indicator of future performance and/or results. Past performance or forward-looking scenarios based upon the reasonable beliefs of the third-party provider are not a guarantee of future performance. Actual results may differ materially from those anticipated in forward-looking or past performance statements. IC Markets makes no representation or warranty and assumes no liability as to the accuracy or completeness of the information provided, nor any loss arising from any investment based on a recommendation, forecast, or any information supplied by any third party

Potential bullish rise?USD/Chf could make a short-term pullback to the support level, which has been identified as a pullback support, and could bounce from this level to our take profit.
Entry: 0.7966
Why we like it:
There is a pullback support level.
Stop loss: 0.7910
Why we like it:
There is an overlap support level.
Take profit: 0.8048
Why we like it:
There is a pullback resistance level.
Enjoying your TradingView experience? Review us!
Please be advised that the information presented on TradingView is provided to Vantage (‘Vantage Global Limited’, ‘we’) by a third-party provider (‘Everest Fortune Group’). Please be reminded that you are solely responsible for the trading decisions on your account. There is a very high degree of risk involved in trading. Any information and/or content is intended entirely for research, educational and informational purposes only and does not constitute investment or consultation advice or investment strategy. The information is not tailored to the investment needs of any specific person and therefore does not involve a consideration of any of the investment objectives, financial situation or needs of any viewer that may receive it. Kindly also note that past performance is not a reliable indicator of future results. Actual results may differ materially from those anticipated in forward-looking or past performance statements. We assume no liability as to the accuracy or completeness of any of the information and/or content provided herein and the Company cannot be held responsible for any omission, mistake nor for any loss or damage including without limitation to any loss of profit which may arise from reliance on any information supplied by Everest Fortune Group.

USDCHF H4 | Could We See A ReversalThe price is reacting off our sell entry level at 0.7992, which is an overlap resistance that lines up with the 61.8% Fibonacci retracement and the 78.6% Fibonacci projection.
Our stop loss is set at 0.8025, which is a pullback resistance that is slightly below the 78.6% Fibonacci retracement.
Our take profit is set at 0.7942, which is a pullback support that aligns with the 38.2% Fibonacci retracement.
High Risk Investment Warning
Stratos Markets Limited (

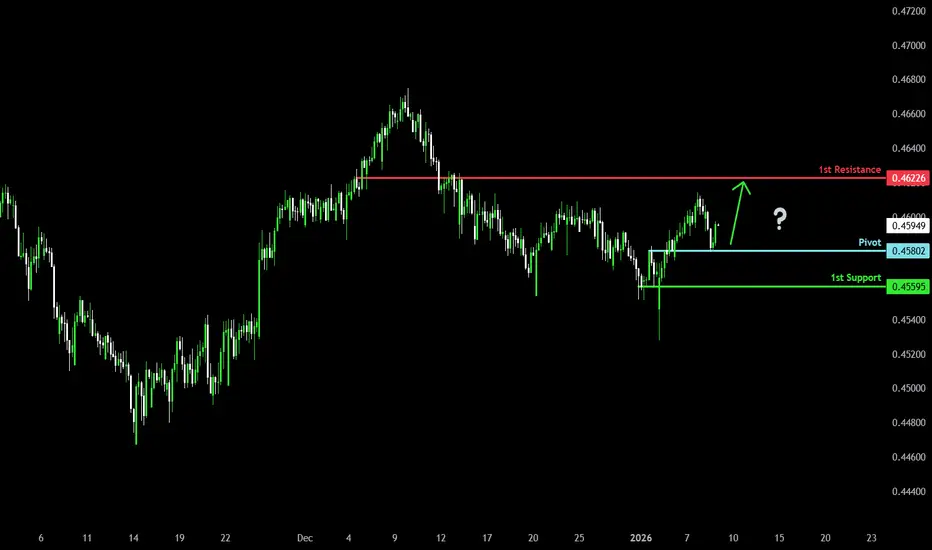
Bullish bounce off?NZD/CHF has bounced off the pivot and could rise to the 1st resistance.
Pivot: 0.45802
1st Support: 0.45595
1st Resistance: 0.46226
Disclaimer:
The opinions given above constitute general market commentary and do not constitute the opinion or advice of IC Markets or any form of personal or investment advice.
Any opinions, news, research, analyses, prices, other information, or links to third-party sites contained on this website are provided on an "as-is" basis, are intended to be informative only, and are not advice, a recommendation, research, a record of our trading prices, an offer of, or solicitation for, a transaction in any financial instrument and thus should not be treated as such. The information provided does not involve any specific investment objectives, financial situation, or needs of any specific person who may receive it. Please be aware that past performance is not a reliable indicator of future performance and/or results. Past performance or forward-looking scenarios based upon the reasonable beliefs of the third-party provider are not a guarantee of future performance. Actual results may differ materially from those anticipated in forward-looking or past performance statements. IC Markets makes no representation or warranty and assumes no liability as to the accuracy or completeness of the information provided, nor any loss arising from any investment based on a recommendation, forecast, or any information supplied by any third party
USDCHF Moment of truth on the 1D MA200 is coming.The USDCHF pair is on a strong rise since its December 26 2025 Low, which is technically the Bullish Leg of the long-term Descending Triangle. Today it is testing the 1D MA50 (blue trend-line) and if broken, will be the perfect buy continuation signal.
If it breaks, buy and target a potential 1D MA200 (orange trend-line) test at 0.80350. This will be the market's most important test for 2026 as the 1D MA200 has been untouched since April 03 2025.
If it breaks, the long-term trend most likely shifts to bullish, but even on the short-term we can again engage into a quick buy, targeting the top (Lower Highs trend-line) of the Descending Triangle at 0.80650, which is also the 0.786 Fibonacci retracement level (where the previous Lower High was priced).
---
** Please LIKE 👍, FOLLOW ✅, SHARE 🙌 and COMMENT ✍ if you enjoy this idea! Also share your ideas and charts in the comments section below! This is best way to keep it relevant, support us, keep the content here free and allow the idea to reach as many people as possible. **
---
💸💸💸💸💸💸
👇 👇 👇 👇 👇 👇

Bearish reevrsal off Fib confluenceSwissie (USD/CHF) is rising towards the pivot, which is an overlap resistance and could reverse to the 1st support, which is a pullback support.
Pivot: 0.7992
1st Support: 0.7934
1st Resistance: 0.8025
Disclaimer:
The opinions given above constitute general market commentary and do not constitute the opinion or advice of IC Markets or any form of personal or investment advice.
Any opinions, news, research, analyses, prices, other information, or links to third-party sites contained on this website are provided on an "as-is" basis, are intended to be informative only, and are not advice, a recommendation, research, a record of our trading prices, an offer of, or solicitation for, a transaction in any financial instrument and thus should not be treated as such. The information provided does not involve any specific investment objectives, financial situation, or needs of any specific person who may receive it. Please be aware that past performance is not a reliable indicator of future performance and/or results. Past performance or forward-looking scenarios based upon the reasonable beliefs of the third-party provider are not a guarantee of future performance. Actual results may differ materially from those anticipated in forward-looking or past performance statements. IC Markets makes no representation or warranty and assumes no liability as to the accuracy or completeness of the information provided, nor any loss arising from any investment based on a recommendation, forecast, or any information supplied by any third party

Bullish rise?NZD/CHF has reacted off the pivot and could rise to the 1st resistance, which is a pullback resistance.
Pivot: 0.45802
1st Support: 0.4542
1st Resistance: 0.46226
Disclaimer:
The opinions given above constitute general market commentary and do not constitute the opinion or advice of IC Markets or any form of personal or investment advice.
Any opinions, news, research, analyses, prices, other information, or links to third-party sites contained on this website are provided on an "as-is" basis, are intended to be informative only, and are not advice, a recommendation, research, a record of our trading prices, an offer of, or solicitation for, a transaction in any financial instrument and thus should not be treated as such. The information provided does not involve any specific investment objectives, financial situation, or needs of any specific person who may receive it. Please be aware that past performance is not a reliable indicator of future performance and/or results. Past performance or forward-looking scenarios based upon the reasonable beliefs of the third-party provider are not a guarantee of future performance. Actual results may differ materially from those anticipated in forward-looking or past performance statements. IC Markets makes no representation or warranty and assumes no liability as to the accuracy or completeness of the information provided, nor any loss arising from any investment based on a recommendation, forecast, or any information supplied by any third party

USDCHF RANGE TRADE LONGSUSDCHF has been trading in the range highlighted since July it looks like we have found support at the bottom of this and buyers have started the next leg up back to the upper bounds of the range

Could we see a reversal from here?Swissie (USD/CHF) is falling towards the pivot, which acts as a pullback support and could bounce to the 1st resistance.
Pivot: 0.7892
1st Support: 0.7859
1st Resistance: 0.7967
Disclaimer:
The opinions given above constitute general market commentary and do not constitute the opinion or advice of IC Markets or any form of personal or investment advice.
Any opinions, news, research, analyses, prices, other information, or links to third-party sites contained on this website are provided on an "as-is" basis, are intended to be informative only, and are not advice, a recommendation, research, a record of our trading prices, an offer of, or solicitation for, a transaction in any financial instrument and thus should not be treated as such. The information provided does not involve any specific investment objectives, financial situation, or needs of any specific person who may receive it. Please be aware that past performance is not a reliable indicator of future performance and/or results. Past performance or forward-looking scenarios based upon the reasonable beliefs of the third-party provider are not a guarantee of future performance. Actual results may differ materially from those anticipated in forward-looking or past performance statements. IC Markets makes no representation or warranty and assumes no liability as to the accuracy or completeness of the information provided, nor any loss arising from any investment based on a recommendation, forecast, or any information supplied by any third party

USDCHF H1 | Falling Towards 50% Fib SupportThe price is falling towards our buy entry level at 0.7924, which is a pullback support that aligns with the 50% Fibonacci retracement.
Our stop loss is set at 0.7900, which is an overlap support.
Our take profit is set at 0.7965, which is a pullback resistance that aligns with the 78.6% Fibonacci retracment.
High Risk Investment Warning
Stratos Markets Limited (

Bearish reversal?Swissie (USD/CHF) is rising towards the pivot, which is a pullback resistance and could reverse to the 1st support, which has been identified as a multi-swing low support.
1st Support: 0.7990
1st Support: 0.7855
1st Resistance: 0.81041
Disclaimer:
The opinions given above constitute general market commentary and do not constitute the opinion or advice of IC Markets or any form of personal or investment advice.
Any opinions, news, research, analyses, prices, other information, or links to third-party sites contained on this website are provided on an "as-is" basis, are intended to be informative only, and are not advice, a recommendation, research, a record of our trading prices, an offer of, or solicitation for, a transaction in any financial instrument and thus should not be treated as such. The information provided does not involve any specific investment objectives, financial situation, or needs of any specific person who may receive it. Please be aware that past performance is not a reliable indicator of future performance and/or results. Past performance or forward-looking scenarios based upon the reasonable beliefs of the third-party provider are not a guarantee of future performance. Actual results may differ materially from those anticipated in forward-looking or past performance statements. IC Markets makes no representation or warranty and assumes no liability as to the accuracy or completeness of the information provided, nor any loss arising from any investment based on a recommendation, forecast, or any information supplied by any third party

Trapp or not What we will see 2026! USD-CHFLet’s be clear:
CHF = safety
USD = confidence
CAPITALCOM:USDCHF
Right now?
Confidence is… selective. US politics still noisy: elections, fiscal pressure, debt, geopolitics.
Market reaction? Simple, when uncertainty rises, money hides in CHF. Switzerland doesn’t shout. SNB doesn’t panic. CHF just stays strong and lets others make mistakes.
That’s why every USD rally feels fragile.
Technical side
Now the chart says the same thing, just without words.
0.79–0.80 = political + technical resistance
This zone is where:
late bulls enter
smart money distributes
And the price starts hesitating.
What price is telling us??? This move up is not impulsive.
No expansion. No clean higher highs. That’s correction behavior, not trend reversal.
Scenario 1 – Most likely
Price tests 0.79–0.80
Politicians talk
Market shrugs rejection!!!
Then:
0.785 breaks
0.78 tested
Below 0.78 → momentum accelerates
Market loves to punish impatience.
Scenario 2– 0.70 story
Not today.
Not tomorrow.
But if:
US political risk increases
Global risk-off returns
0.77 breaks structurally
Then yes…
0.72 → 0.70 becomes a technical destination, not a prediction.
CHF doesn’t need permission.
My Idea
Below 0.80 → I stay suspicious
Politics creates volatility, structure decides direction
I don’t marry narratives, I follow levels
Calm CHF. Nervous USD.
Market patience wins again.
Trade what you see. Ignore what they promise.

Bearish reversal off pullback resistance?Swissie (USD/CHF) is rising towards the pivot, which is a pullback resistance that aligns with the 38.2% Fibonacci retracement and could reverse to the 1st support.
Pivot: 0.7945
1st Support: 0.7891
1st Resistance: 0.7979
Disclaimer:
The opinions given above constitute general market commentary and do not constitute the opinion or advice of IC Markets or any form of personal or investment advice.
Any opinions, news, research, analyses, prices, other information, or links to third-party sites contained on this website are provided on an "as-is" basis, are intended to be informative only, and are not advice, a recommendation, research, a record of our trading prices, an offer of, or solicitation for, a transaction in any financial instrument and thus should not be treated as such. The information provided does not involve any specific investment objectives, financial situation, or needs of any specific person who may receive it. Please be aware that past performance is not a reliable indicator of future performance and/or results. Past performance or forward-looking scenarios based upon the reasonable beliefs of the third-party provider are not a guarantee of future performance. Actual results may differ materially from those anticipated in forward-looking or past performance statements. IC Markets makes no representation or warranty and assumes no liability as to the accuracy or completeness of the information provided, nor any loss arising from any investment based on a recommendation, forecast, or any information supplied by any third party

Heading towards key resistance?EUR/CHF is rising towards the resistance level, which is an overlap resistance that aligns with the 61.8% Fibonacci retracement and could reverse from this level to our take profit.
Entry: 0.92574
Why we like it:
There is an overlap resistance that aligns with the 61.8% Fibonacci retracement.
Stop loss: 0.93628
Why we lik eit:
There is a pullback resistance level.
Take profit: 0.92574
Why we like it:
There is an overlap support level.
Enjoying your TradingView experience? Review us!
Please be advised that the information presented on TradingView is provided to Vantage (‘Vantage Global Limited’, ‘we’) by a third-party provider (‘Everest Fortune Group’). Please be reminded that you are solely responsible for the trading decisions on your account. There is a very high degree of risk involved in trading. Any information and/or content is intended entirely for research, educational and informational purposes only and does not constitute investment or consultation advice or investment strategy. The information is not tailored to the investment needs of any specific person and therefore does not involve a consideration of any of the investment objectives, financial situation or needs of any viewer that may receive it. Kindly also note that past performance is not a reliable indicator of future results. Actual results may differ materially from those anticipated in forward-looking or past performance statements. We assume no liability as to the accuracy or completeness of any of the information and/or content provided herein and the Company cannot be held responsible for any omission, mistake nor for any loss or damage including without limitation to any loss of profit which may arise from reliance on any information supplied by Everest Fortune Group.

USDCHF H1 | Potential Bullish RiseBased on the H1 chart analysis, we can see that the price has bounced off our buy entry level at 156.31, which is a pullback support.
Our stop loss is set at 155.76, which is a pullback support.
Our take profit is set at 157.27, which is a pullback resistance that is slightly below the 161.8% Fibonacci extension.
High Risk Investment Warning
Stratos Markets Limited (

USDCHF H1 | Bearish Reversal Off Pullback ResistanceThe price is rising towards our sell entry level at 0.7937, which is a pullback resistance that is slightly below the 78.6% Fibonacci retracement.
Our stop loss is set at 0.7958, which is a pullback resistance.
Our take profit is at 0.7906, which is a pullback support.
High Risk Investment Warning
Stratos Markets Limited (

Potential bullish rise?CAD/CHF has reacted off the pivot and could rise to the 1st resistance.
Pivot: 0.57802
1st Support: 0.57621
1st Resistance: 0.58186
Disclaimer:
The opinions given above constitute general market commentary and do not constitute the opinion or advice of IC Markets or any form of personal or investment advice.
Any opinions, news, research, analyses, prices, other information, or links to third-party sites contained on this website are provided on an "as-is" basis, are intended to be informative only, and are not advice, a recommendation, research, a record of our trading prices, an offer of, or solicitation for, a transaction in any financial instrument and thus should not be treated as such. The information provided does not involve any specific investment objectives, financial situation, or needs of any specific person who may receive it. Please be aware that past performance is not a reliable indicator of future performance and/or results. Past performance or forward-looking scenarios based upon the reasonable beliefs of the third-party provider are not a guarantee of future performance. Actual results may differ materially from those anticipated in forward-looking or past performance statements. IC Markets makes no representation or warranty and assumes no liability as to the accuracy or completeness of the information provided, nor any loss arising from any investment based on a recommendation, forecast, or any information supplied by any third party

Bearish reversal?NZD/CHF has rejected off the pivot and could drop to the 1st support, which is a pullback support that aligns with the 61.8% Fibonacci projection.
Pivot: 0.45973
1st Support: 0.45384
1st Resistance: 0.46222
Disclaimer:
The opinions given above constitute general market commentary and do not constitute the opinion or advice of IC Markets or any form of personal or investment advice.
Any opinions, news, research, analyses, prices, other information, or links to third-party sites contained on this website are provided on an "as-is" basis, are intended to be informative only, and are not advice, a recommendation, research, a record of our trading prices, an offer of, or solicitation for, a transaction in any financial instrument and thus should not be treated as such. The information provided does not involve any specific investment objectives, financial situation, or needs of any specific person who may receive it. Please be aware that past performance is not a reliable indicator of future performance and/or results. Past performance or forward-looking scenarios based upon the reasonable beliefs of the third-party provider are not a guarantee of future performance. Actual results may differ materially from those anticipated in forward-looking or past performance statements. IC Markets makes no representation or warranty and assumes no liability as to the accuracy or completeness of the information provided, nor any loss arising from any investment based on a recommendation, forecast, or any information supplied by any third party

Could we see a bounce from here?The USD/CHF could fall towards the support level, which serves as a pullback support that aligns with the 50% Fibonacci retracement, and then bounce from this level to our take-profit.
Entry: 0.7895
Why we like it:
There is a pullback support level that aligns with ht e 50% Fibonacci retracement
Stop loss: 0.7871
Why we like it:
There is a pullback support level.
Take profit: 0.7933
Why we like it:
There is a pullback resistance level.
Enjoying your TradingView experience? Review us!
Please be advised that the information presented on TradingView is provided to Vantage (‘Vantage Global Limited’, ‘we’) by a third-party provider (‘Everest Fortune Group’). Please be reminded that you are solely responsible for the trading decisions on your account. There is a very high degree of risk involved in trading. Any information and/or content is intended entirely for research, educational and informational purposes only and does not constitute investment or consultation advice or investment strategy. The information is not tailored to the investment needs of any specific person and therefore does not involve a consideration of any of the investment objectives, financial situation or needs of any viewer that may receive it. Kindly also note that past performance is not a reliable indicator of future results. Actual results may differ materially from those anticipated in forward-looking or past performance statements. We assume no liability as to the accuracy or completeness of any of the information and/or content provided herein and the Company cannot be held responsible for any omission, mistake nor for any loss or damage including without limitation to any loss of profit which may arise from reliance on any information supplied by Everest Fortune Group.

EURCHF H4 | Bearish Reversal Off 38.2% Fib ResistanceBased on the H4 chart analysis, we could see the price rise to our sell entry level at 0.93134, which is a pullback resistance that aligns with the 38.2% Fibonacci retracement.
Our stop loss is set at 0.93324, which is a pullback resistance that aligns with the 61.8% Fibonacci retracement.
Our take profit is set at 0.92595, whichis a pullback support that aligns with the 61.8% Fibonacci retracement.
High Risk Investment Warning
Stratos Markets Limited (

GBPCHF H4 | Bullish RiseBased on the H4 chart analysis, we can see that the price has bounced off our buy entry level at 1.0624, which is an overlap support.
Our stop loss is set at 1.0590, which is a pullback support.
Our take profit is set at 1.0710, which is a pullback resistance.
High Risk Investment Warning
Stratos Markets Limited (
