BTC/USDT | More Bullish Move Ahead ? Let's See!By analyzing the CRYPTOCAP:BTC chart on the Daily timeframe, we can now confirm a powerful breakout above previous resistance. Bitcoin surged to $94,800 and is currently trading around $92,500.
If price manages to sustain above the key $90,000 level, the bullish scenario strengthens, and we may see an extension toward higher targets. The next key resistance zones to watch are $97,000, $99,000, $101,400, and $104,000.
The bias has shifted from bearish to bullish, but only if $90K holds as new support. Momentum remains in buyers’ hands as long as structure and volume confirm this shift.
Please support me with your likes and comments to motivate me to share more analysis with you and share your opinion about the possible trend of this chart with me !
Best Regards , Arman Shaban
Chiliz

Chiliz CHZ price analysis🎆 Is someone launching a New Year firework on the OKX:CHZUSDT chart?
Over the past 3 months, CRYPTOCAP:CHZ has shown much stronger price stability than most altcoins.
While the broader market struggles, #Chiliz keeps holding its ground — and that already says a lot.
📍 Right now, price is pressing against a key decision zone around $0.45.
This level may define the next major move.
📈 A clean breakout above $0.45 could open the way toward the trend resistance at $0.60–0.62.
🎄 So if markets get quiet during the New Year holidays — CRYPTOCAP:CHZ might be worth watching closely.
🤔 Is this just a short-term hype move, or are buyers quietly preparing a bigger push?
______________
◆ Follow us ❤️ for daily crypto insights & updates!
🚀 Don’t miss out on important market moves
🧠 DYOR | This is not financial advice, just thinking out loud

CHZ will be bullish in Q1 2026Hello Traders,
CHZ will be bullish in Q1 2026 due to the World Cup.
Will come back to this idea later.

CHZ mid-term TAChiliz can be an outperformer on crypto market in the upcoming weeks or months, as of now the volumes on CHZ have accelerated and there's a positive accumulation on weekly time frame as well, it's yet in the early stage of bullish formation but it's something to keep an eye on.
Recently they have announced a partnership with Assetera and that could be a price pusher.

CHZ Looks Bullihs (2H)It appears that an ABC pattern has formed on the chart, with wave B being a completed diametric pattern. We are now only looking for an entry opportunity for a buy/long position, with the low-risk zone highlighted in green on the chart.
The targets are also marked on the chart.
A 4-hour candle closing below the invalidation level will invalidate this analysis.
For risk management, please don't forget stop loss and capital management
When we reach the first target, save some profit and then change the stop to entry
Comment if you have any questions
Thank You

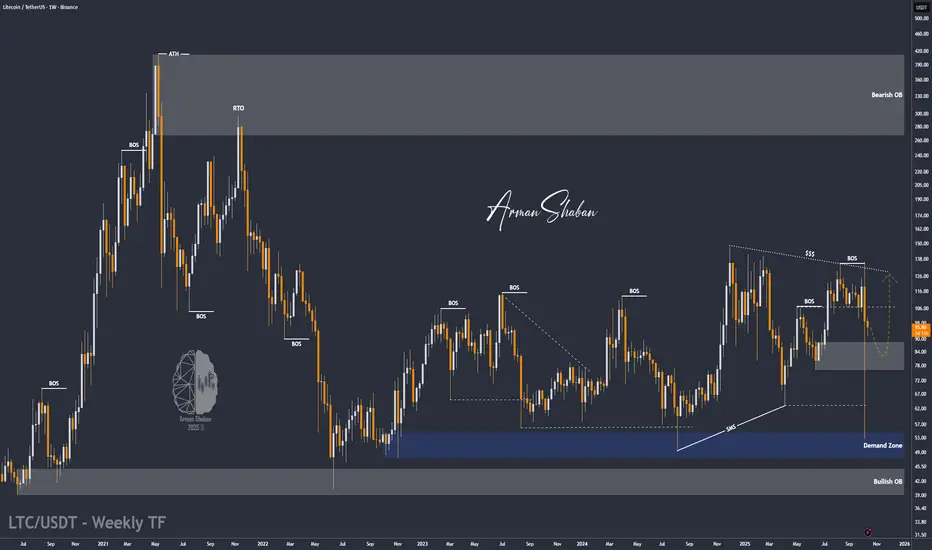
LTC/USDT | LTC Holding Strong Above Support – Breakout Incoming?By analyzing the Litecoin (LTC) chart on the weekly (logarithmic) timeframe, we can see that the price has risen to $100, successfully hitting the first target from the previous analysis.
Currently, LTC is trading around $96, and it’s important to see whether the price can hold above the $76–$88 support zone. If it does, we could expect a strong bullish move ahead. The next targets are $114 and $120.
Please support me with your likes and comments to motivate me to share more analysis with you and share your opinion about the possible trend of this chart with me !
Best Regards , Arman Shaban
BTC/USD | BTC Crashes to $102K, Then Bounces Back – Still UnstabBy analyzing the Bitcoin (BTC) chart on the 12-hour timeframe, we can see that last night, following Trump’s tweet, the market faced a sharp sell-off, with BTC dropping all the way down to $102,000. After hitting this key demand zone, Bitcoin bounced back strongly, rallying up to $115,000, and is now trading around $110,000.
However, BTC still looks unstable, struggling to hold steady — to continue its bullish trend, it must stay above $110K. If it fails to hold this level, we could see the price dip below $100K again. This analysis will be updated soon as the market develops.
Please support me with your likes and comments to motivate me to share more analysis with you and share your opinion about the possible trend of this chart with me !
Best Regards , Arman Shaban

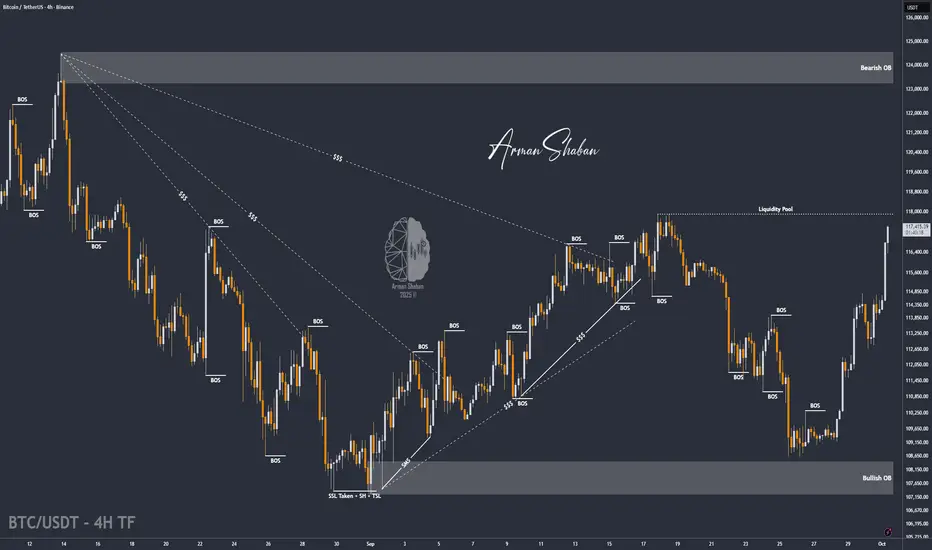
BTC/USDT | BTC Rally +7% Gains – Bulls Still in Control (READ)By analyzing the Bitcoin chart on the 4-hour timeframe, we can see that the price continued its rally as expected, hitting the $115K target and now reaching up to $117,200, just one step away from the next target at $118K. So far, this analysis has delivered more than 7% gains. I hope you made the most out of it!
Please support me with your likes and comments to motivate me to share more analysis with you and share your opinion about the possible trend of this chart with me !
Best Regards , Arman Shaban
Chiliz $CHZ ! IMPORTANT! Chiliz ( GETTEX:CHZ ) Technical Analysis: Bullish Scenario and Key Levels
Chiliz ( GETTEX:CHZ ) trades at approximately $0.0394 USDT, with a market cap around $360 million and 24-hour volume over $50 million. The token is down 1.4% in the last 24 hours but up 10% over the past day amid broader market recovery, though it's declined 15% monthly and 25% year-to-date. GETTEX:CHZ remains in a multi-year downtrend from its 2021 ATH of $0.877, but recent breakouts from descending patterns signal potential reversal, especially with fan token ecosystem growth in sports and esports. Sentiment on X is increasingly bullish, citing pennant breakouts and trendline breaks, though some note resistance hurdles.
Fundamentals center on the Chiliz Chain for fan engagement tokens (e.g., Socios platform), with partnerships like FC Barcelona and UFC driving utility. High circulating supply (9.1 billion out of 8.8 billion total—post-burns) caps upside, but historical pumps (3,500% in 2021) highlight altseason potential if crypto rallies post-rate cuts.
#### Overall Chart Structure and Technical Setup
On daily/weekly charts (CHZ/USDT), GETTEX:CHZ has broken a downward trendline from summer highs, ending the corrective phase and forming a bullish pennant breakout. Volume is rising with bullish candles dominating near lows, suggesting accumulation. Indicators: RSI (14) at 45-50 (neutral, poised for bullish cross), MACD showing early divergence, and EMAs aligning bullishly above 50/100-day. Weekly reversal candle supports ending the 1,000+ day bear cycle.
#### Bullish Scenario
A hold above key support could spark a multi-wave rally on altcoin momentum or platform news (e.g., new fan tokens). Outlook:
1. **Short-Term Breakout (1-4 Weeks):** Consolidate at $0.038-$0.040, break $0.045 (EMA200) for 15-25% gains to $0.046-$0.048. Confirm with RSI >60 and volume spike.
2. **Medium-Term Rally (1-3 Months):** Clear $0.05 (major resistance) accelerates to $0.06-$0.08, a 50-100% move, mirroring 2021 patterns.
3. **Long-Term Bullish Wave (2025 Outlook):** Break $0.10 confirms full reversal, targeting $0.106 (conservative) or $0.63 in altseason—up 1,500%+. Optimistic end-2025 forecasts hit $0.042-$0.10, with risks from macro dips.
#### Key Levels to Watch
- **Support Levels:**
- Immediate: $0.0376 (24h low) – Key hold for invalidation.
- Major: $0.038-$0.040 – Demand zone; break risks $0.03 retest.
- **Resistance Levels:**
- Near-Term: $0.045 – EMA cluster; breakout ignites pump.
- Intermediate: $0.05 – Psychological/former support; clear for $0.06.
- Long-Term: $0.10 – Bull resumption trigger.
#### Risks and Considerations
Bullish if support holds, but high-risk from low liquidity and market volatility. Watch volume >20% average and news. Tight stops below support; scale on dips. Not financial advice—DYOR and manage risk.

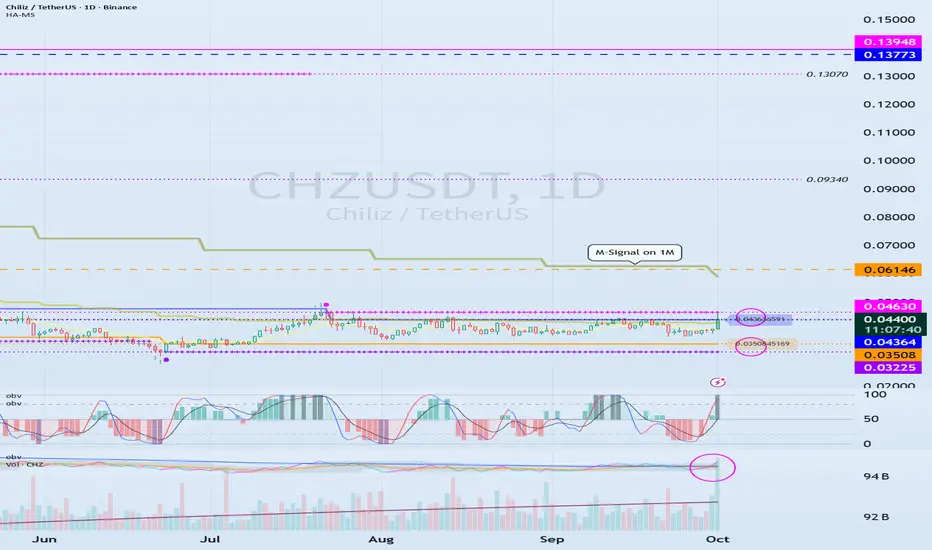
See if we can break above 0.04364-0.04630
Hello, fellow traders!
Follow us to get the latest updates quickly.
Have a great day!
-------------------------------------
(CHZUSDT 1D chart)
The OBV indicator is showing an upward break above the EMA 2 indicator.
If the price rises above the 0.04364-0.04630 range, it is expected to continue its upward trend.
However, since the price is below the M-Signal indicator on the 1M chart, a quick and quick response is required when trading.
Therefore, if possible, it is recommended to confirm that the price rises above the M-Signal indicator on the 1M chart, providing support, before trading.
-
(1M chart)
If the price rises above the M-Signal indicator on the 1M chart, it is highly likely that the price will attempt to rise to around 0.20790.
------------------------------------------
Considering the above, for medium- to long-term investment, it is recommended to buy when the price rises above the 0.04364-0.04630 range, providing support.
If you're looking to make a short-term investment, it's best to buy when the price rises above the M-Signal indicator on the 1M chart and shows signs of support.
Buying at a low price doesn't always lead to profits.
This is because some investors may not be able to wait for the price to rise and may give up midway.
Therefore, you should calmly consider your investment horizon for the altcoin you're currently considering.
Your investment size and trading strategy will vary depending on your investment horizon.
-
Thank you for reading to the end.
I wish you successful trading.
--------------------------------------------------
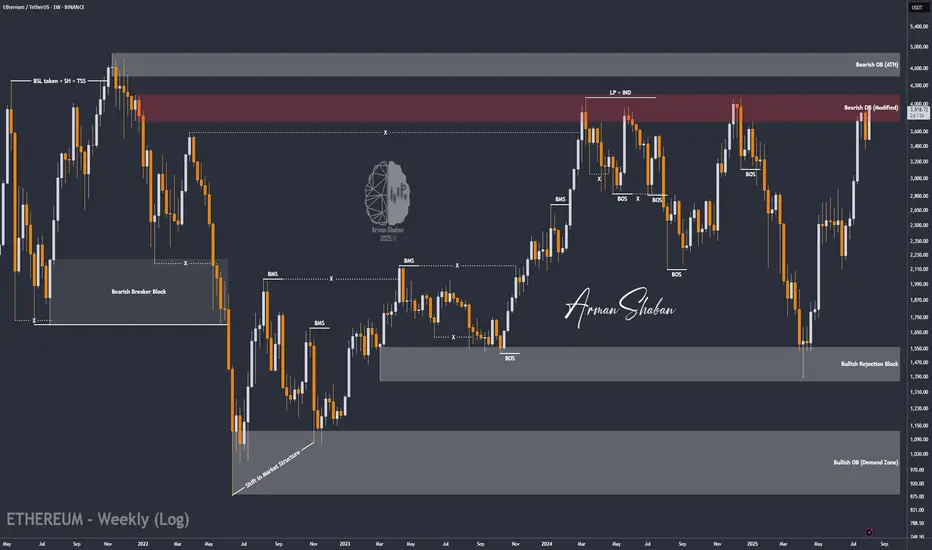
ETH/USDT | Ethereum Eyes $5,100, $5,500 & $6,000 – New ATH AheadBy analyzing the Ethereum chart on the weekly timeframe, we can see that the price is still trading around $4,400. If it holds above the $3,900 level, I expect a strong bullish wave toward new targets and fresh all-time highs.
Given the current momentum, this bullish move could start soon, with possible targets at $5,100, $5,500, and $6,000.
Please support me with your likes and comments to motivate me to share more analysis with you and share your opinion about the possible trend of this chart with me !
Best Regards , Arman Shaban

ETH/USDT | ETH Surges 18% – Next Targets Above $4000 in Sight!By analyzing the Ethereum chart on the weekly timeframe, we can see that, as expected, the price continued its rally, gaining over 18% and reaching $3969. It is now trading around $3915, and I expect this bullish momentum to continue, with the price soon pushing above $4000. The next targets are $4100, $4400, and $4900. This analysis will be updated soon!
Please support me with your likes and comments to motivate me to share more analysis with you and share your opinion about the possible trend of this chart with me !
Best Regards , Arman Shaban
DOGE/USDT | Eyes Bounce from Key Support – Next Targets Ahead!By analyzing the Dogecoin chart on the daily timeframe, we can see that after reaching the $0.29 area, the price entered a correction and is now trading around $0.22. If DOGE dips into the key support zone between $0.19–$0.21, we could expect a strong bullish reaction. The next potential targets are $0.287, $0.32, $0.41, and $0.70.
Please support me with your likes and comments to motivate me to share more analysis with you and share your opinion about the possible trend of this chart with me !
Best Regards , Arman Shaban

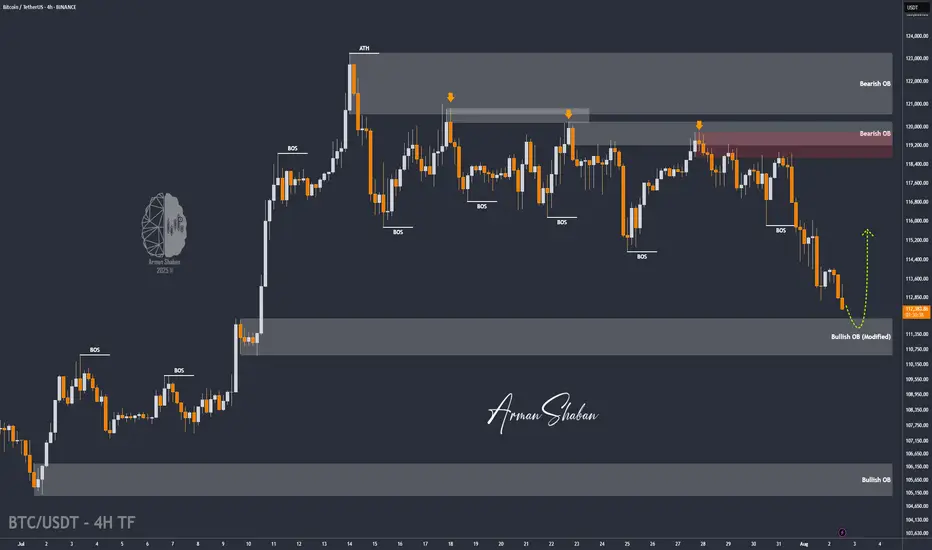
BTC/USDT | Bitcoin Eyes Rebound from $110K Support Zone! (READ)By analyzing the Bitcoin chart on the 4-hour timeframe, we can see that after reaching a new high at $123,218, the price began to pull back and has now corrected down to around $112,500. I expect the current volatility to ease soon. The next critical support zone lies between $110,500–$112,000 — watch price action closely here, as BTC could bounce from this area and push back toward $116,000+. Other key demand zones are located at $109,000, $107,900, and the $105,000–$106,000 range.
Please support me with your likes and comments to motivate me to share more analysis with you and share your opinion about the possible trend of this chart with me !
Best Regards , Arman Shaban
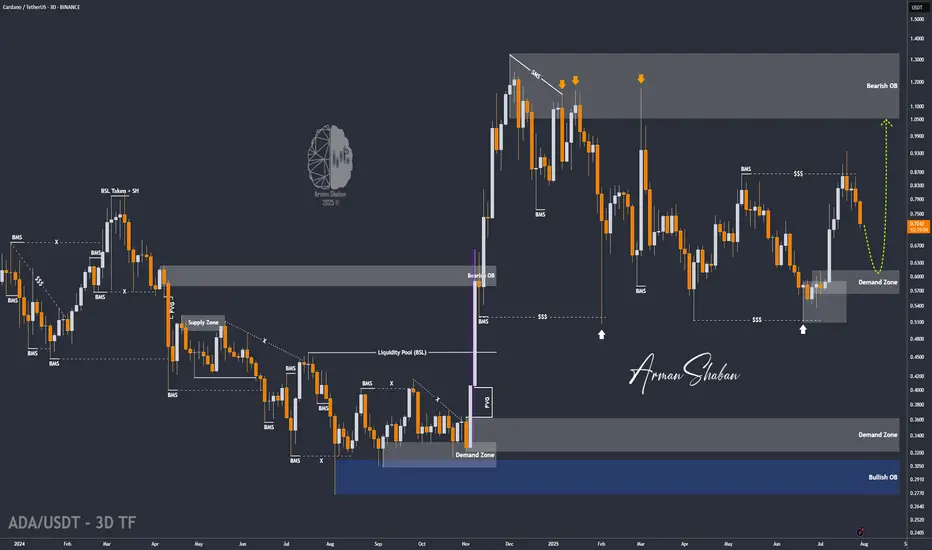
ADA/USDT | ADA Slips Below Support – Watching $0.61 for Support!By analyzing the Cardano chart on the 3-day timeframe, we can see that the price failed to hold above the $0.75 support and is currently trading around $0.72. Given the current momentum, a deeper correction for ADA seems likely. If the price fails to stabilize above $0.69, we could see a sharp drop toward the $0.61 zone. If ADA reaches this key support area, keep a close eye on it — a strong bullish reaction could lead to the next big upside move!
Please support me with your likes and comments to motivate me to share more analysis with you and share your opinion about the possible trend of this chart with me !
Best Regards , Arman Shaban
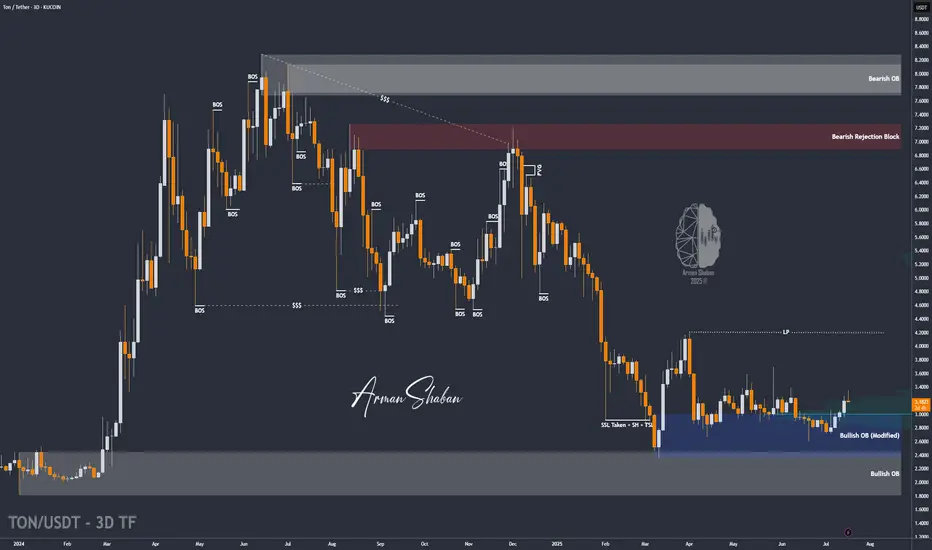
TON/USDT |Toncoin Pullback – Watching for Bounce Toward $4.20+By analyzing the Toncoin chart on the 3-day timeframe, we can see that after reaching $3.73, the price has entered a correction phase and is currently trading around $3.30. We should soon watch for a potential bullish reaction from the $3.03–$3.30 zone. If the next upward move begins, the bullish targets will be $3.74, $4.20, and $4.68.
Please support me with your likes and comments to motivate me to share more analysis with you and share your opinion about the possible trend of this chart with me !
Best Regards , Arman Shaban

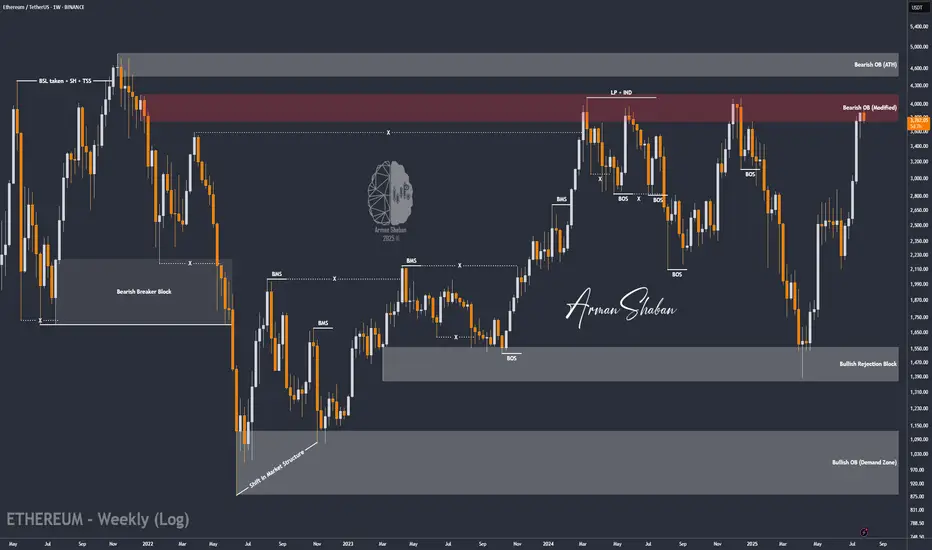
ETH/USDT | at a Crossroads – Hold Above $3440 or Sharp Fall!By analyzing the Ethereum chart on the weekly timeframe, we can see that after reaching $3940 and touching the key supply zone, ETH entered a slight correction and is currently trading around $3756. The key question now is whether it can hold above $3440 by the end of the week and push past $4000. If it does, we can expect another bullish leg toward $4100 and $4470. However, if the $3440 support fails, a sharp decline may follow — so this level is critical.
Please support me with your likes and comments to motivate me to share more analysis with you and share your opinion about the possible trend of this chart with me !
Best Regards , Arman Shaban
ETH/USDT | The Next Target is $4000 and it's Close! (READ)By analyzing the Ethereum chart on the weekly timeframe, we can see that this cryptocurrency remains one of the strongest major cryptos in the market, continuing its bullish rally despite the overall market correction. It has already hit the next target at $3500, and I believe we might see Ethereum reaching $4000 sooner than expected! Based on previous analyses, if this bullish momentum continues, the next targets will be $3740, $4100, and $4470.
Please support me with your likes and comments to motivate me to share more analysis with you and share your opinion about the possible trend of this chart with me !
Best Regards , Arman Shaban

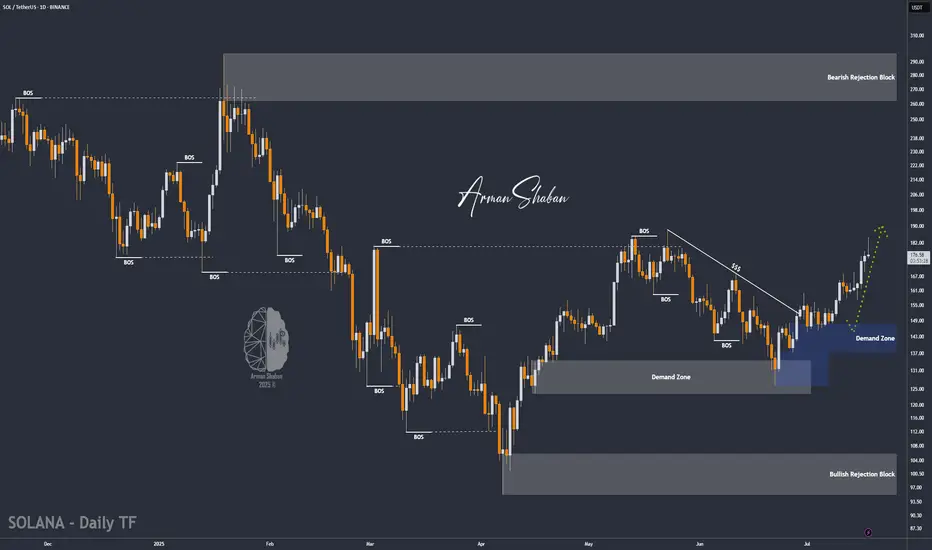
SOL/USDT | Next Bullish Leg Ahead if Key Support (READ)By analyzing the Solana chart on the daily timeframe, we can see that today the price climbed to $184, almost hitting the next target at $187, before facing a correction. It is currently trading around $176. If Solana manages to hold above the key support zone between $168 and $174, we can expect the next bullish leg to start, potentially extending up to $227. The previous analysis remains valid, with the next upside targets at $187, $220, and $263.
Please support me with your likes and comments to motivate me to share more analysis with you and share your opinion about the possible trend of this chart with me !
Best Regards , Arman Shaban
DOGE/USDT : eyes More Gains – Mid-Term Targets Up to $0.70! By analyzing the Dogecoin chart on the daily timeframe, we can see that since our last analysis around 7–8 months ago, the price started its rally from $0.10 and surged over 370% to reach $0.48. After that, it corrected back to around $0.13 and is currently trading near $0.27. If Dogecoin manages to hold above $0.25, we can expect further upside movement in the mid-term. The next targets are $0.287, $0.32, $0.41, and $0.70.
Please support me with your likes and comments to motivate me to share more analysis with you and share your opinion about the possible trend of this chart with me !
Best Regards , Arman Shaban

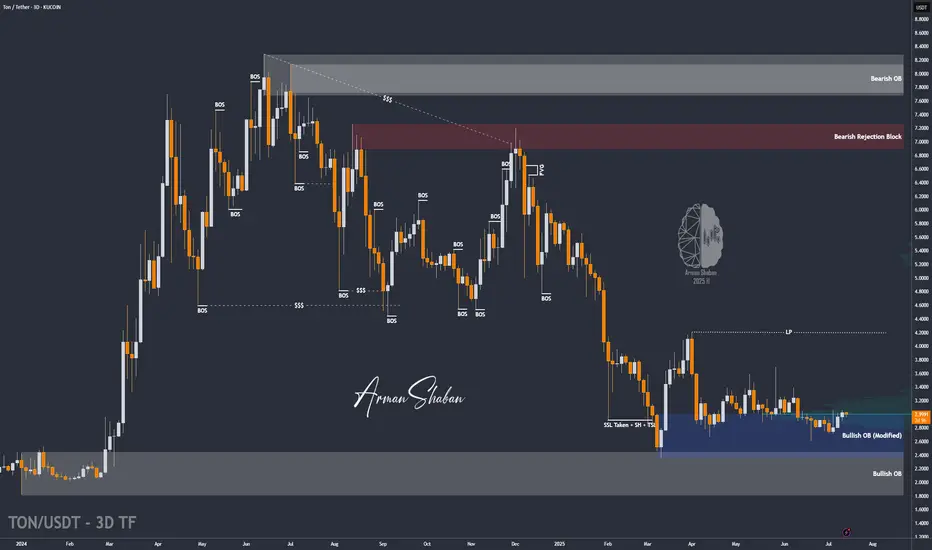
TON/USDT | Another Bullish Move Ahead? (READ THE CAPTION)By analyzing the Toncoin chart on the 3-day timeframe, we can see that, as per yesterday’s analysis, the price climbed to $3.36 before facing a slight correction — which is perfectly normal since every strong bullish trend needs a healthy pullback. The $3.05–$3.20 zone could serve as a good accumulation area for buyers, and we may soon witness another impressive rally from Toncoin! Based on the previous analysis, the next targets are $3.63, $4.20, and $4.68.
Please support me with your likes and comments to motivate me to share more analysis with you and share your opinion about the possible trend of this chart with me !
Best Regards , Arman Shaban
TON/USDT : Get Ready for a new Rally! (READ THE CAPTION)By analyzing the Toncoin chart on the 3-day timeframe, we can see that the price has finally managed to grow over 3% as expected, and is currently consolidating above the $3 level. We’ll have to see how far this bullish momentum can continue — but to be honest, I expected a stronger move considering the market rally and Bitcoin repeatedly hitting new ATHs. Still, no worries — once Bitcoin takes a breather, altcoins will likely begin their powerful runs! Based on previous analysis, the next targets are $3.15, $3.63, $4.20, and $4.68 respectively.
Please support me with your likes and comments to motivate me to share more analysis with you and share your opinion about the possible trend of this chart with me !
Best Regards , Arman Shaban
ETH/USDT : $3000 Reached, It's time foe $4000? (READ)By analyzing the Ethereum chart on the weekly timeframe, we can see that the price has finally broken the strong $2700 resistance and pushed toward the next target at $3000! Currently trading around $3150 and now within the $3130–$3440 zone, I expect a short-term rejection from this area. However, given the overall market trend, this level may not hold for long, and we could soon see a breakout toward the next targets at $3500, $3740, $4100, and $4470!
Please support me with your likes and comments to motivate me to share more analysis with you and share your opinion about the possible trend of this chart with me !
Best Regards , Arman Shaban
THE LATEST ANALYSIS :
