How to Use Balance Price Range Breakout Indicator?📊 Explosive Trend Breakouts from Balance Zones | BTCUSDT 15min Case Study
🧠 About the Setup
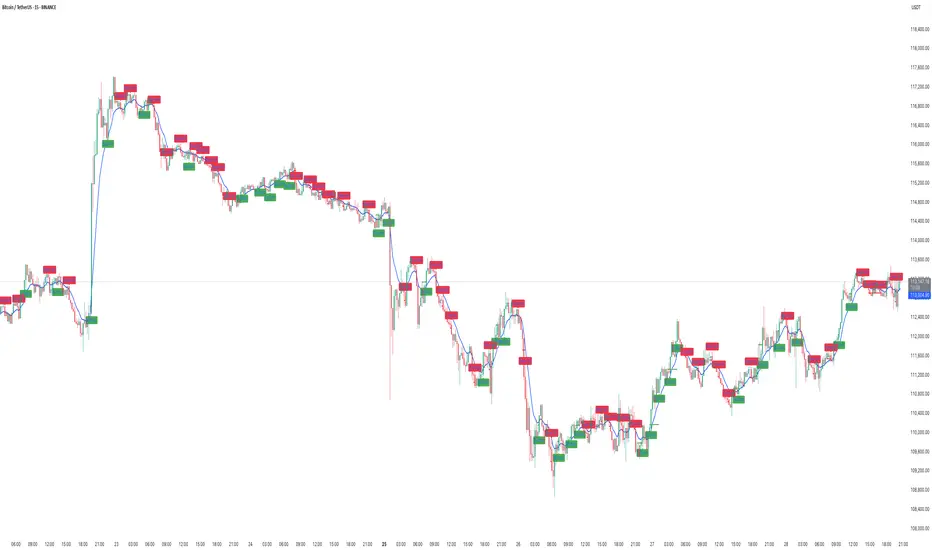
This chart showcases how the BPR with Directional Momentum-Filtered Breakouts indicator identifies powerful breakout opportunities from tight consolidation zones — also known as Balanced Price Ranges (BPRs).
Each signal you see here is not random. The system waits for:
• A Balanced Price Zone to be formed (visualized as a tight structure),
• Followed by a momentum-confirmed breakout in either direction.
✅ Green Zones = Confirmed Bullish Breakouts
❌ Red Zones = Confirmed Bearish Breakdowns
🔍 Breakdown of the Chart
📍Pair: BTCUSDT
🕒 Timeframe: 15-minute
📊 Exchange: Binance
What we see:
• Price rallied sharply post green breakouts (e.g., near 21:00 and 12:30).
• Bearish breakdowns were captured ahead of the downward moves, often before the trend acceleration.
• Even in sideways periods, the indicator avoids noise thanks to its built-in filters.
⸻
📐 How the Indicator Works
1. Balance Detection: BPR zones are calculated where price remains within a tight range (mean reversion zones).
2. Breakout Trigger : Once price exits this zone with momentum, a signal is generated.
3. EMA + Directional Filter : Confirms breakout strength and direction, avoiding false entries.
4. Cooldown Logic: Prevents back-to-back signals, ensuring only quality setups are shown.
⸻
🎯 Real Chart Insights
• The initial breakout (bottom-left) led to a massive upside move, well captured by a clean green BPR zone.
• Sideways chop during the middle phase of the chart was handled gracefully, avoiding whipsaws.
• Late trend breakouts again showed high-quality directional movement, especially after major dips.
⸻
⚙️ Additional Highlights
• 📌 Candle background changes reflect momentum-confirmed breakout type (green/red).
• 📌 Cooldown feature ensures clean chart without excessive clutter.
• 📌 Works well in both trending and volatile chop zones when combined with EMA or volume filters.
⸻
🧪 Want to explore more?
Try this on different timeframes like 5m/1h or apply it to other trending assets like ETH, NASDAQ, or Gold for confirmation-style breakout trading.
Choppyanalysis
EURCAD - Choppy Lows AheadEURCAD finds a choppy trading condition set ahead for a while, One of the least popular FX pairs - for good reason.
This correlation toward the USD/SGD and EUR/USD finds another confirmation off my initial two part EURUSD Theory posted earlier.
Links Below

USDJPY : US DOLLAR CHOPPY PRICE ACTION AGAINST JAPANESE YEN Technical Analysis : Price action as been choppy for USDJPY, We see a clear range between 109.500 and 107.
I see no changes in the technical view of the USD/JPY pair even with a choppy price movement, it remains stable below the 108.00 support amid stronger control of the bears on performance, and risk aversion will remain supportive of this trend and foreshadow a downward movement towards support levels at 107.55 and 106.90 And 106.00, respectively. There will be no control of the bulls on performance without moving above the 110.00 psychological resistance.
At the 106.9 level I expect to see a certain amount of support, so if we were to break down below that level it’s likely that we could see a downturn towards the 105 level. On the other hand, if we turn around and rally it’s likely that we could go to the 109 level where I see a significant amount of resistance. A break above this level allows the market to go to the 111 level but it certainly looks as if the downward pressure seems to be winning the day now though.
Risk Warning : The risk of loss in trading Foreign Exchange (FOREX) can be substantial.
You should therefore carefully consider whether trading is suitable for you in the light of your financial condition.
Goodluck !

Choppy Waters - Whats your strategyThe BTC chart over the past few weeks has ranged around inside a fairly tight range (tight for BTC that is) and the pattern emerging is a fairly clear period of chop within a tight range (<4%) followed by a large swing one way or another (>4% in a single candle).
unless you actually like going full degen on bitmex and using 100X to trade $100 moves this is a difficult trading environment as the moves come out of the blue
However looking closer into the choppy periods I'm seeing a decent pattern emerging that the longer they continue the more BTC breaks down out of the pattern
Running through the last few periods of a couple of candles in 3-4% total range I count the following
Length of 'Chop' (<3-4% movement)
Short (<16h) Long (>20h)
Outcome Move Up 4 2
Move Down 1 5
it's no iron rule but I'll be keeping this in mind when I'm in a trade, the longer it ranges about the more i'll be positioned for a breakout down

EURJPY 4H11 Week consolidation continues, price may find its way back to the top of its range potentially ...

Consolidation Stage: RANGE TRADING with choppy analysisOverbought level has been reach as suggest by the RSI.Need consolidation stage due to GAP UP done this day. The circle line near 38.2 FIBONACCI leve is a good opportunity to buy. Cutloss if 38.20 FIBO level was break. MOney inflow also depicts that smart money has been coming out.
