#CHR/USDT READY TO NEW EXPLODE !
#CHR
The price is moving in a descending channel on the 1-hour timeframe. It has reached the lower boundary and is heading towards breaking above it, with a retest of the upper boundary expected.
We have a downtrend on the RSI indicator, which has reached near the lower boundary, and an upward rebound is expected.
There is a key support zone in green at 0.0387. The price has bounced from this level multiple times and is expected to bounce again.
We have a trend towards consolidation above the 100-period moving average, as we are moving close to it, which supports the upward movement.
Entry price: 0.0397
First target: 0.0405
Second target: 0.0416
Third target: 0.0429
Don't forget a simple principle: money management.
Place your stop-loss order below the support zone in green.
For any questions, please leave a comment.
Thank you.
CHR

#CHR/USDT Buy Opportunity#CHR
The price is moving in a descending channel on the 1-hour timeframe. It has reached the lower boundary and is heading towards breaking above it, with a retest of the upper boundary expected.
We have a downtrend on the RSI indicator, which has reached near the lower boundary, and an upward rebound is expected.
There is a key support zone in green at 0.0564. The price has bounced from this level multiple times and is expected to bounce again.
We have a trend towards consolidation above the 100-period moving average, as we are moving close to it, which supports the upward movement.
Entry price: 0.0596
First target: 0.0613
Second target: 0.0630
Third target: 0.0652
Don't forget a simple principle: money management.
Place your stop-loss order below the support zone in green.
For any questions, please leave a comment.
Thank you.

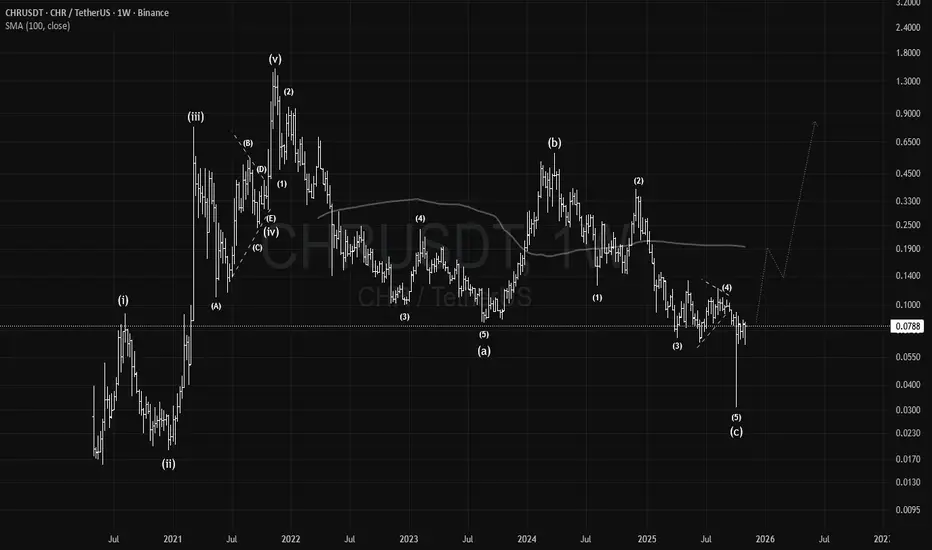
CHR: Moonvember Updates#CHR is showing strong recovery potential after the 2025 bear market. Completing a historical bullish 1–2 wave pattern, it's showing a promising mid to long-term bullish cycle outlook. Eventually it could target new all time highs in the most optimistic scenario.
#Chromia
#CHR/USDT Buy Opportunity#CHR
The price is moving within a descending channel on the 1-hour frame, adhering well to it, and is heading for a strong breakout and retest.
We have a bearish trend on the RSI indicator that is about to be broken and retested, which supports the upward breakout.
There is a major support area in green at 0.0694, representing a strong support point.
We are heading for consolidation above the 100 moving average.
Entry price: 0.0706
First target: 0.0720
Second target: 0.0738
Third target: 0.0764
Don't forget a simple matter: capital management.
When you reach the first target, save some money and then change your stop-loss order to an entry order.
For inquiries, please leave a comment.
Thank you.

CHR / USDT - Almost Ready! Morning fellas,
Taking a risk here. Obv its ur money, do with it as you wish, as this aint financial advice, but its hella looking good!
Trade thirsty, my friends!

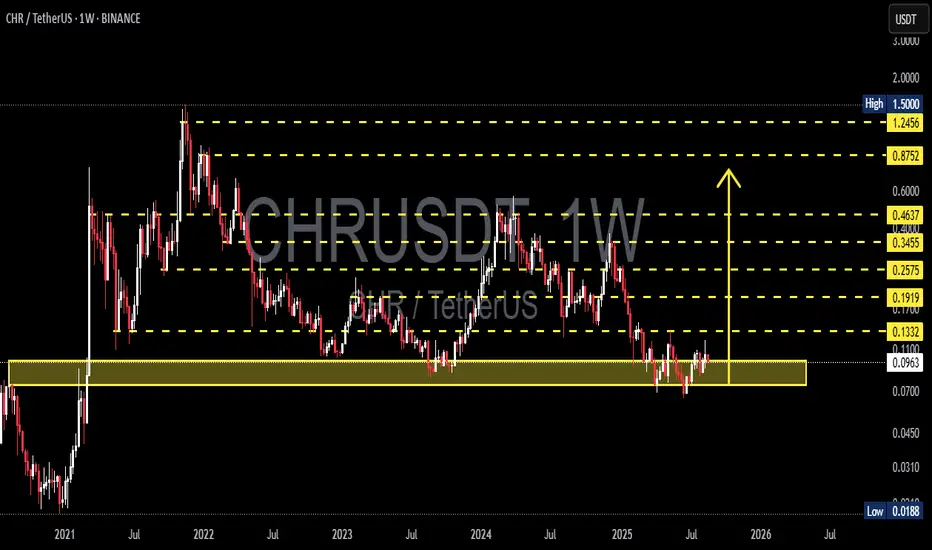
CHR/USDT — Sitting on Demand Zone, Rebound or Breakdown Ahead?CHR/USDT is currently trading around $0.0971, right inside the historical demand zone $0.07–0.12, which has been a strong accumulation area since 2021.
This zone has acted as a launchpad for multiple rallies, but at the same time, it holds a pool of equal lows liquidity that could be swept if buyers fail to defend it.
Key technical levels from the chart:
Major demand/support: 0.0700 – 0.0900
Step resistances: 0.1100 – 0.1332 – 0.1710 – 0.1919 – 0.2575 – 0.3455 – 0.4637 – 0.8752 – 1.2456 – 1.5000
Historical low: 0.0188
---
🔹 Market Structure & Pattern
Price is building a multi-year horizontal accumulation base between 0.07–0.12.
Each historical rally was triggered from this zone, making it a high-value demand block.
However, repeated tests without a strong breakout increase the risk of demand exhaustion and potential breakdown.
In other words, this area can either act as the foundation of the next bull rally or the last line before capitulation.
---
🟢 Bullish Scenario
Bias remains bullish as long as 0.0700 holds.
First trigger: A weekly close above 0.1100 → opens the path toward 0.1332.
Stronger confirmation: A break and close above 0.1332 → sets targets at 0.1710 → 0.1919.
Mid-term swing targets: 0.2575 → 0.3455.
In case of a full bullish cycle, reclaiming higher zones around 0.4–0.8 and even 1.2–1.5 remains possible.
---
🔴 Bearish Scenario
Warning sign: A weekly close below 0.0900 suggests fading buyer strength.
A breakdown below 0.0700 would unlock deeper downside: 0.0450 → 0.0310, with extreme risk toward the historical low at 0.0188.
This would mark a failed demand block and transition into a bearish market structure.
---
🎯 Conclusion & Strategy
CHR/USDT is at a critical crossroad:
Bullish case: Holding above 0.07–0.12 keeps the rebound potential alive.
Bearish case: Losing 0.07 would confirm structural weakness and open deeper downside.
💡 For aggressive traders: consider accumulation within the current zone with a tight stop below 0.0700.
💡 For conservative traders: wait for a weekly close >0.1332 as confirmation before entering long, targeting 0.1710–0.1919.
#CHRUSDT #Chromia #CryptoAnalysis #AltcoinTrading #PriceAction #SupportResistance #SwingTrading #CryptoTA #WeeklyChart
CHRUSDT UPDATE#CHR
UPDATE
CHR Technical Setup
Pattern: Bullish Wave Pattern
Current Price: $0.1043
Target Price: $0.16
Target % Gain: 52.95%
Technical Analysis: CHR is showing a bullish wave breakout on the 1D chart, reclaiming resistance around $0.10–$0.11 as new support. Strong bullish candles and momentum indicate a possible continuation move, with the next target set near $0.16.
Time Frame: 1D
Risk Management Tip: Always use proper risk management.

CHR · Perfect Timing · 1177% Profits PotentialIf I had to summarize this entire article (chart) in a single phrase it would be: Perfect timing.
CHRUSDT (Chromia) has perfect timing for massive growth. A full reversal pattern is present and complete with the bullish breakout happening now with two weeks closing green and many weeks moving up.
The timing is great because the long-term chart structure shows perfect conditions for a change of trend. This means that we are looking at bottom prices but with a bullish bias already confirmed. CHRUSDT has been recovering slowly for an entire month.
An easy but strong target at $0.8797 has 712% profits potential. More can be found on the chart.
Thank you for reading.
Namaste.

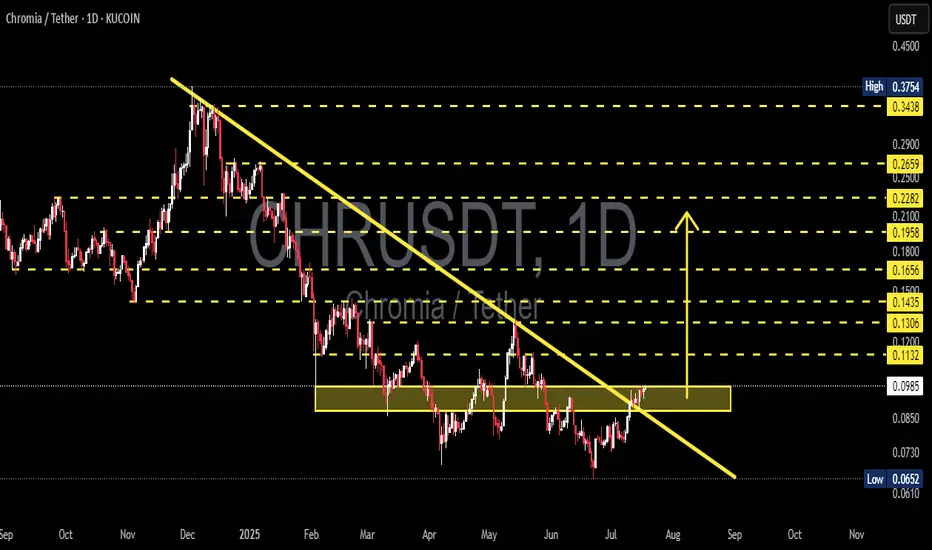
CHR/USDT Major Breakout! Bullish Momentum Ignites🧠 Complete Technical Analysis:
After months of being trapped in a prolonged downtrend since December 2024, Chromia (CHR) has finally shown signs of awakening. The price has successfully broken out of a major descending trendline, while also breaching a critical consolidation resistance zone between $0.093–$0.098 (highlighted in yellow).
This breakout not only indicates a potential trend reversal, but also opens the door for a medium-term bullish rally if sustained.
📊 Structure and Pattern Highlights:
Descending Trendline Breakout: CHR has decisively broken out of the long-standing bearish structure.
Validated Accumulation Zone: The $0.075–$0.098 range has proven to be a strong accumulation base after multiple tests.
Layered Horizontal Resistances: A clear ladder of resistance levels awaits as price pushes upward.
Potential Bullish Patterns: With a healthy pullback and higher low, CHR could form an Inverse Head and Shoulders or a Bullish Flag continuation pattern.
📈 Bullish Scenario:
If CHR can hold daily candle closes above the $0.098 breakout zone, the following targets come into play:
Target Level Description
$0.113 Breakout confirmation zone
$0.120 Psychological mini-resistance
$0.130 Historical horizontal resistance
$0.143 Previous local top
$0.165 Key breakdown level
$0.180 – $0.228 Medium-term target range with historical supply
$0.265 – $0.290 Strong resistance area from past distribution
$0.343 – $0.375 Long-term bullish target
💡 Note: If buying volume increases and BTC remains stable or bullish, these targets become increasingly realistic.
📉 Bearish Scenario:
However, if this breakout turns out to be a fakeout, CHR may fall back below the $0.093 zone and retest:
$0.085 (minor support)
$0.075 (base support)
As low as the demand zone around $0.065–$0.070
📌 Candle close and volume confirmation are critical. Avoid chasing price without solid validation!
📎 Conclusion & Strategy:
> CHR/USDT is currently at a pivotal moment. This breakout from a multi-month downtrend signals a potential trend reversal and a medium-term opportunity for swing traders and position holders.
📈 Trading Strategy Suggestion:
Entry: After a successful retest of the $0.095–$0.098 zone
Stop Loss: Below $0.085
Take Profit: Scale out at resistance levels listed above
#CHRUSDT #Chromia #CryptoBreakout #TrendReversal #AltcoinSeason #TechnicalAnalysis #CryptoTrading #BullishPattern #BreakoutSignal #ChartSetup
#CHR Is gearing up for an update ?#CHR
The price is moving within a descending channel on the 1-hour frame, adhering well to it, and is on its way to breaking it strongly upwards and retesting it.
We have a bounce from the lower boundary of the descending channel. This support is at 0.0788.
We have a downtrend on the RSI indicator that is about to break and retest, supporting the upside.
There is a major support area in green at 0.0750, which represents a strong basis for the upside.
Don't forget a simple thing: ease and capital.
When you reach the first target, save some money and then change your stop-loss order to an entry order.
For inquiries, please leave a comment.
We have a trend to hold above the 100 Moving Average.
Entry price: 0.0793
First target: 0.0820
Second target: 0.0843
Third target: 0.0861
Don't forget a simple thing: ease and capital.
When you reach the first target, save some money and then change your stop-loss order to an entry order.
For inquiries, please leave a comment.
Thank you.

#CHR READY TO NEW EXPLODE !#CHR
The price is moving within a descending channel on the 1-hour frame and is expected to break and continue upward.
We have a trend to stabilize above the 100 moving average once again.
We have a downtrend on the RSI indicator that supports the upward break.
We have a support area at the lower boundary of the channel at 0.0474, acting as strong support from which the price can rebound.
Entry price: 0.0756
First target: 0.0768
Second target: 0.0785
Third target: 0.0810
To manage risk, don't forget stop loss and capital management.
When you reach the first target, save some profits and then change the stop order to an entry order.
For inquiries, please comment.
Thank you.

CHRUSDT 1D AnalysisCHR ~ 1D Analysis
#CHR Buy gradually from here if you still have confidence in this coin with a short term target of at least 15%+ from here.

I'm Bullish, but... CHR / USDTEvening fellas,
My latest posts are bullish, and I did long some coins during the blood we had a couple of days ago.
But one must always be ready and I am seeing something interesting in a couple of coins, showing me that there's a hidden bearish scenario behind all the hype.
CHR is one of those coins, it's got good news, hype, etc, but I think MM'rs want to destroy some lives.
Keep an eye on it.
Trade thirsty, my friends!

#CHR Ready For Another Leg Down? Key Levels to Watch Yello, Paradisers! #CHR is showing upside probability, but this is just a setup before the next brutal leg down? Here’s why the current move by #Chromia could be the calm before the storm:
💎#CHRUSDT is trading around $0.0819, and on the 4H chart, the price is developing within a potential Leading Diagonal Formation. But here's the catch: for the diagonal to be valid, Wave 5 must exceed Wave 3, which hasn’t happened yet. So, the structure remains incomplete and vulnerable.
💎As of now, the 5th wave is still in play, but momentum is fading fast. A Bearish Divergence on the MACD histogram is flashing early warnings. If it intensifies, it could drag #CHRUSD down before Wave 5 completes, leading to a premature breakdown and invalidation of the pattern.
💎The resistance zone between $0.089-$0.97 remains key. A break and sustained hold above this level would invalidate the bearish scenario, potentially triggering a short squeeze up toward $0.1000+. But unless that happens, bears are still in control of the structure.
💎On the downside, a confirmed breakdown below the $0.0740 support will signal the failure of the diagonal and likely accelerate the drop toward the next major support at $0.0610, where we anticipate the next Swing Low. A valid bearish breakout below needs to be backed by increasing selling pressure and market weakness.
Play it safe, respect the structure, and let the market come to you!
MyCryptoParadise
iFeel the success🌴

CHRUSDT 1DCHR ~ 1D Analysis
#CHR Buy after successfully penetrating this resistant line with a short -term target of at least 10%+ from here.

CHR The Hidden GemDespite the unexpected bearish decline since Dec 2024, #CHR still holds a bullish outlook as long as it stays above $0.081 (stop-loss).
Confirming the current bottom is key for the bullish thesis, with passing $0.376 signaling a potential new all-time high.
#Chromia

CHRUSDT 1WCHR ~ 1W Analysis
#CHR If you still have a Conviction on this coin,. Maybe you can consider this support to start buying back from here.

CHROMIA READY TO EXPLODE !!!CHROMIA getting ready to take of 🚀
Don't under estimate this beast will melt the faces soon

#CHR (SPOT-INVEST) IN ( 0.1300- 0.1500) T.(0.7900) SL(0.1248)BINANCE:CHRUSDT
#CHR/ USDT
Entry( 0.1300- 0.1500)
SL 3D close below 0.1248
T1 0.3000
T2 0.4300
T3 0.5600
T4 0.7900
1 Extra Targets(optional) in chart, if you like to continue in the trade with making stoploss very high.
______________________________________________________________
Golden Advices.
********************
* collect the coin slowly in the entry range.
* Please calculate your losses before the entry.
* Do not enter any trade you find it not suitable for you.
* No FOMO - No Rush , it is a long journey.
Useful Tags.
****************
My total posts
www.tradingview.com
**********************************************************************************************
#Manta #OMNI #DYM #AI #IO #XAI #ACE #NFP #RAD #WLD #ORDI #BLUR #SUI #VOXEL #AEVO #VITE #APE #RDNT #FLUX #NMR #VANRY #TRB #HBAR #DGB #XEC #ERN #ALT #IO #ACA #HIVE #ASTR #ARDR #PIXEL #LTO #AERGO #SCRT #ATA #HOOK #FLOW #KSM #HFT #MINA #DATA #SC #JOE #RDNT #IQ #CFX #BICO #CTSI #KMD #FXS #DEGO #FORTH #AST #PORTAL #CYBER #RIF #ENJ #ZIL #APT #GALA #STEEM #ONE #LINK #NTRN #COTI #RENDER #ICX #IMX #ALICE #PYR #PORTAL #GRT #GMT #IDEX #NEAR #ICP #ETH #QTUM #VET #QNT #API3 #BURGER #MOVR #SKL #BAND #ETHFI #SAND #IOTX #T #GTC #PDA #GMX #REZ #DUSK #BNX #SPELL #POWR #JOE #TIA #TFUEL #HOT #AVAX #WAXP #OGN #AXS #GALA #ONE #SYS #SCRT #DGB #LIT #QI #FIL #GLMR #ATOM #LTC #MANA #ONT #TLM #SLP #ROSE #NEO #EGLD #CHR

#CHR (SPOT) IN ( 0.1800- 0.2100)T.(0.7900) SL(0.1732)BINANCE:CHRUSDT
#CHR/ USDT
Entry( 0.1800- 0.2100)
SL 1D close below 0.1732
T1 0.3000
T2 0.4300
T3 0.5600
T4 0.7900
1 Extra Targets(optional) in chart, if you like to continue in the trade with making stoploss very high.
______________________________________________________________
Golden Advices.
********************
* collect the coin slowly in the entry range.
* Please calculate your losses before the entry.
* Do not enter any trade you find it not suitable for you.
* No FOMO - No Rush , it is a long journey.
Useful Tags.
****************
My total posts
www.tradingview.com
**********************************************************************************************
#Manta #OMNI #DYM #AI #IO #XAI #ACE #NFP #RAD #WLD #ORDI #BLUR #SUI #VOXEL #AEVO #VITE #APE #RDNT #FLUX #NMR #VANRY #TRB #HBAR #DGB #XEC #ERN #ALT #IO #ACA #HIVE #ASTR #ARDR #PIXEL #LTO #AERGO #SCRT #ATA #HOOK #FLOW #KSM #HFT #MINA #DATA #SC #JOE #RDNT #IQ #CFX #BICO #CTSI #KMD #FXS #DEGO #FORTH #AST #PORTAL #CYBER #RIF #ENJ #ZIL #APT #GALA #STEEM #ONE #LINK #NTRN #COTI #RENDER #ICX #IMX #ALICE #PYR #PORTAL #GRT #GMT #IDEX #NEAR #ICP #ETH #QTUM #VET #QNT #API3 #BURGER #MOVR #SKL #BAND #ETHFI #SAND #IOTX #T #GTC #PDA #GMX #REZ #DUSK #BNX #SPELL #POWR #JOE #TIA #TFUEL #HOT #AVAX #WAXP #OGN #AXS #GALA #ONE #SYS #SCRT #DGB #LIT #QI #FIL #GLMR #ATOM #LTC #MANA #ONT #TLM #SLP #ROSE #NEO #EGLD #CHR

CHR Set to Skyrocket? Potential 43x to 165x Ahead!▍Reason 1:
BINANCE:CHRUSDT is perfectly replicating the price structure from the last bull run.
You can refer to the points I marked (1-7) in the chart.
In the last cycle, point 7 marked the lowest point before the price surged 84x.
▍Reason 2:
Since January 2021, CHR has been forming a multi-year symmetrical triangle, and it's now approaching the end of this pattern.
According to triangle consolidation theory, this means a major breakout is imminent.
Considering that altcoin season is also approaching (I've attached my previous analysis below), CHR is very likely to explode upwards!
▍Price Target Projections:
1. Fibonacci Target (marked in the chart) suggests a target of $6.6, representing a 43x increase from the current price.
2. Triangle Breakout Target (marked in the chart) suggests a potential high of $25, an incredible 165x from the current price!
I don’t think this bull run will deliver 100x+ gains, but with this potential, isn’t it worth getting in now?
for more future script 'guesses' like this!

CHRUSDT 1WCHR ~ 1W
#CHR If you still have Conviction on this coin,. Buy in stages from here with a minimum target of 20%++

Alikze »» STRK | Trading range🔍 Technical analysis: Trading range
- It is in a downtrend on the 1D daily time frame.
- Currently, it is in the area between 0.33 and 0.42 as a trading range.
- In case of support in the 0.39 area, it can grow up to the supply area.
🛑 The most important resistance: 0.586
- Due to the fact that there is demand in the current area, this failure can happen from above.
- He has tested the swing several times. According to the momentum, there is an expectation of failure from above.
- But if there is consolidation below the 0.39 area and there is a break from the bottom, the bearish scenario will gain strength.
💎 Alternative scenario: Considering that the formation of a bearish flag pattern is given, if the 0.39 area is not maintained and stabilizes below the area, we can expect confirmation of the bearish flag pattern, which with the breaking of the trading range area can be a correction as much as the previous leg. experience another.
»»»«««»»»«««»»»«««
Please support this idea with a LIKE and COMMENT if you find it useful and Click "Follow" on our profile if you'd like these trade ideas delivered straight to your email in the future.
Thanks for your continued support.
Best Regards,❤️
Alikze.
»»»«««»»»«««»»»«««
BINANCE:STRKUSDT
