#CHR/USDT READY TO NEW EXPLODE !#CHR
The price is moving within a descending channel on the hourly timeframe. It has reached the lower boundary and is heading towards a breakout, with a retest of the upper boundary expected.
The Relative Strength Index (RSI) is showing a downward trend, approaching the lower boundary, and an upward bounce is anticipated.
There is a key support zone in green at 0.0298, and the price has bounced from this level several times. Another bounce is expected.
The RSI is showing a trend towards consolidation above the 100-period moving average, which we are approaching, supporting the upward move.
Entry Price: 0.0304
Target 1: 0.0312
Target 2: 0.0319
Target 3: 0.0328
Stop Loss: Below the green support zone.
Remember this simple thing: Money management.
For any questions, please leave a comment.
Thank you.
Chrusdtperp

#CHR/USDT Buy Opportunity#CHR
The price is moving within a descending channel on the hourly timeframe. It has reached the lower boundary and is heading towards a breakout, with a retest of the upper boundary expected.
The Relative Strength Index (RSI) is showing a downward trend, approaching the lower boundary, and an upward bounce is anticipated.
There is a key support zone in green at 0.0373, and the price has bounced from this level several times and is expected to bounce again.
The indicator is showing a trend towards consolidation above the 100-period moving average, which we are approaching, supporting the upward move.
Entry Price: 0.0383
First Target: 0.0389
Second Target: 0.0400
Third Target: 0.0413
Stop Loss: Below the green support zone.
Remember this simple thing: Money management.
For any questions, please leave a comment.
Thank you.

CHR/USDT - Last Demand Zone Could Define the Next Big Move?On the weekly timeframe, CHR/USDT remains in a long-term bearish phase, clearly reflected by a consistent lower high and lower low structure since the all-time high around 1.50. Selling pressure continues to dominate, pushing price closer to a major historical demand zone formed during the early accumulation phase.
The yellow zone (0.0235 – 0.0180) is a critical area, as it previously triggered a strong bullish impulse and now acts as a key decision zone for long-term price direction.
---
Market Structure & Technical Pattern
Primary Trend: Bearish (long-term downtrend)
Market Structure: Lower High – Lower Low (no confirmed reversal yet)
Key Technical Patterns:
Descending Structure / Bearish Continuation
Potential early-stage Falling Wedge if bearish momentum weakens near demand
Key Levels:
Major Demand Zone (Weekly): 0.0235 – 0.0180 (yellow zone)
Minor Support: ~0.038
Nearest Resistance: 0.060 – 0.075
Major Resistance: 0.110 – 0.170
This demand zone represents a high-probability reaction area, especially for long-term positioning.
---
Bullish Scenario
The bullish scenario becomes valid if:
Price holds and reacts strongly within the 0.0235 – 0.0180 demand zone
Formation of strong weekly rejection or bullish engulfing candles
A minor market structure break above 0.060
Bullish upside targets:
Initial rebound toward 0.060 – 0.075
If breakout continuation occurs:
0.110
0.170
This scenario would signal the beginning of a long-term accumulation and reversal phase.
---
Bearish Scenario
The bearish continuation scenario remains valid if:
Price closes a weekly candle below 0.0180
The major demand zone fails to hold
Bearish implications:
Breakdown of long-term structure
Potential search for lower liquidity zones
Increased risk of market capitulation
No reversal confirmation exists unless a new structure is formed.
---
Conclusion
CHR/USDT is currently trading at a critical long-term decision zone. The 0.0235 – 0.0180 area acts as the last major demand, determining whether price will:
Enter a long-term accumulation and reversal phase, or
Continue a deeper bearish trend
Price reaction at this zone will be decisive for future market bias.
#CHR #CHRUSDT #Chromia #CryptoAnalysis #TechnicalAnalysis #WeeklyChart #DemandZone #SupportResistance #BearishTrend #PotentialReversal #AltcoinAnalysis

#CHR/USDT READY TO NEW EXPLODE !
#CHR
The price is moving in a descending channel on the 1-hour timeframe. It has reached the lower boundary and is heading towards breaking above it, with a retest of the upper boundary expected.
We have a downtrend on the RSI indicator, which has reached near the lower boundary, and an upward rebound is expected.
There is a key support zone in green at 0.0387. The price has bounced from this level multiple times and is expected to bounce again.
We have a trend towards consolidation above the 100-period moving average, as we are moving close to it, which supports the upward movement.
Entry price: 0.0397
First target: 0.0405
Second target: 0.0416
Third target: 0.0429
Don't forget a simple principle: money management.
Place your stop-loss order below the support zone in green.
For any questions, please leave a comment.
Thank you.

#CHR/USDT Buy Opportunity#CHR
The price is moving in a descending channel on the 1-hour timeframe. It has reached the lower boundary and is heading towards breaking above it, with a retest of the upper boundary expected.
We have a downtrend on the RSI indicator, which has reached near the lower boundary, and an upward rebound is expected.
There is a key support zone in green at 0.0564. The price has bounced from this level multiple times and is expected to bounce again.
We have a trend towards consolidation above the 100-period moving average, as we are moving close to it, which supports the upward movement.
Entry price: 0.0596
First target: 0.0613
Second target: 0.0630
Third target: 0.0652
Don't forget a simple principle: money management.
Place your stop-loss order below the support zone in green.
For any questions, please leave a comment.
Thank you.

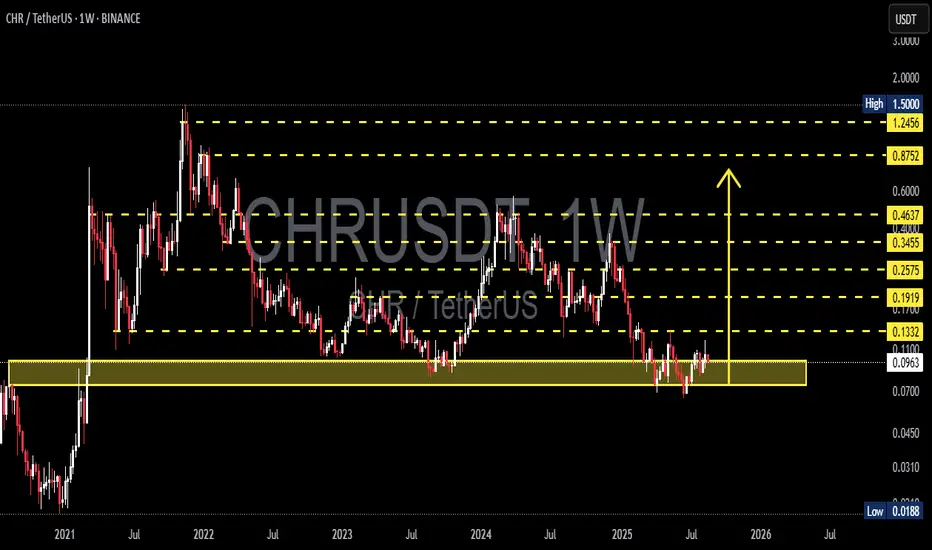
CHR/USDT — Sitting on Demand Zone, Rebound or Breakdown Ahead?CHR/USDT is currently trading around $0.0971, right inside the historical demand zone $0.07–0.12, which has been a strong accumulation area since 2021.
This zone has acted as a launchpad for multiple rallies, but at the same time, it holds a pool of equal lows liquidity that could be swept if buyers fail to defend it.
Key technical levels from the chart:
Major demand/support: 0.0700 – 0.0900
Step resistances: 0.1100 – 0.1332 – 0.1710 – 0.1919 – 0.2575 – 0.3455 – 0.4637 – 0.8752 – 1.2456 – 1.5000
Historical low: 0.0188
---
🔹 Market Structure & Pattern
Price is building a multi-year horizontal accumulation base between 0.07–0.12.
Each historical rally was triggered from this zone, making it a high-value demand block.
However, repeated tests without a strong breakout increase the risk of demand exhaustion and potential breakdown.
In other words, this area can either act as the foundation of the next bull rally or the last line before capitulation.
---
🟢 Bullish Scenario
Bias remains bullish as long as 0.0700 holds.
First trigger: A weekly close above 0.1100 → opens the path toward 0.1332.
Stronger confirmation: A break and close above 0.1332 → sets targets at 0.1710 → 0.1919.
Mid-term swing targets: 0.2575 → 0.3455.
In case of a full bullish cycle, reclaiming higher zones around 0.4–0.8 and even 1.2–1.5 remains possible.
---
🔴 Bearish Scenario
Warning sign: A weekly close below 0.0900 suggests fading buyer strength.
A breakdown below 0.0700 would unlock deeper downside: 0.0450 → 0.0310, with extreme risk toward the historical low at 0.0188.
This would mark a failed demand block and transition into a bearish market structure.
---
🎯 Conclusion & Strategy
CHR/USDT is at a critical crossroad:
Bullish case: Holding above 0.07–0.12 keeps the rebound potential alive.
Bearish case: Losing 0.07 would confirm structural weakness and open deeper downside.
💡 For aggressive traders: consider accumulation within the current zone with a tight stop below 0.0700.
💡 For conservative traders: wait for a weekly close >0.1332 as confirmation before entering long, targeting 0.1710–0.1919.
#CHRUSDT #Chromia #CryptoAnalysis #AltcoinTrading #PriceAction #SupportResistance #SwingTrading #CryptoTA #WeeklyChart
CHRUSDT UPDATE#CHR
UPDATE
CHR Technical Setup
Pattern: Bullish Wave Pattern
Current Price: $0.1043
Target Price: $0.16
Target % Gain: 52.95%
Technical Analysis: CHR is showing a bullish wave breakout on the 1D chart, reclaiming resistance around $0.10–$0.11 as new support. Strong bullish candles and momentum indicate a possible continuation move, with the next target set near $0.16.
Time Frame: 1D
Risk Management Tip: Always use proper risk management.

#CHR READY TO NEW EXPLODE !#CHR
The price is moving within a descending channel on the 1-hour frame and is expected to break and continue upward.
We have a trend to stabilize above the 100 moving average once again.
We have a downtrend on the RSI indicator that supports the upward break.
We have a support area at the lower boundary of the channel at 0.0474, acting as strong support from which the price can rebound.
Entry price: 0.0756
First target: 0.0768
Second target: 0.0785
Third target: 0.0810
To manage risk, don't forget stop loss and capital management.
When you reach the first target, save some profits and then change the stop order to an entry order.
For inquiries, please comment.
Thank you.

CHRUSDT 1W AnalysisCHR ~ 1W Analysis
#CHR Buy back gradually from here if you still have confidence in this coin with a short term target of at least 20%+ from here.

CHRUSDT 1DCHR ~ 1D Analysis
#CHR Buy after successfully penetrating this resistant line with a short -term target of at least 10%+ from here.

CHRUSDT 1WCHR ~ 1W Analysis
#CHR If you still have a Conviction on this coin,. Maybe you can consider this support to start buying back from here.

CHRUSDT 1WCHR ~ 1W
#CHR If you still have Conviction on this coin,. Buy in stages from here with a minimum target of 20%++

#CHR/USDT Ready to go higher#CHR
The price is moving in a descending channel on the 1-hour frame and sticking to it well
We have a bounce from the lower limit of the descending channel, this support is at 0.2390
We have a downtrend on the RSI indicator that is about to be broken, which supports the rise
We have a trend to stabilize above the moving average 100
Entry price 0.2410
First target 0.2510
Second target 0.2628
Third target 0.2748

CHRUSDT 1WCHR Update ~ 1W
#CHR Again rejected from this resistance line. If you still have Conviction on this coin,. This support block would be a very good buying place for now,. with a minimum target of 20%++, it is only a matter of time until this resistance line is successfully penetrated.

#CHR/USDT#CHR
The price is moving within a 12 hour descending channel pattern, which is a strong retracement pattern
We have a bounce from a major support area in the color EUR at 0.2000
We have a tendency to stabilize above the Moving Average 100
We have a downtrend on the RSI indicator that supports the rise and gives greater momentum and the price is based on it
Entry price is 0.2365
The first target is 0.2690
The second target is 0.3180
The third goal is 0.3744

CHRUSDTCHR ~ 4D
#CHR Continue moving in this descending pattern. Wait for this descending pattern to be successfully broken to start buying this coin.

#CHR/USDT#CHR
The price is moving in a triangle on the 12-hour frame and we have a support area in green at the 0.350 level
We have a higher stability moving average of 100
We have a good bounce being prepared from the lower border of the triangle once the downtrend breaks to the upside
The RSI indicator has a downtrend that is about to break higher
Entry price is 0.3800
The first target is 0.4121
The second target is 0.4550
The third target is 0.5100

CHRUSDT - Trend + Resistance Breakout!CHRUSDT (1D Chart) Technical analysis
CHRUSDT (1D Chart) Currently trading at $0.123
Buy level: Above $0.121
Stop loss: Below $0.097
TP1: $0.136
TP2: $0.165
TP3: $0.195
TP4: $0.3
Max Leverage 3x
Always keep Stop loss
Follow Our Tradingview Account for More Technical Analysis Updates, | Like, Share and Comment Your thoughts

CHRUSDT Triangle Breakout!CHRUSDT Technical Analysis update
CHRUSDT price is breaking its triangle pattern.
Buy zone : Below $0.29
Stop loss : $0.265
Thanks
Hexa

CHR SHORT WAIT FOR ENTRY LEVEL hello Traders, here is the full analysis for this pair, let me know in the comment section below if you have any questions, the entry will be taken only if all rules of the strategies will be satisfied. I suggest you keep this pair on your watchlist and see if the rules of your strategy are satisfied. Please also refer to the Important Risk Notice linked below.

CHRUSDT - Time to going upDive into our September #DevEx Team Update, featuring:
📚 Enhanced documentation
🌐 On-chain package manager
📃 RellDoc Tool
🔎 MVP release of Chromia Explorer
🛠️ Rell Formatter
💡 IntelliJ Rell Plugin
Stay tuned for upcoming developments!

Chromia CHR price forms "Double Bottom" and long term trade+360%It seems that the light at the end of a long falling tunnel is beginning to appear for Chromia investors)
At least we managed to see at least two patterns on the large timeframe that suggest a trend change and in this case, the CHR price will move up.
Perhaps a powerful fundamental and news background is being prepared in Chromia and you know about it?)
Please share it with our community in the comments.
In the meantime, we suggest considering the following long trade for CHRUSDT:
Entry = $0.108-0.110
Stop = $0.09999 (-7.5%)
TP 1 = $0.322 (+200%)
TP 2 = $0.48-0.53 (+360%)
Potential profit/loss ratio = 48/1
_____________________
Did you like our analysis? Leave a comment, like, and follow to get more

