CSCO Timeframe: Short Term, Technical: Strong Bearish >$51.24#CSCO (Entered: Strong Bearish)
#Daily
#Technical Analysis
#crevixtrader
Cisco

Cisco down. CSCOImmediate targets 54.33, 52.64. Invalidation at 65.
We are not in the business of getting every prediction right, no one ever does and that is not the aim of the game. The Fibonacci targets are highlighted in purple with invalidation in red. Fibonacci goals, it is prudent to suggest, are nothing more than mere fractally evident and therefore statistically likely levels that the market will go to. Having said that, the market will always do what it wants and always has a mind of its own. Therefore, none of this is financial advice, so do your own research and rely only on your own analysis. Trading is a true one man sport. Good luck out there and stay safe

CISCO - down. CSCO Short term outlook.
Bearish outlook for gains at 56, then 54. Invalidation at 65.
We are not in the business of getting every prediction right, no one ever does and that is not the aim of the game. The Fibonacci targets are highlighted in purple with invalidation in red. Fibonacci goals, it is prudent to suggest, are nothing more than mere fractally evident and therefore statistically likely levels that the market will go to. Having said that, the market will always do what it wants and always has a mind of its own. Therefore, none of this is financial advice, so do your own research and rely only on your own analysis. Trading is a true one man sport. Good luck out there and stay safe!

Cisco Systems: Buying at Resistance Turned SupportCSCO - Short Term - We look to Buy at 59.26 (stop at 57.57)
Preferred trade is to buy on dips. We have a 38.2% Fibonacci pullback level of 58.97 from 51.08 to 63.84. Previous resistance, now becomes support at 59.00. 20 1day EMA is at 59.80. The bias is still for higher levels and we look for any dips to be limited.
Our profit targets will be 63.83 and 64.50
Resistance: 65.00 / 70.00 / 75.00
Support: 60.00 / 55.00 / 50.00
Disclaimer – Saxo Bank Group. Please be reminded – you alone are responsible for your trading – both gains and losses. There is a very high degree of risk involved in trading. The technical analysis, like any and all indicators, strategies, columns, articles and other features accessible on/though this site (including those from Signal Centre) are for informational purposes only and should not be construed as investment advice by you. Such technical analysis are believed to be obtained from sources believed to be reliable, but not warrant their respective completeness or accuracy, or warrant any results from the use of the information. Your use of the technical analysis, as would also your use of any and all mentioned indicators, strategies, columns, articles and all other features, is entirely at your own risk and it is your sole responsibility to evaluate the accuracy, completeness and usefulness (including suitability) of the information. You should assess the risk of any trade with your financial adviser and make your own independent decision(s) regarding any tradable products which may be the subject matter of the technical analysis or any of the said indicators, strategies, columns, articles and all other features.
Please also be reminded that if despite the above, any of the said technical analysis (or any of the said indicators, strategies, columns, articles and other features accessible on/through this site) is found to be advisory or a recommendation; and not merely informational in nature, the same is in any event provided with the intention of being for general circulation and availability only. As such it is not intended to and does not form part of any offer or recommendation directed at you specifically, or have any regard to the investment objectives, financial situation or needs of yourself or any other specific person. Before committing to a trade or investment therefore, please seek advice from a financial or other professional adviser regarding the suitability of the product for you and (where available) read the relevant product offer/description documents, including the risk disclosures. If you do not wish to seek such financial advice, please still exercise your mind and consider carefully whether the product is suitable for you because you alone remain responsible for your trading – both gains and losses.

Well, why wouldn't Cisco drop? CSCOAnd it would appear to. A momentous rise there, but all goo things must come to an end some time. Cisco is no exception.
We are not in the business of getting every prediction right, no one ever does and that is not the aim of the game. The Fibonacci targets are highlighted in purple with invalidation in red. Fibonacci goals, it is prudent to suggest, are nothing more than mere fractally evident and therefore statistically likely levels that the market will go to. Having said that, the market will always do what it wants and always has a mind of its own. Therefore, none of this is financial advice, so do your own research and rely only on your own analysis. Trading is a true one man sport. Good luck out there and stay safe!

CISCO : Signals to buyCISCO is in the end of correction phase.
the trend is bullish and the point to buy is the break by the price the level 57,43

CSCO Daily TimeframeSNIPER STRATEGY (new version)
It works ALMOST ON ANY CHART.
It produces Weak, Medium and Strong signals based on consisting elements.
NOT ALL TARGETS CAN BE ACHIEVED, let's make that clear.
TARGETS OR ENTRY PRICES ARE STRONG SUPPORT AND RESISTANCE LEVELS.
ENTRY PRICE BLACK COLOR
TARGETS GREEN COLOR
STOP LOSS RED COLOR
DO NOT USE THIS STROTEGY FOR LEVERAGED TRADING.
It will not give you the whole wave like any other strategy out there but it will give you a huge part of the wave.
The BEST TIMEFRAMES for this strategy are Daily, Weekly and Monthly however it can work on any timeframe.
Consider those points and you will have a huge advantage in the market.
There is a lot more about this strategy.
It can predict possible target and also give you almost exact buy or sell time on the spot.
I am developing it even more so stay tuned and start to follow me for more signals and forecasts.
START BELIEVING AND GOOD LUCK
HADIMOZAYAN

Cisco Ponzied - Made in China - Huge Disaster - Small Cap SeasonThe gems are out there. *valuation matters
Beware Profits made overseas. *rising rates environment kilss Stonks & Crypto Ponzi Pogs.
#cannabisreform
#jobsandjustice
#thegem

CISCO 4H - SHORTStock Market Trading is dangerous and non profitable for most of you out there. Follow signals, make money. Period.
How to use my signals?
LONG: Buy and hold as long as the price stays above the green zone.
SHORT: Sell and hold as long as the price stays below the red zone.

CSCO Log Chart AnalysisGood reclaim of important monthly level, I'd prefer to see a nice retrace back to 57s but the opportunity cost may outweigh the better entry. We're entering peak euphoria ranges from the internet bubble... if we escape this range, north of $82 the fun really starts. All time highs are a mere 40% away, with 50%+ upside from there.
Take profit levels marked using fib retracement of the internet bubble top and bottom. I expect this to run from this spot, good R:R with scaled stops under the monthly level.
Considering this analysis was done at high time frame, it may take a while to play out. Below 53.41, I think this trade is invalidated.

CSCO breaking bear out of Rising wedge. BULLS WATCH OUT!Watch out! Especially because FED wants to "taper" their money printing as per their latest FOMC meeting minutes

CSCO RISING WEDGEIt looks like rising wedge.
If it can pass the green line, it may start the movement.
Red is support line.
This is not an investment advice, it is a note for myself to follow up.


Trading Area on CSCO Today, we will speak about a clear zone we can see on CSCO
a) This level is between a support zone and a resistance zone
b) In the past, we saw a clear bullish movement from 50.00 to 57.50
c) Now we are observing similar behavior in the current zone.
d) The price is above a clones channel, and we expect a continuation movement towards the Next resistance zone at 57.5
e) The expected time for this movement is around 40 to 60 days.
Thanks for reading!

Cisco Put?Company Profile:
Cisco Systems, Inc. engages in the design, manufacture, and sale of Internet Protocol based networking products and services related to the communications and information technology industry. The firm operates through the following geographical segments: the Americas, EMEA, and APJC. Its product comprises of the following categories: Switches, Routers, Wireless, Network Management Interfaces and Modules, Optical Networking, Access Points, Outdoor and Industrial Access Points, Next-Generation Firewalls, Advanced Malware Protection, VPN Security Clients, Email, and Web Security. The company was founded by Sandra Lerner and Leonard Bosack on December 10, 1984 and is headquartered in San Jose, CA. The listed name for CSCO is Cisco Systems, Inc. Common Stock (DE).
Financials (Comparison vs Microsoft)
Competitors: Zoom, Microsoft, Amazon Web Services
There are 7 things I compare when researching stocks. I make sure I find at least 2 strong competitors for the best analysis I can give! I only post 1 comparison for the sake of time.
1. Return on Investment Capital
2. Price to Book Ratio
3. Price to Earnings Ratio
4. Net Margin%
5. Return on Total Assets
6. Return on Equity
7. Earnings per Share
1. ROIC
Company: Cisco
2020 22.84%
2021 21.33%
Company: Microsoft
2020 23.56%
2021 26.05%
2. P/B Ratio
Company: Cisco
2020 5.18
2021 4.30
Company: Microsoft
2020 13.02
2021 14.02
3. P/E Ratio
Company: Cisco
2020 17.20
2021 15.76
Company: Microsoft
2020 35.31
2021 36.04
4. Net Margin %
Company: Cisco
2020 22.75%
2021 18.22%
Company: Microsoft
2020 30.96%
2021 35.90%
5. Return on Total Assets
Company: Cisco
2020 11.64%
2021 11.16%
Company: Microsoft
2020 15.06%
2021 17.48%
6. ROE
Company: Cisco
2020 31.37%
2021 28.83%
Company: Microsoft
2020 35.31%
2021 42.70%
7. Diluted EPS (Recent Two Quarters)
Company: Cisco
Q4 0.62
Q1 0.51
Company: Microsoft
Q1 1.82
Q2 2.03
Fundamental Analysis
To keep things simple, I like this stock for a PUT due to their market competitors. They are in competition with some other big dogs in the industry who have better financials than Cisco in my opinion. After looking at their financials the main thing I noticed in comparison with Zoom and Microsoft was the NET MARGIN%. Cisco ranged from 22.75% to 18.22% while Microsoft (15.06 %to 17.48%). These were yearly comparisons and it tells me that Cisco isn't profiting as much as they could be compared to other market leaders.
Technical Analysis
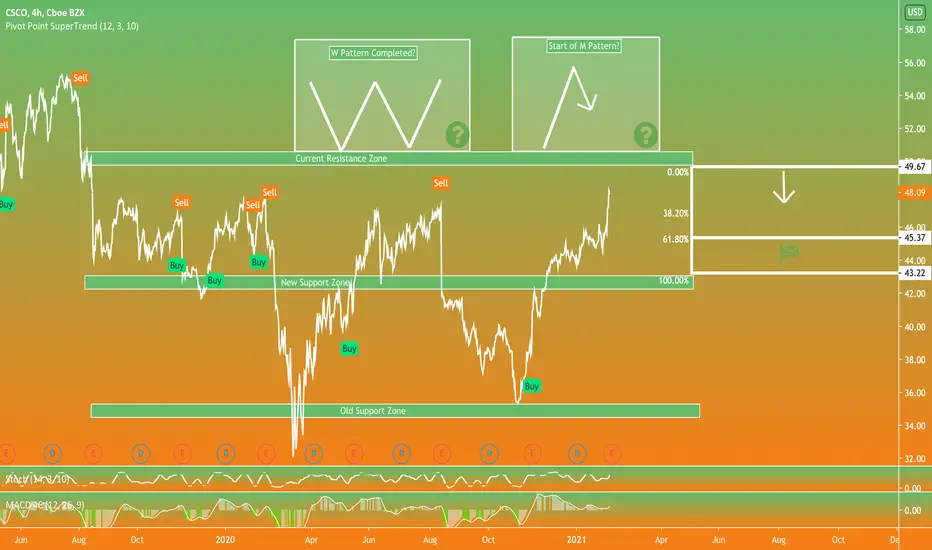
Stochastic RSI: White line is above the green line which means price is overbought while also being in a resistance zone.
Fibonnaci: Ranged from the potential "Current Resistance Zone" to the "New Support Zone". I'm looking for a retracement of the previous low being $43.72. I'm expecting a retracement of anywhere between 30% and lower.
MacD Squatter: White line is still above the zero line but momentum is losing on smaller time frames.
Current Price:$ After Hours $49.50
Strike Price: $45.37 and lower if lucky.
Stop Loss: $55.11
Like, Follow, Agree/Disagree!
Let's talk about it!
- Amateur Robinhood Trader lol
Buy CSCO 10/1/2021Cisco share is moving in a short-term uptrend.
The stock is testing EMA 13 and 34 .
Therefore, a purchase can be target 48.17 and stop losses of 42.43

$CSCO short setup if market turns in next couple of weeksplease share thoughts particularly if you use elliot wave and can give feedback. room to run within macro channel but other factors considered i think it completes wxyxz and macro X within 10 days.
thank you.


Cisco systems inc. LONG📈 NASDAQ:CSCO LONG H4
🛒BUY above = 37.38
🎯Target1 = 37.93
🎯Target2 = 38.83
🛑Trailing Stop loss = 36.48
❌Cancel trade and open reverse trade = 36.48
🙈Recommended risk = 1-2%
#CSCO #CSCOLONG #BUYCSCO

Don't blow this rare investment opportunity! CISCO buy signals.Cisco, MN: Support line + Mirror level + Side of Bollinger bands + Nice discount

Zoom up 750% YTD and a market cap of $165 BILLIONZoom now has a market cap of $165 billion. It's 750% YTD and trades at a price-to-sales ratio of 126. Wow! I don't remember the last time I saw a stock rip like this with that kind of valuation and market cap. It is truly impressive, but also possibly slightly overextended. I have no position, but am watching closely. Zoom has become THE barometer for economic activity and work-from-home trends.
A price-to-sales ratio of 126 makes no sense to me. Even if they double their revenue over the next 12 months, they will still have a PS ratio of 63. And then if they double their revenue AGAIN, they will have a PS ratio of 31.5. This is possible, but those are some loft expectations. But this market knows better than I and it seems a lot of people have strong conviction in these companies to continue expanding and growing. I wrote something similar about Twilio the other week and it's already up a cool 10% since. No matter how overvalued you think these companies might be, the opportunity is perfect for them to continue growing, to make acquisitions, and to invest in new areas with cheap capital.
One thing to keep in mind is that Cisco has a market cap of $165 billion. Yet they pay a dividend, have cash, and do almost 10x more in revenue. However, Cisco is not growing as fast as Zoom. The question becomes: will Zoom keep growing and taking market share from Cisco and others? Let's find out. I'll be watching and thanks for reading. I hope you found this interesting and insightful.

CISCO SYSTEMS INC. LONG📈 NASDAQ:CSCO LONG H4
🛒BUY above = 39.75
🎯Target1 = 41.10
🎯Target2 = 42.00
🎯Target3 = 43.35
🛑Stop loss or cancel trade = 37.55
🙈Recommended risk = (2%-3%)
