Cl!

Nat Gas Rejected This is the first time I have charted Nat Gas on Tradingview so we are starting with a blank canvas.
We completed a large 5 wave sequence in the first quarter of 2016 and have since bounced in what has been a corrective ABC. This has clearly completed and we are looking at a very aggressive rejection.
Support at 2.3 / 2.5 is approaching but the sustained weakness shows no signs of stoping. The aggressive move away from the highs look impulsive in nature and continuation of the sequence to the downside looks cooked.
All the best

Auspicious 31 period hourly moving average for Light Crude Oil Hello everyone! I am student and want to trade a little with my savings so that I can learn the basics and have my burns early.
I was always fascinated by the graphs and technical analysis, but I would not consider myself at all proficient at it. Nevertheless, I do enjoy taking the chalk to the charts!
TA always felt like a method of minimizing uncertainty, often unfortunately bordeline to predictions with a crystal ball. The first graph I publish is my look into the crystal ball for the current (February 2019) WTI oil market (I hope that is the one, still not 100% clear on the different types).
The chart is HOURLY , the white dotted line is the 31 period normal moving average .
The crystall ball with this one seems clear and simple:
1. Look to BUY when price is below!
2. Look to SELL when price is above?
Caveats; it is a clear uptrend within which I am denoting my observations;
oil reacts to geopolitics or twitter politics, can't predict those consistently (especially the latter);
I am less confident with the sell option just glancing at the graph, but the buy occasions seem very auspicious.
Unfortunately, I did not trade any of these. I entered CL Oil after the whole commotion with the Trump tweet, but in the future I will keep an eye out for opportunites to test this observation.
I expect the post-Trump tweet recovery to retrace below the observed moving average before the previous uptrend continues explosively, especially regarding the possibilities for armed escalation between India/Pakistan, and OPEC defying the USA due to Russian backing.
Thank you for reading and I look forward to joining the community here at tradingview!
Strossi

USDCAD long term trendRise in USDCAD is long term trend. If a global deflation slow down hits and oil falls, then USDCAD is a long term long. $USDCAD #USDCAD

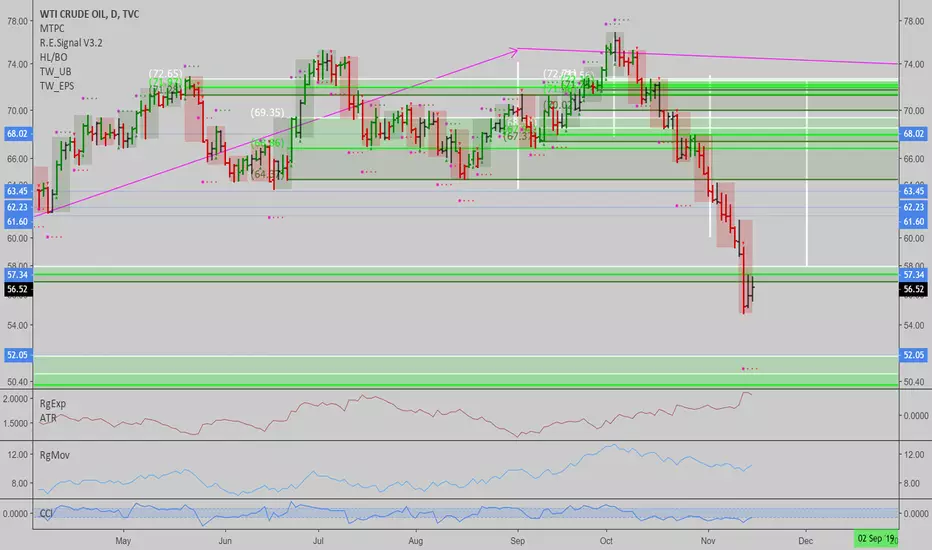
Crude Oil Readying for Another Push HigherCrude Oil appears to be setting up for another run up in a continuation of its rally since the fourth quarter route of last year.
A Minor Pivot Stack is in place, but the price will need to confirm strength on a move through yesterday's high first.
Then the Pivot Stack should provide a much more convincing support level.
Go long if the price trades through 54.18 and place a stop loss at 52.22 with a profit target of 57.37
Use the March 2019 contract, symbol CLH2019, on the ICE Futures exchange with any NFA registered U.S. futures broker, both regulated by the U.S. Commodity Futures Trading Commission.
Be prepared to roll the contract over to the next month, the April contract, symbol CLJ2019, in about a week, if the trade is active.

WTI Oil fractal playFractals or not really a thing in this market, but i just had to show this one because it looks so similar. I remember back in Sep/Oct that the last big wave up was just to bully out the bears before it would drop. This last move of the past week gives a similar feeling to me. So i took a closer look and i remembered the movement of 2018 and seeing these similarities. A good confirmation would be a decent push down tomorrow towards the 55.0 at least, then a correction up below a resistance level . If we see something like that happen, i will probably short it.
Previous analysis:


Bearish Outlook for Crude Oil - LT Support Turned ResistanceThe recent sell off in crude oil broke below a rising trendline dating back to 1999. Although this line has held up as support numerous times, it was broken in 2015, which lead to a subsequent fall all the way down to $25.
After bears made a convincing move back below the tendline in October of last year, bulls rallied back, but were rejected at the newly support turned resistance bottom side of the trendline.
There is a second trendline which acted as support in January 2009 and January 2016. This second trendline is valid all the way back to 1990 and is now the bottom of a giant falling wedge. The chances of a pending global economic recession would fundamentally support a big sell off in crude and from a technical standpoint, a move back down to test the bottom of the wedge.
Sell into rallies. Bulls don't have a very convincing argument at the moment. Price should remain below $55 / trendline support, with substantial possible downside.


CL - Watch the price action before to sell CL Watch the price action if the price closes below $53.06 before to sell.

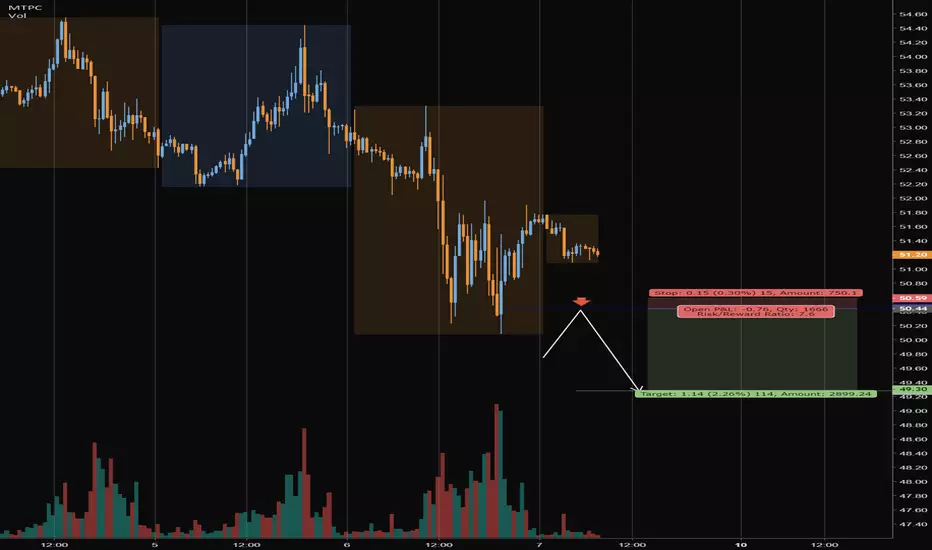
Crude Oil Setup for Short SellCrude has another Minor Pivot Stack setup, but this time it is above the current price. Hence, this is an indication of a short trade with resistance from the Stack.
With a good probability setup like this, go short on confirmed weakness through 51.26. Place a stop loss at 53.69 and the profit target at 48.15.
Trade the March 2019 contract, symbol CLH2019, on the ICE Futures exchange with any NFA registered U.S. futures broker, both regulated by the U.S. Commodity Futures Trading Commission.

Crude Oil Rally Could ContinueThere is a Minor Pivot Stack in place that is looking quite supportive of Crude Oil.
The market has rallied nicely to these levels and still looks strong despite the recent bearish trend.
With a potential profit target at 59.06 this makes for a good risk reward trade.
Go long if the price rallies through 53.35 and place a stop loss at 50.48.
Trade the February 2019 contract on the ICE Futures exchange with any NFA registered U.S. futures broker, both regulated by the U.S. Commodity Futures Trading Commission.

OIL USO CL - Head & Shoulders PatternA head and shoulders pattern has formed on the hourly charts for light crude futures. This marks the potential for a bullish reversal and a sustained break below the neckline could see price drop as low as $49-$49.50.
To learn more about my trading strategies check out www.tradingwithkrugman.com

USOIL: Oil has bottomed this timeI think we have good odds on the long side here. Tight stop under last week's low and off we go.
Once oil gets overbought again, we can trail stops in profit. OPEC will be interesting to watch this month.
Best of luck,
Ivan Labrie.
Fib Analysis on Crude OilGetting this chart up for a long entry at $45.41, based on the 50% retracement holding at $44.68. Based on the prior scorching downtrend, really wanted to make sure that this held first.
*My fib retracement tool is reversed to show extension levels*
Take profit: $49.33
Stop loss: $43.75
Floor trader pivot gave support on S1 at around $42.50-$43. Someone pointed out to me that the larger month-based floor trader pivot has S1 marked at right about $45, creating multiple support levels across multiple time frames (always the best trades to take).
I am always starting on the macro 1w and 1d charts before drilling down into the 4hr, 1hr, 30min charts. Oversold conditions for a while now, and some other qualitative factors make this a viable short-term long entry.

CRUDE OIL REVERSAL Hi Guys, today we're looking at WTI crude oil or CL1 on the monthly chart and right off the bat it is looking like a reversal is very close. We can see many technical indicators that point to this. As you can see firstly illustrated by the yellow circles on our chart that the $40 area has long term support going as far back as 1990 even.
Price action is supported by the 200SMA on the 2 month chart (400 SMA on the 1 month)a very significant area of support. Can it go lower? Yes, perhaps even to 40 area. On the fib chart we can see the price point has fallen past the .618 extension but I suspect that on the one month chart this will appear as a shadow candle which would mean a sharp rebound over the remaining week of 2018. Also look at the rising MACD which is very similar to the structure that formed right around July 2011.

Long crude on inverse h&s necklineInverse H&S neckline retest. Pink line is the inv. h&s neckline.
Here is a zoom in on 12 hour.
Zoom in on 4 hour.

ESV on the 13 TD Countdown Exhaustion SignalESV extending its decline beyond the Brent move, opening a divergence. Gap should fill.
It's also close to previous major bottoms.
Sentiment on extreme low.
Demark indicators pointing for reversal.
Target 6.12
Stop 4
E

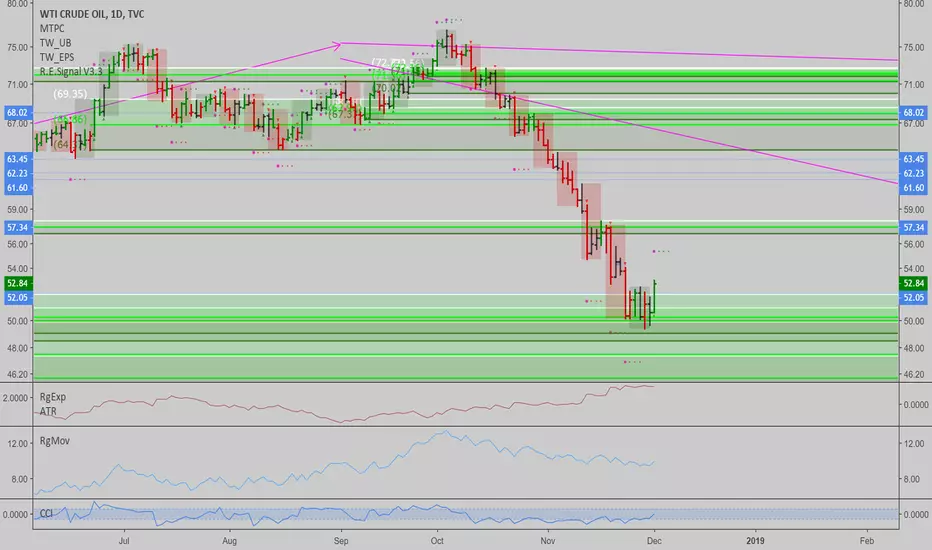
12.07.2018 CL Friday trading planDay - Down
Vol - Down
Vol range - Up
Trading plan - SELL after breakout
CL 2 MONTH SYMMETRICAL TRIANGLECL 2 MONTH REVERSAL SYMMETRICAL TRIANGLE IS FORMED.
BUY: 64
TAKE PROFIT: 58
STOP LOSS:63

USOIL: Correction is likely overI think we have decent odds for a bottom in oil here, after some talks about big players indulging in naked put selling surfaced, banks that -violating regulations- sold put options without any kind of coverage. It could have been that the market was being pushed down to margin call the traders behind these leveraged long positions in oil.
Natural gas has surged tremendously since oil topped, which likely is a short squeeze as well, as per @timwest's analysis, but interestingly, the last spike to the upside didn't correlate with a spike to the downside in oil...
Evidence indicates oil has bottomed, holding technical support from fundamental events (OPEC meeting key level price zone), since we haven't plotted daily highs below this zone yet and the decline has slowed down, forming a couple of inside days.
I bought into a few oil related names and oil futs today, my clients have received updates revealing these picks and the entry and sizing earlier today.
Best of luck for us all,
Ivan Labrie.
CL - Price is stretched. High potential for a reversalPrice is at the Warning Line (WL) and stretched out.
If price really can manage to turn from here, the target would be at least the L-MLH (Lower-Medianline-Parallel).
P!

US OIL (CL WTI) Long-Term Sell Well in Play.The bottom of the Daily channel has been tested with the touch into 66 and whilst this is likely just a wave i of 1 of 5 of C....the overall count is holding up well. Only a monthly close over 80 WTI would change the count.
The next challenge after this bounce in wave ii of 1, is to break the 66 and more importantly the 63 level. A break of 63 can open a veritable floodgate, though will let price and time dictate that as moves forward. The wave 5 does target under $20 so there's some potential in this black gold.
