usoil $35.5 targetLook likes potential target of $35.5. Would complete bearish cypher pattern if reached. Price target also lines up with some long term downtrend lines.
Cl_f


CRUDE "WEEKLY VIEW"WEEKLY PERSPECTIVE....
26.06 - 23.80
MIGHT CAUSE A REACTION.....LOWER TARGETS OF COMPLETION ARE STILL IN "TIME"
$CL_F $USO $DWTI $UWTI $OIL $XLE $DTO $UCO $CVX $XOM $HAL $EXXI $SCO $ETE $XOP

One oz of gold gets you 46 barrels of OilMy bias is more for oil up than gold down over the coming months .$CL_F $GC_F $SPY

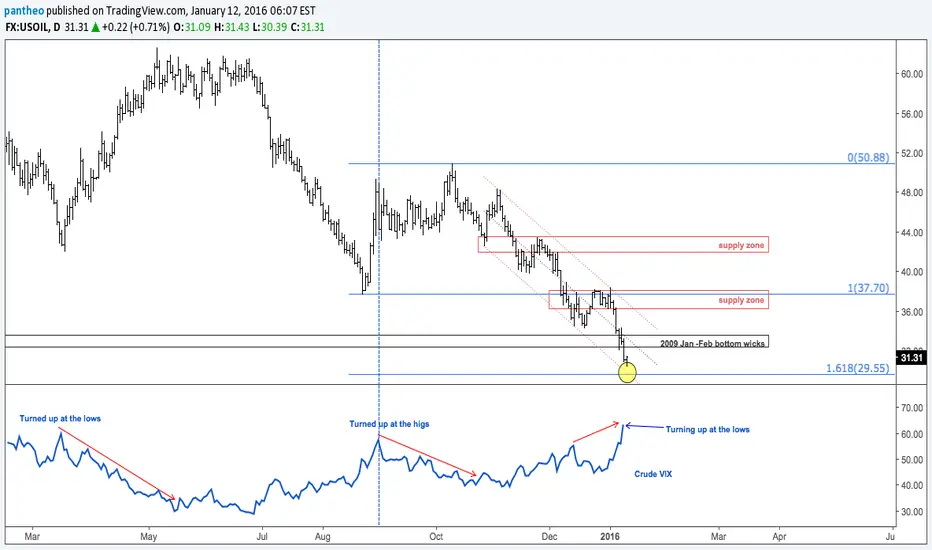
"25" IS THE MARKET BOTTOM THEY SAY........TAKE ANOTHER LOOKBe prepared for anything.....Markets can go lower and extend faster than most people think.
"25" may bring a short term bounce if it gets there. Only follow "The Language of Price". It is all that matters.

UPDATEFOLLOWING THE PATH...POSSIBLE SHORT TERM BOUNCE...PRICE ACTION MUST CONFIRM BUT STILL 26.60 LOOKS VERY POSSIBLE ON THIS SWING TARGET

CRUDE UPDATEINSIDE DAY INTO TIME.... FORMED A BEARISH REVERSAL....CAUTION AT THE BOX....
MANAGEMENT MODE


CRUDE OIL "UPDATE"$CL_F Probabilities of Price.....Laying out a Premise and waiting for "Price Action" to speak.


The Intermediate Bottom In Oil Is Likely TodayAs long as today closes the daily candlestick at a price of 30.57 or higher, the resulting inverted hammer formation is a signal of a potential bottom in oil prices. My price target remains the macro trend line resistance near $34, with a longer-term price target of $39-40.

Bearish Shark will keep Crude in Trading RangeBearish Shark
C notations on the chart
I normally post my charts at Twitter.com
Due to also posting charts from other platforms ....I gather them all there.
Thanks for any thumps up or comments.
Best to your trading
TWUC
@WallStScalper
The ABCD mentioned

ABCD could be in playABCD
C notations on the chart
I normally post my charts at Twitter.com
Due to also posting charts from other platforms ....I gather them all there.
Thanks for thumps up and any comments.
Best to your trading
TWUC
@WallStScalper

$UWTI 3 drive pattern3 drive pattern
C notations on the chart
I normally post my charts at Twitter.com
Due to also posting charts from other platforms ....I gather them all there.
Thanks for thumps up and any comments.
Best to your trading
TWUC
@WallStScalper
This chart ....to be seen as a teaser.

Possible SHS in UWTI Right shoulder nowSHS
Will at the same time close a gap....if
Trade what U C
@WallStScalper

Bulls unleashed and allowed to roam Gaps
Gaps at both ends of yesterday's move. Could be very volatile market ahead.
Bulls just been allow to roam
Trade What U C
@WallStScalper

DWTI Ready to C a "Rise" Again Trendline & structural support
Was predicted last week if you saw my weekly and monthly Elliott Wave count... see below in comments field (done on my Twitter)
Monthly ...see link below
We should see some retrace here in DWTI
I will be looking for a harmonic pattern to set up for the retrace.
Trade what U C
@WallStScalper
Music at the charts: Gabrielle: Rise
www.youtube.com
open.spotify.com

Capitulation in Crude? IKS
Still highly speculative but this could be the start of wave 4 up or the bottom of the last wave down
See my twitter account for the weekly Elliott wave count
twitter.com
Trade What U C
@WallStScalper

Crude ready to be appreciated againBullish EW Count with the help of an Andrew's Pitchfork
Fib says this could be it... The area for a reversal.
To pick theeee exact spot is difficult but support is in this area.
If support is broken next support comes in at the $25ish handle.
For the moment I'm neutral but will get very bullish if we see some consolidation and up move here.
Remember it's a monthly chart.
Trade What U C
BLawrenceM for @WallSt$calper

USOIL - Next leg in prices to start soonAfter 5 weeks of consolidation, the next leg in oil prices could be starting either this week or next. My bias is for an upward break out of the recent consolidation range of 57-61, If that occurs, i have upside targets of 63.5, 69.5, and 73. The time frame for completion of this next leg higher is approximately late June to mid July. A close of above the orange area noted would give me increased confidence in the ability of price to achieve my upside targeted range (noted in green).
Alternatively, a daily close below the recent lows of 57 would negate this target within the specified time frame. This would also increase the chances of hitting down side targets of 53 and 49.
I have also include a comparison to the 2008-2009 time frame as this collapse and recovery has acted well as a guide to the current move. Both time frames have exhibited similar patterns in price, momentum, and seasonality throughout the move lower and subsequent bottom. Should this analogy continue, this too would support oil hitting an upside target of 69-73 this summer.
