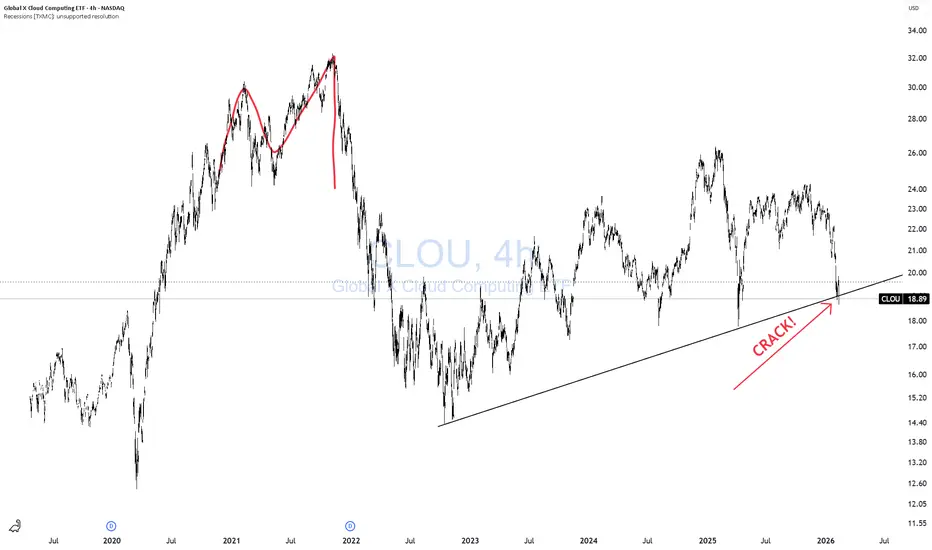
CLOUD ETF CRACK!We can all agree there is a definite revaluation going on in markets of late. This is consistent with software companies going through multiple contractions, as there is too much spending and not enough earnings growth.
CAUTION!
THANK YOU for getting me to 5,000 followers! 🙏🔥
Let’s keep climbing.
If you enjoy the work:
👉 Drop a solid comment
Let’s push it to 6,000 and keep building a community grounded in truth, not hype.
Cloud
Why Microsoft Stock Is Falling After Strong EarningsMicrosoft delivered a solid earnings beat, yet its stock shocked investors by sliding nearly 10% in a single session. That kind of drop after strong results sends a clear message. Wall Street is no longer impressed by growth alone. It wants efficiency, discipline, and proof that massive AI spending will actually pay off.
The sell-off was driven mainly by Microsoft’s higher-than-expected capital expenditure and softer cloud growth expectations. The company disclosed $37.5 billion in CapEx for the quarter, with almost $30 billion spent on property and equipment such as GPUs and CPUs to support Azure and AI workloads. While these investments highlight long-term ambition, investors focused on the near-term cash burn and pressure on margins.
Azure growth was another sticking point. The Intelligent Cloud segment posted 28% year-over-year revenue growth to $32.9 billion, a strong figure by most standards, but it fell short of the market’s lofty expectations. Gross margins in the segment also declined as AI-related costs continued to rise. Management further acknowledged capacity constraints in data centers and AI infrastructure, raising concerns that demand may outpace Microsoft’s ability to deliver and monetize services efficiently.
Analysts responded by trimming price targets while maintaining bullish ratings. JPMorgan lowered its target to $550, citing CPU supply constraints that could weigh on Azure growth. Goldman Sachs cut its target to $600, while Deutsche Bank and BMO Capital also reduced targets, pointing to Azure growth that was solid but not spectacular enough for current valuations. Some fund managers echoed this view, saying the market is now rotating away from “promise-driven” AI trades toward companies showing clearer returns.
Looking ahead, Microsoft’s long-term outlook remains constructive, supported by its dominance in enterprise software, cloud, and AI. However, heavy spending, margin pressure, and infrastructure bottlenecks could keep the stock volatile in the near term. The longer-term story is still bullish, but investors may demand patience and proof before rewarding the stock again.

MU – Trend Still Intact, EMA50 Bounce SetupMU - CURRENT PRICE : 220.00 - 222.00
Technical Reasons (Bullish Bias)
1️⃣ Price retesting strong dynamic support
Price is holding above the 50-day EMA, which has acted as support throughout the uptrend. Pullback into EMA50 often forms a bullish continuation point.
2️⃣ Price still above the Ichimoku Cloud
Price is trading above the cloud, meaning long-term trend remains bullish. The cloud is thick — showing strong trend support. Latest pullback is testing the top of the cloud, usually a high-probability bounce area.
3️⃣ RSI turning up from mid-zone (not overbought)
RSI is around 50, which is a healthy reset in an uptrend. No overbought conditions → room for upside continuation.
4️⃣ Trend structure remains bullish
Higher highs & higher lows remain intact. Current candle shows buying interest at key support.
5️⃣ Market respects previous breakout area
Price pulled back to retest September–October breakout zone → classic break-and-retest setup.
ENTRY PRICE : 218.00 - 222.00
FIRST TARGET : 236.00
SECOND TARGET 260.00
SUPPORT : 201.00

SPS Commerce | SPSC | Long at $77.51SPS Commerce NASDAQ:SPSC is a leading cloud-based supply chain management software provider, specializing in electronic data interchange (EDI), fulfillment, and e-commerce integration solutions. Key customers include major retailers like Walmart NYSE:WMT , Target NYSE:TGT , Home Depot NYSE:HD ; Procter & Gamble NYSE:PG , Nestlé OTC:NSRGY ; Sysco NYSE:SYY , and US Foods NYSE:USFD . As of 2025, SPS Commerce serves over 12,000 customers and connects to more than 100,000 trading partners globally.
Technical Analysis
The price fell through my "crash" simple moving average zone (green lines). This area is often an algorithmic share accumulation zone. The price spiked into the "crash" zone as the day went by after the earnings release. While this is still a high growth stock, there is still risk with the slowing economy, P/E ratio of 36x, and two open price gaps on the daily chart near $58 and $38. These price gaps will likely get filled if the US enters a recession, but are we really there yet? Depending on where you look (retail vs tech), there answer varies. But my bets are no - publicly. There is usually a Christmas rally every year, and NASDAQ:SPSC is in "oversold" territory in the near term. The price may dead cat bounce to $53, but I suspect it would take major negative economic news or a breakdown in company fundamentals to get there.
Financial Health
Debt-to-equity: 0x (healthy)
Quick ratio / ability to pay current bills: 1.5 (healthy / able to pay)
Altman's Z Score / bankruptcy risk: 19 (extremely low risk)
Earnings and Revenue Growth
Earnings per share growth from 2024 ($3.48) to 2028 ($6.52): 87.4%
Revenue growth from 2024 ($638 million) to 2028 ($1.03 billion): 61.4%
www.tradingview.com
Action
Given the overall health of the company, potential for a Christmas rally, and technical analysis "crash" entry, NASDAQ:SPSC is in a personal buy zone at $77.51.
Targets into 2028
$90.00 (+16.1%)
$100.00 (+29.0%)

FIL Is Losing Bearish Momentum => Bullish Takeover Soon?📉FIL has been printing a series of progressively weaker bearish impulses, first a big drop, then a smaller one, and now a flat one.
This loss of bearish strength is happening while price is hovering above a major demand zone (orange), a level that previously triggered a massive rally.
📉📈Notice how the bearish swings are curving and flattening (dotted pink curve). This is often an early sign that sellers are exhausting.
⚔️As long as FIL remains above the demand zone, we will be looking for bullish reversal setups, especially if price retests the orange zone one more time and rejects it.
🏹For the bulls to take over entirely, price needs to break above the blue consolidation zone, confirming a shift in momentum.
Do you think FIL is gearing up for a bigger move? Let me know below! 👇
⚠️ Disclaimer: This is not financial advice. Always do your own research and manage risk properly.
📚 Stick to your trading plan regarding entries, risk, and management.
Good luck! 🍀
All Strategies Are Good; If Managed Properly!
~Richard Nasr

Zscaler: Downward Shortly after our last update, Zscaler faced significant downward pressure—completely in line with our primary scenario. This move allowed the stock to turn lower in time, staying below the resistance at $340.25 and avoiding our alternative scenario of an early breakout above that level. However, a quicker peak for the turquoise wave alt.Y remains a possibility, as we still assign a 37% probability to such an accelerated sequence. Primarily, though, we expect further sell-offs as part of the magenta wave , which should eventually give way to renewed gains above the support at $164.78. With wave , the regular wave Y should then complete above $340.25.

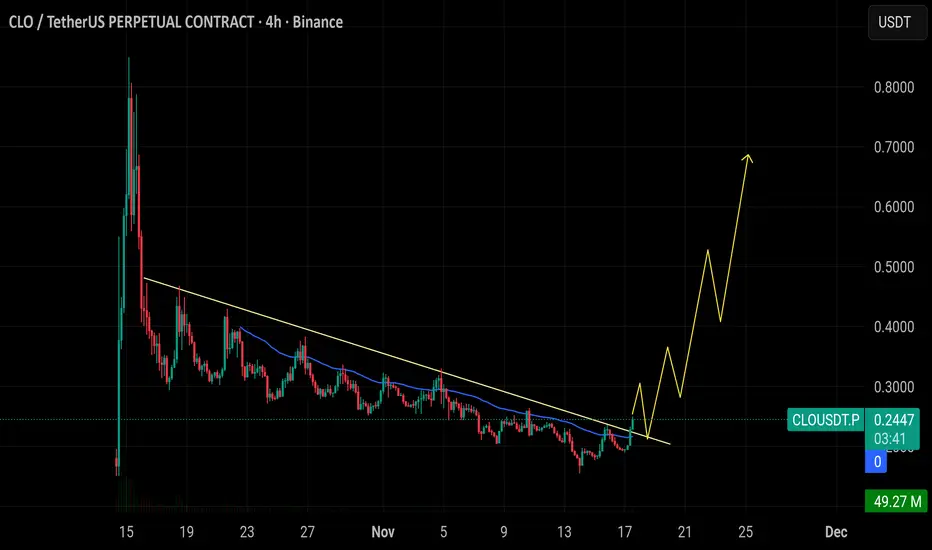
$CLO just broke descending trendline on the 4H chartLSE:CLO just broke descending trendline on the 4H chart and is starting to build its first higher lows. As long as price holds above the breakout zone near 0.20 to 0.24, momentum can shift fast. If buyers keep control, the next impulsive leg toward 0.35 then 0.50 and possibly 0.70 opens up.
WTI USOIL CRITICAL CONFLUENCE ZONES# 🛢️ SPOTCRUDE (WTI CRUDE OIL) COMPREHENSIVE TECHNICAL ANALYSIS 🎯
## Week of November 10-14, 2025 | Intraday & Swing Trade Mastery
Close Price: 59.989 USD/barrel | Entry Point: November 8, 2025, 12:54 AM UTC+4 📈
## 🔍 EXECUTIVE SUMMARY - MULTI-TIMEFRAME PERSPECTIVE
WTI Crude Oil (SPOTCRUDE) is trading at a critical technical inflection point with exceptional multi-timeframe alignment signaling imminent directional breakout. Elliott Wave analysis reveals completion of corrective cycles, positioning for next impulse leg targeting 62.50-65.00 extension zone with powerful momentum. Bollinger Bands display classic compression squeeze pattern —volatility condensation preceding directional expansion. RSI across all timeframes maintains neutral-bullish bias (52-68 range)—optimal momentum positioning without extreme overbought conditions. Volume clustering at 59.50-60.50 represents significant institutional accumulation foundation. Wyckoff spring tests near 58.50-59.00 provide aggressive entry triggers. Harmonic pattern convergence at 61.00-62.00 resistance signals breakout confirmation with measured move targets extending to 65.00+. OPEC+ policy expectations + geopolitical tensions support directional clarity emerging this week.
## 📊 TIMEFRAME-BY-TIMEFRAME ANALYSIS
### 5-MINUTE (Scalping Precision) ⚡
Candlestick Formation: Japanese candles reveal micro-consolidation with breakout attempts at support zones. Evening Star rejection formations detected at 61.50-62.00 intraday resistance creating reversal opportunities.
Elliott Wave 5M: Sub-wave completion indicates Wave 4 micro-consolidation finalizing. Wave 5 breakout anticipated above 60.20-60.50 with targets 61.50-62.00 (measured move).
Bollinger Bands: Upper compression mode—middle band at 59.95 acts as pivot point. Lower band rejection (59.20-59.50) creates scalp-long setups with excellent risk/reward.
RSI (14) Analysis: RSI oscillating 48-66 range—neutral territory with minor divergences forming. Bullish divergence at 59.30 support signals buyer engagement; caution on 72+ resistance.
Micro Support/Resistance: 59.20 (micro-support) | 59.70 (POC cluster) | 60.20 (pivot) | 61.20 (intraday resistance) | 61.80 (scalp target)
Volume Signature: Volume concentrated 59.70-60.30 zone—institutional marker. Breakout volume >50% above average required above 61.20 for sustained move above 62.00.
VWAP Alignment: Price oscillating around session VWAP at 59.80—each touch generates scalp opportunity. Upper VWAP band at 61.50; lower support at 59.20.
### 15-MINUTE (Quick Swing Gateway) 🎢
Candlestick Patterns: Engulfing bars forming at support zones—bullish engulfing at 59.50 zone confirms reversal attempts. Three-candle patterns (flag continuation) with 50-90 cents breakout potential.
Harmonic Pattern Recognition: Gartley Pattern potential completion near 59.40-59.80 PRZ (Potential Reversal Zone). Exceptional risk-reward at 1:3.6 for harmonic traders. Butterfly variant also forming.
Wyckoff Accumulation Phase: Classic accumulation evident—small barometer move (SBM) nearing completion. Spring test anticipated 58.50-58.90 zone; markup phase targets 62.00-63.50.
Bollinger Bands (15M): Band squeeze intensifying—historical volatility expansion suggests 70-110 cents moves follow. Upper band resistance at 62.00; lower band support at 58.90.
Volume Profile (15M): Point of Control (POC) at 59.85—prime concentration zone. Volume surge >55% required confirming breakout above 61.50. Imbalances favor upside significantly.
Ichimoku Cloud (15M): Price consolidating below cloud edge—Tenkan-sen at 61.50 = resistance pivot. Kijun-sen (61.00) = critical secondary support. Cloud support 59.50-60.20.
EMA Structure: EMA 9 (60.20) above EMA 21 (59.80)—bullish alignment confirmed. Price above both = intraday strength maintained.
### 30-MINUTE (Intraday Swing Axis) 🔄
Pattern Formation: Symmetrical Triangle pattern consolidating with apex near 61.50. Ascending triangle variant shows bullish bias—breakout above 61.20 targets 62.50-63.50 extension.
Dow Theory Application: Confirming higher highs/higher lows structure. Secondary trend bullish; pullbacks to EMA 20 (60.10) = optimal swing entry zones.
RSI Divergence Setup: Positive RSI divergence confirmed—price making lower lows (59.00) while RSI forms higher lows (38 level). Classic reversal setup targeting 61.50 minimum.
Exponential Moving Average: EMA 9 (60.30) = core support pivot. EMA 21 (59.80) = secondary support. EMA 50 (58.50) = structural hold level. Bullish ribbon alignment intact.
Support Architecture: 58.50 (EMA 50/structural) | 59.20 (demand zone) | 59.80 (volume cluster) | 60.20 (EMA 9 dynamic)
Resistance Architecture: 61.20 (triangle formation) | 61.80 (measured move target) | 62.50 (weekly resistance) | 63.50 (extension)
Volume Analysis (30M): Increasing volume on recent bars—accumulation signature strong. Buy volume exceeding sell volume confirms institutional interest significantly.
### 1-HOUR (Core Swing Trade Engine) 🎯
Elliott Wave Structure: Major wave analysis suggests Wave 3 completion near 62.50. Current Wave 4 correction targets 60.50-61.00 support zone. Wave 5 impulse anticipated—target: 63.50-65.00.
Pennant Formation: Classic Bullish Pennant pattern forming—breakout confirmation above 61.50 validates pattern. Pole height measured move = 63.50+ realistic target.
Bollinger Bands (1H): Upper band at 62.50 = squeeze breakout target. Middle band (61.50) = bullish support zone. Lower band rejection (58.50) creates swing longs with excellent R/R.
VWAP Daily: Oil trading above daily VWAP at 59.50—bullish gradient confirmed. Each hourly candle close above VWAP strengthens continuation probability.
Volume Profile Hotspot: Heavily traded at 59.70-60.30 (accumulation zone) and 61.50-62.00 (resistance cluster). Imbalances above 62.50 suggest vacuum-fill potential.
Ichimoku Cloud Alignment: Price above Senkou Span A (61.50) & Span B (61.00)—cloud thickness indicates strong support. Chikou Span above candles = bullish confirmation. Cloud color: BULLISH GREEN.
Gann Theory Application: 45-degree angle from swing low (57.50) establishes rally trajectory. Resistance at 38.2% Fibonacci extension (61.80) precedes aggressive breakout phase.
Support Tiers 1H: 58.50 (structural hold) | 59.20 (EMA support) | 59.80 (Kijun-sen) | 60.30 (accumulation zone)
Resistance Tiers 1H: 61.50 (breakout trigger) | 62.00 (extension) | 62.50 (major level) | 63.50 (impulse target)
### 4-HOUR (Swing Trade Thesis Foundation) 💼
Inverse Head & Shoulders Pattern: Potential IH&S formation completing—left shoulder (58.20), head (57.80), right shoulder completing (58.50-59.00). Neckline breakout at 61.50 targets 63.00-64.00 extension.
Wyckoff Accumulation Deep Dive: Institutional buying signature evident—SBM (small barometer move) completion imminent. Spring test to 58.20-58.60 anticipated; subsequent markup phase targets 63.50-64.50.
RSI 4H Analysis: RSI at 56-70 range—bullish bias maintained. Room for upside extension without extreme overbought. RSI above 74 targets 63.50+; below 34 = defensive posture required.
Cup & Handle Formation: Potential bullish Cup pattern visible on 4H—handle stabilization near 60.20-61.00. Breakout above handle (61.80) targets cup depth extension = 63.50-64.00.
EMA Ribbon Structure: EMA 8 (60.80), EMA 13 (60.50), EMA 21 (59.80), EMA 50 (58.50), EMA 200 (56.00)—BULLISH ALIGNMENT PERFECT. Compression/expansion cycles identify momentum phases.
Support Tiers 4H: 58.20 (structural support) | 58.50 (accumulation) | 59.50 (pivot) | 60.30 (demand cluster)
Resistance Tiers 4H: 61.50 (key breakout) | 62.00 (extension) | 62.50 (major target) | 63.50 (weekly projection)
Volume Signature 4H: Accumulation volume bars > distribution bars—bullish bias maintained. Volume nodes clustering at 59.70-60.30 indicate strong institutional support zone.
### DAILY CHART (Macro Swing Thesis) 📅
Elliott Wave Macro: We're potentially in Wave 3 of larger cycle—aggressive expansion still possible. Wave structure supports break of 62.50 targeting 64.50-66.00 daily close objectives.
Double Bottom Recognition: Historical Double Bottom pattern near 57.00-58.00 support—confirmed breakthrough above 61.50 neckline triggered. Second target near 63.00-64.00.
Bollinger Bands Daily: Upper band at 63.50 = realistic daily target zone. Mean (61.50) = healthy pullback support. Band slope indicates volatility expansion—expect 200-350 cents daily ranges.
Volume Profile Daily: Strong buying volume bar at 58.50-60.00 zone—institutional accumulation marker established. Selling volume decreasing—demand controls trend absolutely.
Ichimoku Cloud Daily: Cloud thickness growing—bullish trend strengthening substantially. Cloud support around 60.00-61.50 zone. Kumo breakout anticipated—targets cloud top at 62.50-63.50.
Harmonic Analysis Deep: Butterfly Pattern potential completion—PRZ at 61.50-62.00 suggests reversal zone OR breakout confirmation. Confluence amplifies probability of extension.
Gann Angles & Fibonacci: 50% retracement (59.50) + 61.8% extension (62.50) = key reversal zones. Gann fan angles suggest 62.00-63.00 as structural resistance before continuation.
Key Daily Support: 57.80 (psychological/structural) | 58.50 (accumulation zone) | 59.50 (demand level) | 60.20 (midpoint)
Key Daily Resistance: 61.50 (breakout trigger) | 62.00 (extension) | 62.50 (measured move) | 64.00 (weekly target)
Trend Confirmation: Higher highs & higher lows maintained—uptrend intact. Daily close above 62.50 = strong continuation signal targeting 65.00+ next level.
## 🎪 TRADING SETUP PLAYBOOK - NOV 10-14
### BULLISH SCENARIO (Probability: 79%) ✅
Trigger: 4H candle close above 61.80 + volume surge (>50% above average) + RSI above 64
Entry Zone: 61.00-61.50 (with breakout confirmation signal)
Target 1: 62.00 (TP1) | Target 2: 62.50 (TP2) | Target 3: 63.50 (TP3) | Target 4: 64.50 (TP4)
Stop Loss: 59.70 (below EMA/structural support)
Risk/Reward: 1:3.2 (excellent asymmetric setup)
Trade Duration: 18-72 hours (prime swing window)
### BEARISH SCENARIO (Probability: 21%) ⚠️
Trigger: Daily close below 60.20 + volume increase + RSI divergence failure
Entry Zone: 61.80-62.50 (short setup)
Target 1: 61.50 (TP1) | Target 2: 61.00 (TP2) | Target 3: 60.20 (TP3)
Stop Loss: 63.50 (above resistance)
Risk/Reward: 1:1.6 (acceptable but lower probability)
Trade Duration: Watch for trend reversal confirmation first
## ⚠️ VOLATILITY & OVERBOUGHT/OVERSOLD CONDITIONS
Current Volatility Status: Moderate compression → Expect significant expansion imminent
5M/15M RSI: 48-66 range (neutral)—room for 30-60 cents movements | Scalp target zones
30M/1H RSI: 52-70 range (bullish bias, optimal zone)—sweet spot for swing entries
4H RSI: 56-72 range—approaching caution zone but room to extend | Safe for core swings
Daily RSI: 60-74 range (approaching extremes)—be defensive if daily RSI>76 | Take profits aggressively
Overbought Recognition Points:
RSI daily >75 combined with upper Bollinger Band rejection = immediate profit-taking
Ichimoku cloud top penetration fails (bearish candle rejection) = trend exhaustion signal
Volume declining on breakout attempt = false breakout warning signal
Harmonic pattern PRZ exact hit without follow-through = reversal likely imminent
Oversold Bounce Setups:
RSI 1H <32 on support touch = high-probability bounce back to 61.50-62.00
Price below EMA 50 (58.50) + RSI <30 = aggressive accumulation zone
Spring test below 58.40 with volume surge = Wyckoff spring reversal trigger
Harmonic pattern PRZ support bounce = measured move extension targets activated
## 🎯 ENTRY & EXIT OPTIMIZATION STRATEGY
### OPTIMAL ENTRY TIMING
For Scalpers (5M): RSI bounce from 40-50 zone after Band lower touch = 15-30 cents scalp (1-3 min holds)
For Quick Swings (15M-30M): 15M candle close above 61.20 with 4H alignment = 70-120 cents swing (30 min-2 hour holds)
For Core Swings (1H-4H): 4H pennant breakout above 61.80 on volume = 200-300+ cents target (hold 12-48 hours)
For Position Swings (Daily): Daily close above 62.50 = continuation play targeting 64.00-65.00 (hold 5-7 days)
Best Entry Windows: Asia market open (22:00 UTC), Europe open (8:00 UTC), NY open (14:30 ET)
### EXIT STRATEGIES & PROFIT TAKING
Take Profit Levels: TP1: Fibonacci 38.2% (61.80) | TP2: Harmonic PRZ (62.30) | TP3: Daily Band upper (63.50) | TP4: Weekly target (64.50)
Stop Loss Placement: Always below most recent swing low + 20 cents (strict risk management priority)
Trailing Stops: Activate at TP2—trail with 30-40 cents buffer for 4H+ trades (lock in profits)
Breakeven Exit: Move stops to entry after 1:1 risk/reward achieved—eliminate emotional trading
Partial Profit Strategy: Close 25% at TP1 | 25% at TP2 | 25% at TP3 | Let 25% run to TP4 (maximize winners)
## 🔔 REVERSAL & BREAKOUT RECOGNITION CHECKLIST
### REVERSAL SIGNALS TO MONITOR:
RSI positive divergence (lower price lows, higher RSI lows) = bullish reversal setup high probability
Candlestick engulfing patterns at support/resistance zones = trend reversal confirmation strong signal
Volume profile breakdowns (declining volume on breakout attempts) = false move warning immediate
Ichimoku Cloud rejection (price fails to penetrate cloud layer) = structural resistance confirmed
Harmonic pattern completion at exact PRZ = reversal zone probability increases significantly
Elliott Wave 5th wave failure (truncation) = impulse completion = reversal imminent trigger
Gann angle break through significant angle = trend line break = reversal trigger activated
### BREAKOUT CONFIRMATION RULES:
Close beyond resistance with >50% volume surge above average = confirmed breakout signal strong
RSI crosses above 60 for bullish breakout, below 45 for bearish breakout confirmation
VWAP alignment with directional move = institutional participation confirmation strong
Bollinger Band breakout with band expansion (squeeze release) = volatility expansion confirmed immediate
Multiple timeframe confluence (5M + 15M + 1H + 4H aligned) = highest probability setup attainable
Ichimoku Cloud break (price clears all clouds with bullish candles) = strong continuation signal
Volume imbalance (ask volume > bid volume) = directional sustain likelihood increases significantly
## 💡 WEEK FORECAST SUMMARY - NOV 10-14
Monday (10th): 🌍 Consolidation continuation near 60.00-61.00 zone. Range-bound trading anticipated. Early breakout direction watch crucial. Entry setups favor reversal plays at support zones.
Tuesday-Wednesday (11-12th): 📈 Prime breakout window opens —61.50 represents key decision point. Expect 150-250 cents daily volatility. Breakout confirmation targets 62.50-63.00 extension. This is the optimal swing trade window all week. OPEC+ headlines watch critical.
Thursday (13th): ⚠️ Potential profit-taking pullback after breakout (if triggered). Support retest of 62.00-61.50. Buying opportunity if pullback holds above 60.50.
Friday (14th): 📊 Weekly close pattern formation critical. Extension run anticipated if above 62.50. If above 63.00 = week target 64.00-65.00 achieved. End-of-week positioning for next week.
## 📍 CRITICAL CONFLUENCE ZONES - KEY TARGETS
58.20-58.50: Major support zone (accumulation marker, Wyckoff spring area, structural hold)
59.20-60.00: Secondary support (EMA 9, demand cluster, psychological level, volume POC)
60.20-61.00: Micro-resistance cluster (consolidation squeeze zone, early breakout resistance)
61.50-62.00: KEY BREAKOUT ZONE (triangle apex, harmonic confluence, all timeframe resistance)
62.00-63.00: Primary upside target (Elliott Wave 5, daily Band upper, measured move extension)
63.00-64.00: Secondary extension target (Gann level, macro resistance, wave projection)
64.00-65.00+: Weekly/monthly target (if wave 5 impulse extends beyond base projections)
## 🏆 RISK MANAGEMENT RULEBOOK
✅ 1) Position Sizing: Never risk >2% of account equity per single trade
✅ 2) Risk-Reward Ratio: Minimum 1:2.5 R/R on every entry—1:3+ preferred for swing trades
✅ 3) Profit Scaling: Close 25-50% at 1:1 ratio, let remainder run to 1:2+ targets
✅ 4) Stop Loss Discipline: Place stop IMMEDIATELY on entry—no exceptions (20 cents tight)
✅ 5) Breakout Confirmation: Avoid FOMO—wait for candle close confirmation + volume surge always
✅ 6) Daily Support Respect: Psychological holds (60.00 | 62.00 | 65.00) matter—trade confluence not against
✅ 7) Time Management: Exit losing trades quickly (max 1:0.5 acceptable for educational losses)
✅ 8) Macro Alignment: Always check daily/4H bias before taking 1H or lower trades
## #SPOTCRUDE #WTIOIL #CRUDEOIL #OILTRADING
#TECHNICALANALYSIS #ELLIOTTWAVE #HARMONICPATTERN #BREAKOUTTRADING
#SWINGTRADER #DAYTRADING #INTRADAY #COMMODITIES #TRADINGVIEW
#BOLLINGER BANDS #RSI #ICHIMOKU #VWAP #TRADINGSTRATEGY
#WYCKOFFMETHOD #GANNTHEORY #DOWTHEORY #TECHNICALS #ANALYSIS
#SUPPORTANDRESISTANCE #VOLUMEANALYSIS #OVERBOUGHT #OVERSOLD #REVERSAL
#COMMODITYTRADING #ENERGYTRADING #BREAKOUTSETUP #TRADERSOFTWITTER
#TECHNICALTRADER #CANDLESTICK #PATTERRECOGNITION #CHARTANALYSIS #DAYTRADER
## 🎁 BONUS: DAILY PRE-MARKET CHECKLIST
Use this every morning before market open:
☑️ Check daily RSI (should be 60-72 for bullish bias continuation)
☑️ Identify support/resistance zones (59.70 | 60.50 | 61.50 | 63.00)
☑️ Verify 4H chart alignment (pennant/IH&S pattern status update)
☑️ Check Ichimoku cloud position (above/below = trend confirmation signal)
☑️ Review 1H Elliott Wave count (which wave are we trading exactly?)
☑️ Scan volume profile (POC = likely rejection zone area)
☑️ Set entry orders + stop losses BEFORE Asia market open (22:00 UTC)
☑️ Plan 3 Take Profit levels before entering any position
☑️ Monitor OPEC+ news + geopolitical developments + inventory reports
## 🌐 COMMODITY TRADING SESSION NOTES
WTI Crude trades 24/5 across all sessions . Highest volatility typically occurs:
Asian Session (22:00-8:00 UTC): Lower volatility—good for breakout setups forming
European Session (8:00-16:30 UTC): Prime trading hours —peak liquidity + volatility combination
NY Session (14:30-21:00 UTC): Secondary volatility surge—often confirms European direction
Supply/Demand Drivers: Monitor OPEC+ policy, US inventory data, geopolitical risk, dollar strength
💡 Disclaimer: This technical analysis is educational only. Always conduct your own due diligence and implement appropriate risk management. Past performance does not guarantee future results. Trade responsibly within your risk tolerance. Use stop losses on every position. Not financial advice.
Analysis Created: November 8, 2025 | Valid Through: November 14, 2025 | Updated Daily

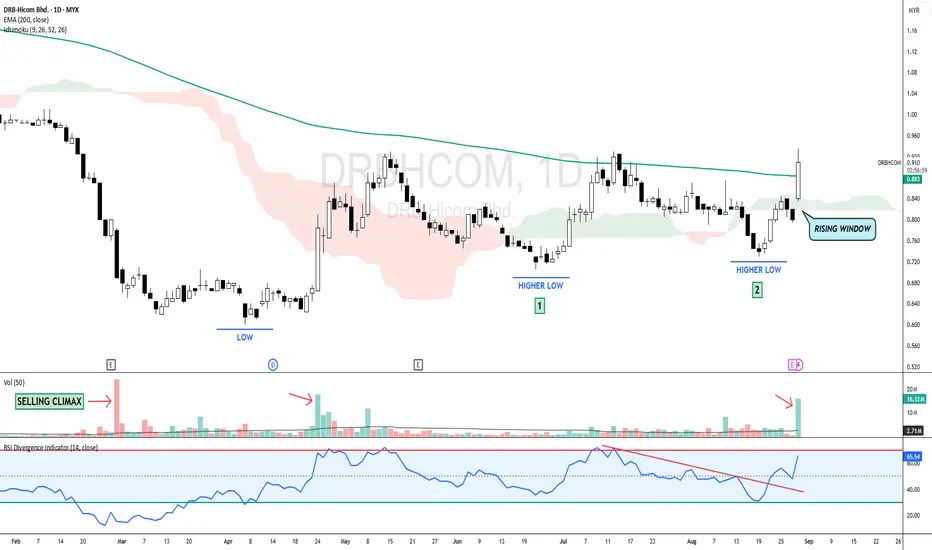
DRBHCOM - BREAKOUT EMA 200 with VOLUME !DRBHCOM - CURRENT PRICE : RM0.910
DRBHCOM broke out EMA 200 with high trading volume. At the same time, the stock is also above ICHIMOKU CLOUD. Take note that the lows in price are getting higher - indicating demand is increasing. This bullish scenario is also supported by recent breakout down trendline in RSI oscillator. RSI is rising and currently at 65.54.
Take note also that there is a double bottom chart pattern with the second low is slightly higher than previous low.
There is possibility that the price may trend higher in near term. Rising window low RM0.820 may acts as strong support.
ENTRY PRICE : RM0.900 - RM0.910
TARGET : RM0.980 and RM1.09
SUPPORT : RM0.820
Notes : The company just announced its QUARTER REPORT. For more details, please visit their website. Previously I had wrote technical report for the company (already hit my both targets). I share the link below here.
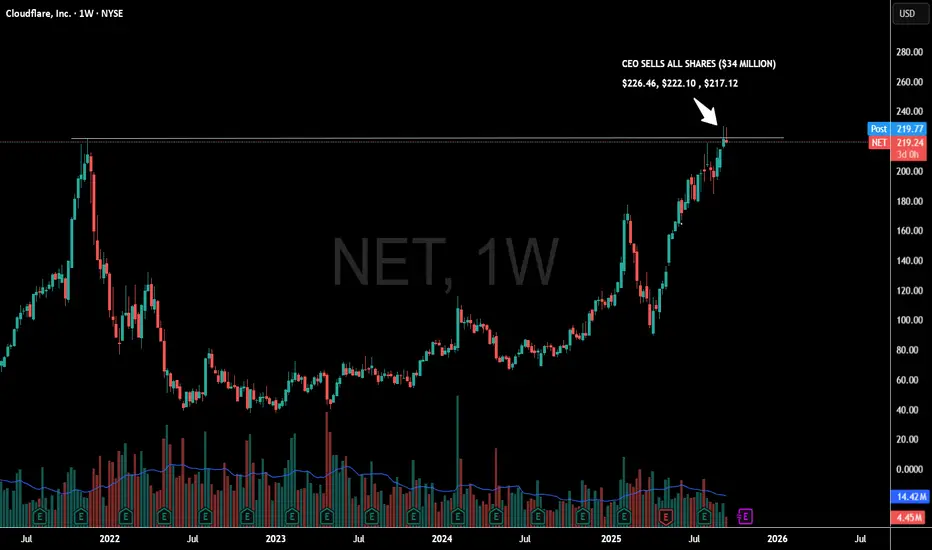
CEO sells all shares....What are the chances this turns out to be the near term cycle high?
Cloudflare has seen a perfect double top retest...right where the CEO has liquidated his entire holdings.
Don't say you weren't warned.
Microsoft (MSFT)–Watching for Pullback Entry After $4T MilestoneMicrosoft Corp. NASDAQ:MSFT has become the second company after Nvidia to cross the $4 trillion market cap, powered by strong AI and cloud demand.
Azure revenue grew 34% to $75B in 2024, with a $30B AI infrastructure investment fueling future growth. Q4 EPS came in at $3.65 on $76.4B revenue, showing strong fundamentals.
We are looking for a pullback to key support for a long entry:
Trade Plan:
Entry Zone: $515 – $518
Take Profit: $536, $555
Stop Loss: $502
#Microsoft #MSFT #Stocks #Trading #StockMarket #TechnicalAnalysis #AI #Cloud #BigTech #NASDAQ

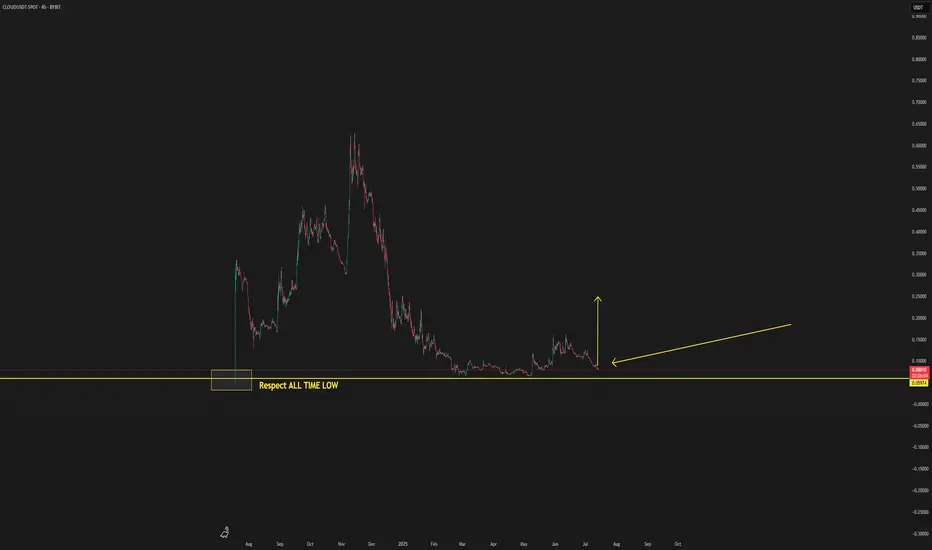
CLOUD THIS CAN BE THE BOTTOM STARTThis is a new coin to watch in the coming period, as it is showing signs of potentially forming a new bottom.
By respecting the previous all-time low, there’s a possibility that a new upward trend could begin from this level. Some indicators are also pointing toward this scenario.
If the coin provides further confirmations, updates will be shared below.
(jasmy) jasmy "array"I can't share my indicator ideas unless I publish them publicly. I don't feel like sharing my indicators with the public is necessary so I guess I will not be publishing many new ideas because the Trading View website is removing features where unpublished custom indicators are allowed to be included in sharing. Trading View is too strict and they keep choking the freedoms of watchlist, now indicators, what's next to be taken away from users of the website?

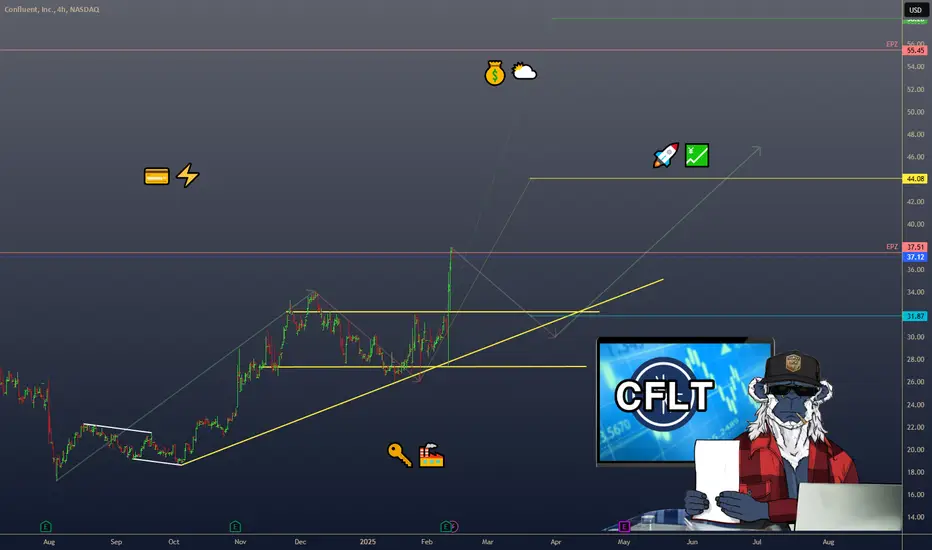
CONFLUENT ($CFLT) – DATA STREAMING’S RISING STARCONFLUENT ( NASDAQ:CFLT ) – DATA STREAMING’S RISING STAR
1/7
Ready for a snapshot of Confluent? Here’s what’s sparking chatter on X: 23% YoY revenue growth, $0.09 EPS (beats by $0.03), and free cash flow at $ 29M—above estimates! Let’s dive in. 🚀💹
2/7 – REVENUE & EARNINGS BLAST
• Overall revenue: +23% YoY
• Subscription revenue: +24% YoY 💳
• Q4 EPS: $0.09 (est. $0.06) ⚡️
• FCF: $ 29M vs. est. GETTEX:27M 💰
3/7 – CONFLUENT CLOUD SHINES
• Cloud revenue: +38% YoY 🌥️
• Big piece of their puzzle—shows they’re nailing the cloud-based approach
• Key to future scaling & recurring income streams 🔑
4/7 – SECTOR SNAPSHOT
• Confluent competes in data streaming & management
• Growth suggests they’re keeping pace—maybe even undervalued if adoption keeps climbing 🤔
• Keep an eye on how they stack up vs. other cloud/data players like Snowflake or Datadog 🏭
5/7 – RISK ASSESSMENT
• Market Saturation: More competitors in cloud/data → potential pricing pressure 💼
• Tech Shifts: Rapid changes could leave older solutions behind 🔄
• Economic Downturn: Slowed IT budgets might delay or shrink deals 🌐
• Customer Concentration: If a few big clients leave, it stings big time 🏹
6/7 – SWOT HIGHLIGHTS
Strengths:
Strong Confluent Cloud growth (+38% YoY!)
Broader customer base (+17%) 🙌
Weaknesses:
Heavily niche in ‘data in motion’ 🤏
High acquisition costs in a crowded market 🏷️
Opportunities:
Expand into new verticals & geographies
AI/ML integration for next-level analytics 🤖
Threats:
Fierce giants with deep pockets 🦖
Regulatory changes in data privacy ⚖️
7/7 – Where do you see Confluent heading next?
1️⃣ Bullish—Cloud growth = unstoppable! 🌟
2️⃣ Neutral—Need more consistent profitability 🤔
3️⃣ Bearish—Competition is too intense 🐻
Vote below! 🗳️👇
Snowflake ($SNOW) | Rerating Incoming with 2-3x PotentialOur top analyst Shay Boloor (@StockSavvyShay) is adamant that Snowflake will be rerated in 2025 with a price target of $300 (called out live on Fox Business). Their NRR is at 127%, meaning existing customers will spend 27% more YoY. For Snowflake to grow 27% within the next year, all they need to do is nothing. They can afford to sit.
Data consumption models make money out of thin air. 40% of the Fortune 2000 data is stored in Snowflake’s ecosystem ALREADY. They are trading at 25% of Palantir’s valuation and 20% of Cloudflare’s. This could be a 3-4x trade. There is still no floor on AI and its applications.
On the technical side, over $205 and we have a liquidity zone up to $300. Our entries are at $109 and $125, but this would be a secondary entry for a position trade to capitalize on one of the top names in stage two AI (software/applications).
Entry: Over $205
Targets: $230, $300, $400
NYSE:SNOW

Ichimoku Theories - Complicated? Keep it SimpleNYMEX:CL1!
The Ichimoku Strategy is a technical analysis method using the Ichimoku Kinko Hyo indicator, which helps traders identify trends, support/resistance levels, and potential trade signals. It consists of five key components:
Ichimoku Indicator Components:
1. Tenkan-sen (Conversion Line): (9-period moving average)
• Short-term trend indicator.
• A sharp slope suggests strong momentum.
2. Kijun-sen (Base Line): (26-period moving average)
• Medium-term trend indicator.
• Acts as a support/resistance level.
3. Senkou Span A (Leading Span A): ((Tenkan-sen + Kijun-sen) / 2, plotted 26 periods ahead)
• Forms one edge of the Kumo (Cloud).
• A rising Span A suggests an uptrend.
4. Senkou Span B (Leading Span B): (52-period moving average, plotted 26 periods ahead)
• The second edge of the Kumo (Cloud).
• When Span A is above Span B, the cloud is bullish (green); when Span A is below Span B, it’s bearish (red).
5. Chikou Span (Lagging Span): (Closing price plotted 26 periods behind)
• Confirms trend direction.
• If Chikou Span is above past prices, it signals bullish momentum.
Trading Strategies Using Ichimoku
1. Kumo Breakout Strategy
• Buy when the price breaks above the Kumo (Cloud).
• Sell when the price breaks below the Kumo.
2. Tenkan-Kijun Cross Strategy
• Bullish signal: Tenkan-sen crosses above Kijun-sen.
• Bearish signal: Tenkan-sen crosses below Kijun-sen.
3. Chikou Span Confirmation
• Buy when Chikou Span is above past price action.
• Sell when Chikou Span is below past price action.
4. Kumo Twist
• When Senkou Span A crosses above Senkou Span B, it signals a potential bullish reversal.
• When Senkou Span A crosses below Senkou Span B, it suggests a bearish reversal.
5. Trend Confirmation
• Price above the cloud = bullish trend.
• Price inside the cloud = consolidation.
• Price below the cloud = bearish trend.
Advantages of Ichimoku Strategy
✅ Provides a comprehensive market view (trend, momentum, support/resistance).
✅ Works well in trending markets.
✅ Offers clear entry and exit signals.
Limitations
❌ Less effective in ranging or choppy markets.
❌ Can be complex for beginners.
❌ Requires confirmation with other indicators (e.g., RSI, MACD).
Trade Smart - Trade Safe 🚀

A lot of room to grow for $EDGE in DePINEDGE has been in a major uptrend since december fueled by new attention to its supercloud products that have been in development for over a decade and its recent partnership with Tinder, gaining them as a client to run the YearInSwipe competition on the edge network. This year there is a large number of releases to be expected, from its all new storage product, VPN, to AI Agents. Revenue has been on the rise to the tune of 1.3 million USD ARR from users of the supercloud, which is similar to some 10x valued project like Akash. Combined with the fact that it is not on any reputeable CEX yet, exchange listings can be seen as catalysts for further growth. In summary, a lot is aligning in the macro-picture for EDGE this year giving it the very good chance to catch up and overtake other DePIN projects price-wise. This is a project solving real-world issues with growing real-world revenue and deflationary tokenomics, making it an ideal long-term hold

CLOUD/USDT NEW INCREASECLOUD/USDT NEW INCREASE
There is a good chance that this coin can increase in the coming time frames with new volume.

First 2025 prediction Cloud/usdt $0.65prediction Cloud/usdt $0.65 with time
this coin has a good chance to gain $0,65, after studying the data of this coin.
The best way is to follow this coin's low day frame with the day trend.
This update is not a trading update, but a prediction update.
Know that there is no guarantee that this price will become a reality, our study is based on the data study which can be confirmed.
There is also a day trading follow updates by this update
Let the time show us if this coin is going to get the expected break.
Markets going on their way, and it can take time before this coin can show a result. also, this update depends not on the small time frame changes. it's a large picture for the coming times.

F5, Inc. (FFIV) AnalysisCompany Overview:
F5, Inc. NASDAQ:FFIV is a market leader in application delivery and cybersecurity, providing solutions that ensure seamless and secure digital experiences for enterprises globally. The company's evolution from a hardware-centric model to one focused on software and security solutions reflects its agility in adapting to market dynamics and customer needs.
Key Growth Drivers
AI Infrastructure Integration:
F5’s partnership with MinIO, a leading high-performance object storage platform, enhances its presence in the AI infrastructure space.
This collaboration integrates MinIO’s storage capabilities with F5’s advanced traffic management and security solutions, creating a compelling value proposition for enterprises embracing AI and data-intensive workloads.
Shift to Software and Security:
F5’s strategic pivot from hardware to software-driven and security-focused solutions broadens its market reach.
This shift positions F5 to capitalize on increasing enterprise demand for application security, cloud migration, and edge computing.
Strong Financial Foundation:
Recurring Revenue Dominance: 76% of total revenue ($2.1 billion) is now recurring, providing financial stability and predictable cash flows.
Stock Buyback Program: The $1 billion repurchase initiative demonstrates management’s confidence in the company’s growth trajectory and commitment to enhancing shareholder value.
Customer-Centric Innovation:
F5’s solutions are vital for enterprises navigating the complexities of modern multi-cloud environments and ensuring robust cybersecurity for applications.
Investment Outlook
Bullish Case:
We are bullish on F5, Inc. (FFIV) above the $220.00-$222.00 range, given its robust recurring revenue base, strategic partnerships, and expanding market opportunities in cybersecurity and AI infrastructure.
Upside Potential:
Our upside target is $360.00-$365.00, reflecting the company’s ability to sustain long-term growth through innovation, market leadership, and strong financial management.
🚀 FFIV—Redefining Digital Security and Application Delivery in the Age of AI. #Cybersecurity #Cloud #AIInfrastructure

Cloudflare (NET) AnalysisCompany Overview:
Cloudflare NYSE:NET , a global leader in cybersecurity, content delivery networks (CDN), and edge computing, is well-positioned to capitalize on increasing digital transformation and growing demand for secure, efficient cloud infrastructure.
Key Growth Catalysts:
Strategic AI Partnerships 🤝
Cloudflare’s collaboration with Microsoft Azure enhances its AI infrastructure, fostering innovation and bolstering its competitive edge in enterprise cloud solutions.
Zero Trust Leadership in Cybersecurity 🔐
Cloudflare’s Zero Trust platform addresses growing enterprise needs amid rising cyber threats and increased remote work adoption.
Advanced threat intelligence and access controls make it a leader in next-gen cybersecurity solutions.
Edge Computing & IoT Opportunities 🌐
Edge computing solutions are experiencing strong adoption, fueled by:
Growing demand for 5G networks and the IoT revolution.
The edge computing market is projected to reach $87.3 billion by 2026.
Cloudflare’s focus on reducing latency and enhancing network efficiency positions it to capture market share.
Global Expansion & Untapped Markets 🌍
New data centers in underserved regions expand Cloudflare’s global reach, improving service delivery and unlocking revenue opportunities in untapped markets.
Investment Outlook:
Bullish Stance: We are bullish on NET above $90.00-$91.00, supported by strong positioning in AI, cybersecurity, and edge computing, coupled with robust global expansion strategies.
Upside Target: Our price target is **$145.00-$150.00

Aethir Project Overview: $ATH going All time high?Project description:
Aethir ( TSX:ATH ) is a decentralized infrastructure protocol that focuses on providing real-time data and computational resources for gaming and metaverse applications, aiming to create scalable, low-latency solutions using blockchain technology.
Type of project:
Decentralized infrastructure for gaming and metaverse applications.
Is it under a block?:
Yes, Aethir operates on the Ethereum blockchain and plans to expand to other compatible blockchains, providing its services through a decentralized network powered by TSX:ATH tokens.
Latest update or news:
As of November 7, 2024, Aethir announced its Compute Node Partnership Program, which incentivizes participants to contribute computing resources to support gaming and metaverse applications on the Aethir network.
Narrative:
Gaming infrastructure, metaverse, decentralized computational resources, and blockchain-based real-time data solutions.
Unlocks Data for Aethir ( TSX:ATH ):
1. Upcoming Unlock:
Next Unlock Event: Scheduled for November 10, 2024, with an unlock of 4 million ATH tokens.
Percentage of Circulating Supply: This release constitutes approximately 0.02% of the current circulating supply.
2. Rate of Token Released to Circulation:
Next 7 Days (November 7 – November 14): 4 million ATH tokens, or approximately 0.02% of the circulating supply.
Next 30 Days (November 7 – December 7): Cumulative unlocks totaling 12 million ATH, approximately 0.06% of the circulating supply.
3. Total Unlocked:
Total Unlocked Tokens: 3 billion ATH, which represents approximately 7.14% of the maximum supply of 42 billion ATH tokens.
4. All Upcoming Unlocks in the Future:
November 10, 2024: 4 million ATH
December 10, 2024: 4 million ATH
January 10, 2025: 5 million ATH
5. Vesting Analysis for Aethir ( TSX:ATH ):
Aethir’s token vesting is structured to ensure gradual and stable distribution:
Compute Node Incentives: 50% allocation, distributed over 5 years to support long-term infrastructure growth. Team and Advisors: 15% allocation, vested over 3 years to align with project milestones. Ecosystem Development: 15% allocation, released based on project expansion and strategic partnerships. Investors: 10% allocation, unlocked gradually to mitigate sell pressure. Community and Airdrops: 10% allocation, provided to early adopters and supporters to encourage platform adoption.

(MOG) mog coinmog coin listed to kraken but now does not appear on their website as newly listed. Not sure if there is a bug or glitch or if they decided to not list mog coin. As I can see on trading view the kraken USD mog coin pair does exist despite the listing on their website going blank. Kraken also listed memecoin. In the last few months Kraken has listed some ~50 cryptocurrency to their trading exchange.
notable add-ons include;
TURBO, ECHELON PRIME, PARCL, RENDER, FLOKI, MANTLE, KUJIRA, BITTENSOR, LAYERZERO, BIG TIME, PENDLE, SAFE, MAPLE, HELIUM, BONK, OPTIMISM,.
people in the USA cannot trade :
ACA, AGLD, ALICE, ASTR, ATLAS, AUDIO, AVT, BONK, C98, CFG, CLOUD, CSM, FLOKI, GENS, GLMR, HDX, INTR, JASMY, KIN, KMNO, KUJI, L3, LMWR, MC, MV, NMR, NODL, NYM, ORCA, OTP, OXY, PARA, PEPE, PERP, PICA, PORTAL, PRCL, PSTAKE, PYTH, RAY, REQ, REZ, ROOK, SAMO, SDN, STEP, SUI, TEER, WEN, WIF, WOO, XRT, YGG, ZEX.
I notice quite often the best performing cryptocurrency "on the day," is one that is not tradable in USA. For instance, this week Sanctum (CLOUD) performed the best while most cryptocurrency was losing yet there is no way to gain from this instance because as seen from above CLOUD is not tradable in USA. Neither Bonk nor Dogwifhat are tradable in America on Kraken.com.
to check your location here is the link:
support.kraken.com
