Cloud

AVCTif youre in this play. we pulled back and tested this break out zone at around 0.20c. tomorow willl be big when we get jobs market data. so we pulled back and now testing that zone. also the 200 simple is in the same place we"ll want to see if that turns into support. for bulls you want to see this hold and turn it into solid support then get over 0.24c and rip. for bears you want to stay below 0.24 if you can, thats what id look for then to the next level if breached.
these are very volitle in each direction, so be careful. im keeping an eye on it. i have a few tickers like this im just having fun with, im not sure about any news catalyst or anything yet. ill be doing dd tonight. but id assume anything would likely get it moving in corresponding direction.
Usually this is the lowest volitile week of the year. and it was the MOST volitle.
~This is the year of the active trader. happy trading.~

LIGHT CRUDE OIL FUTURESCurrently, petroleum trades casually, aggressively and also could not break the strong demand zone, which is a strong support.

GOOGNASDAQ:GOOG NASDAQ:GOOG
My analysis is that if there are a core of companies capable of weathering out a recession that Google is among
them with its search engine and cloud services at the core of its services.
On the weekly chart, Google like others had an uptrend after the COVID crash of March 2020 until last winter.
Right now, a downtrend is retracing the uptrend of April 2020 through November 2021.
I see the downward trend now ending as the retracement is about 50% into the mid-Fibonacci levels.
In the context of the MACD indicator showing low momentum and the K / D lines below the
histogram, I see a reversal setup to the long upside.
My analysis supports GOOG in a swing long setup now ready for entry.

what are you going to do with all that money?what are you gonna do with all that a&& all that a&& inside that trunk, I'm gonna get you to drunk. $43. before we head back down buy the dip. NFA

ALTO is rising with earnings expected ASCENDING CHANNELNASDAQ:ALTO
ALTO has earnings post-market 8/8/22. per Yahoo! Finance
last earnings were significantly 10% of share price
Chart (60 minutes) shows a two-week ascending channel as well
as increasing relative volume now sitting at a volume
profile resistance shelf and consistently above
the cloud indicator.
Will ALTO continue on the uptrend or bounce off resistance?

AURORA , Ichimoku cloud, edge-to-edgeBullish T-K ( Tenkan-Kinshin) cross on the daily cloud, price action has entered the cloud - my bet is that it will make a standard ed-to-edge move : sell target ~ $3.10
No stop (this is spot), but if you need one - it's the Kenshin (K) line

channel AMZNlook at break over 117 or breakdown under 106. looking to add on breakdown feel we are in for more summer blues

Burlington Bounced Off SupportBurlington (BURL) found support on the monthly cloud. With just 3 trading days left in the month, there's little chance the candle will pierce the cloud. Monthly Stoch RSI highly suggests this is a major bottom. Monthly Fibonacci also validates the potential bottom.
Not financial advice.

BTC bouncing off 1D Tenkan-senBTC appears to be bouncing nicely off of the 1D Tenkan-sen on the Ichimoku Cloud, which is also pointing upwards, signaling a likely bounce here and a possible continued bull run in the coming days. 20650 will be a strong support for the next day or so.
Entry: 20700

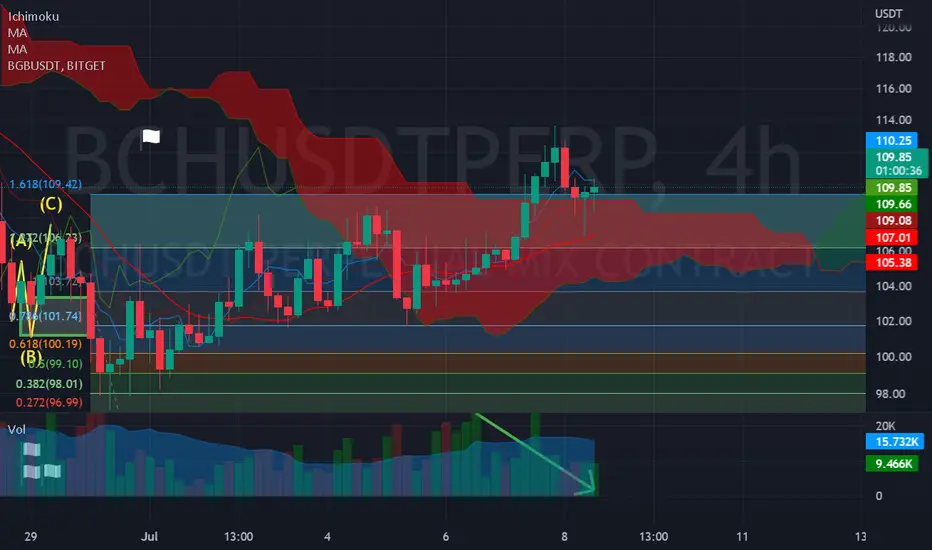
BCHUSD is HOT! I see expansion coming! If you like AI then Look at my custom cloud settings that show we are flying hi above a huge red cloud and not likely to break back down because they are keeping shorts under water. Only one real correction in there and then we have been pushing right through and so the odds are we will ride the cloud and then expand up. I ran Targets on this earlier and we entered Long on this at $104 and also doubled up long at $94 and the targets are $119-124-136-152
CLOU - ETF FOR THE FUTUREAfter the big drop in tech stocks in recent months, this etf, that follows cloud companies, is a very good investment option for those who look to the future...

ADOBE ROPEY - Short Setup ~$480REASONS TO BE LONG-TERM BEARISH
Broke the 100 week moving average 14th Feb
RSI has dropped into the bear zone, confirming sell signal
Dropping outside of the exponential bull top (green area)
Replicating same setup as January 2001
Back then price made way all the way back to the 0.5 fib at $8. The same move this time would take it back to $105.
Price/earnings ratio still at 33!
REASONS TO BE SHORT-TERM BULLISH
Back-test of 100 week moving average could be on the cards in the coming week or two
That said it has already done that in March 2022
$480-490 would represent a nice setup & risk/reward ratio for a short
RSI ticking upwards, potentially to cross into the green bull zone on daily
Downside target or long entry would be $108, right to the top of the bottom purple zone. Back to 2016 highs. Likely some years away, before it gets all the way there though!

FX - CAD/CHF - GANN FANs Chart !! LONGHello trader,
Nice Week and profitable deals 💲
CAD/CHF 8H Chart 🗝
In this chart we can see 2 gann fans and
1Cloud ☁
Fibretracement 🌊
and MA 200 that gives the bull power, MA50 and 🔑AVWAP
Momentum what the direction shows us up 📈👀
and rsi, with divergences up 💹
Brief explanation of the Gann fann 👀
The lines act as support and resistance, everything under the red area is considered bears‼
SL, TP is visible in the chart 🗝🗓
I would like to mention that all i post are just options and my own opinion!
Always Trade With Sl, And Not Risk More than 1% of your portfolio (max 3%) by trade.
If you have any questions, let me know
➡️If you like my posts smash the Like Fur, Comment or Follow me.⬅️
Thanks for reading my ideas,
Trade save !!

Amazon CloudAmazon (AMZN) just reached the cloud. The last time this happened was in November 2008. Could be a rare buying opportunity. Does anyone see things differently?
Not financial advice.

$SC SiaCoin a strong case for the bullsSiaCoin the dentralized storage platform has had a 500% increase in storage used on its network since 2021 constantly growing and repeatedly setting ATH's in usage, the network had 0.5 PetaBytes stored by its users and at writing today has 2.5 Petabytes stored on the network. Behind the scenes of the token itself, the project is consistently growing in its utility and users, the sia network and the coin are paired like an elastic band and its only a matter of time as the sia network pulls further and further ahead that the coin will shoot back to the project and catch up to the gains the network is making.
The calm before the storm.....
In this analysis i've touched on some rough wave theory on the weekly marked by points 1 through 5 and points w,x & y. Ive then also brought in the fibs as it seems to have been respected at the .236 and .5 indicating the possibility of the more significant fibs being tested.
View siastats.info to view the growth of the network.

Bitcoin (BTCUSD) Bull and bear caseBTCUSD formed a triple bottom around $37000 and showed a minor pullback. Markets are highly volatile ahead of Fed monetary policy next week.
Bear case-
Levels to watch- $37000.
Bull case-
Primary supply zone -$40000.
Buy $37000
SL $34000
TP of $50000.

AVCT American Virtual Cloud Technologies upside potentialAmerican Virtual Cloud Technologies, Inc. (AVCT) is one of the most undervalued virtual cloud companies in my opinion.
Loop Capital has a $17 price target for it.
Virtual Cloud services are the essence of the Metaverse, they will see increasing demand.
I see a 3X upside potential on AVCT from here.

AVCT 1450% Upside Analyst RatingI know, it seems ridiculous, but last year Loop Capital Initiated Coverage on American Virtual Cloud Technologies, Inc. (AVCT) with a Buy rating and a $17.00 price target.
Now i am not sure if American Virtual Cloud Technologies, Inc. (AVCT) is such an amazing company to do 14.5X, even though the cloud services will be the essence of the Metaverse, but i think at least a 2X short term is extremely plausible.
Looking forward to read your opinion about it!

NQ Power Range Report with FIB Ext - 3/22/2022 SessionCME_MINI:NQM2022
- PR High: 14391.25
- PR Low: 14363.75
Evening Stats (As of 12:10 AM)
- Gap: = N/A
- Session Open ATR: 445.27
- Volume: 22k
- Open Int: 205k
- Trend Grade: Neutral
- From ATH: -14.50% (Rounded)
Key Levels (Rounded - Think of these as ranges)
- Long: 14675
- Mid: 13500
- Short: 12390
Keep in mind this is not speculation or a prediction. Only a report of the Power Range with Fib extensions for target hunting. Do your DD! You determine your risk tolerance. You are fully capable of making your own decisions.


Trending with double cloudsThis method of analysis came as an idea after digging into cloud strategies and indicators.
The authors I studied were Nick Engles ECC11strategy, Takahashi Akita Fast cloud strategy and Sanya Vellin double small (fast) and large (slow) cloud strategy.
Engles evaluates from 4 hour and 1 hour time frame looking for trend and momentum and then to 15 minute looking for a change in momentum indicated by a Tenkan and Kijunsen cross over in the 15 minute, utilising structure and institutionals as guides to price potential.
Takahashi uses a faster cloud with less separation and watches for the price and the Tenkan and kijunsen to cross the cloud and be stacked in the correct order to indicate a buy or sell position.
Sanya uses the double cloud without Tenkan, Kijun or Chikousen and waits for price and fast cloud to cross the big cloud in the correct stack to indicate a potential.
The two latter take note of trend in the higher time scales but strong local trends are indicated by clouds in the up or down trend and stacked T over K and both over cloud the opposite for down trend, or in Sanya’s case, fast cloud over slow or fast under slow.
My idea was to utilise all three to indicate continuation or potential strong retracement
Slow cloud and fast cloud but only using Tenkan, Kijun and Chikousen lines on the slow cloud
So like Nick’s strategy we go up 2 time scales from our trading scale to start an overall view of the market trend and momentum. NB When using an iPad in TradingView there a useful tool ‘!’ To click on which shows the price progression and trend in a simple graph for the day or whatever time period you choose to work in.
So as we focus in on the 15 minute scale we may see a strong continuation indicated by fast cloud over slow, T over K and above fast cloud and price over those and Chikousen above all but lagging of course
Or we may see a strong change in direction, indicated by fast cloud crossing slow cloud. If it’s an up trend then blue Tenkan is over Red Kijun and also heading in the direction of fast cloud and above it. Price is above T & K and green Chikousen is above all but lagging. A down trend cross over see the opposite fast diving down thru slow cloud, blue below red and green plunging down and lagging.
Another handy guide is the tool that indicates the platform assessment of current trend for the currency pair of interest in terms of buy or sell, weak or strong.
So if your assessment agrees - well and good.
Attention to trend in terms of Elliot waves - higher highs and lower lows or the reverse indicated what significance one might put even where a direction change is a strong indication. A retracement may be only short lived for instance and it may be wise to wait for the change to the continuation of the long trend and see a strong indication of continuation for instance.
The strong indicates are slow to appear and not too frequent, so when you can’t find a trade indicator then one can switch to the slower cloud and use Engels strategy to find a an opening scalping trade for instance
Or one could chose to use only the fast cloud and switch on its T and K lines and find something in the mid range on an hour timescale and capture 20 or 30 pips perhaps.
Risk management and psychological discipline must remain at the forefront as usual
As a side note I just watched Baurjan Tulegenov (Ch10 and go live educator) present a seminar on the Ignite harmonics scanner 2 - it functions in a similar way to the double cloud. Strong trends are indicated by a layered cloud protocol with price and other indicator lines above and below indicating a buy/sell opportunity. The system integrates volume and has a general overarching principle of ‘swim with the whales’ ie move with the banks and institutions and not against.
We are employing probability to guide our decisions to buy and sell and the market more probably flows with the big fish. Go with and enhance the probability and manage the risk to gain and maximise profit and hold your nerve at all times.
Good talk and intro to a useful strategy,(he’s Russian but with excellent English and not overhyped and frantic like many others) I will keep his stuff in mind when using the double cloud and may integrate volume into the system.
Prosperous pip catching
Dave

BTCUSD Analysis By AVNGL (SECOND TRY)This second analysis test on BTC/USD It is trying to expose in a simplified way thetrend changes in daily candles for the basic understanding of this very funny and volatile wave market.
Remember that the markets have to be studied for their cyclical and undulating nature, in the price/emotion relationship.
---
(ANNOUNCMENT) & (REMINDER):
Last Sunday I could not publish the largest analysis that I have saved and the first to expose with greater seriousness, however next Sunday I will be ready with better and more details for any type of market studen
---
II hope to be of help.
A huge greeting, and have a good week.
