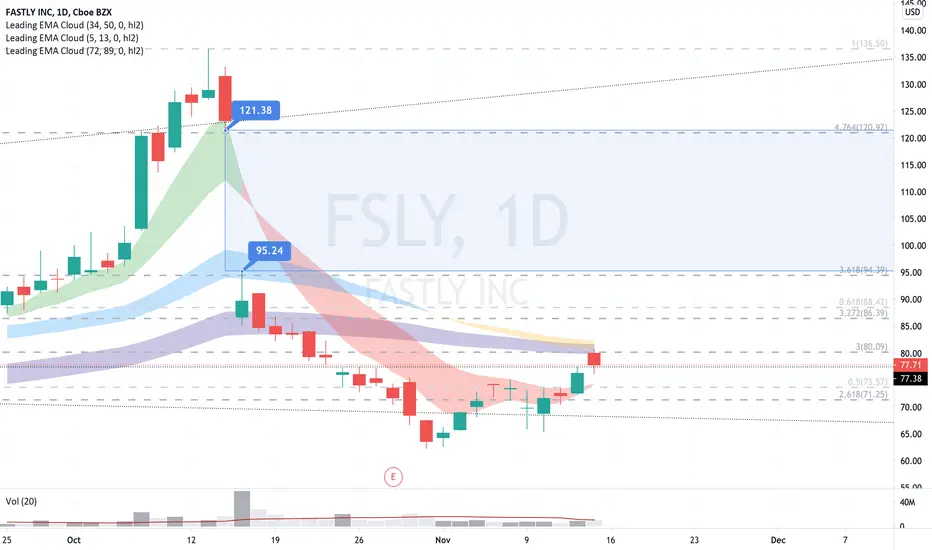
Cloud

Based, ready to launchRight below the fib, will be watching closely for a run up and through the gap.
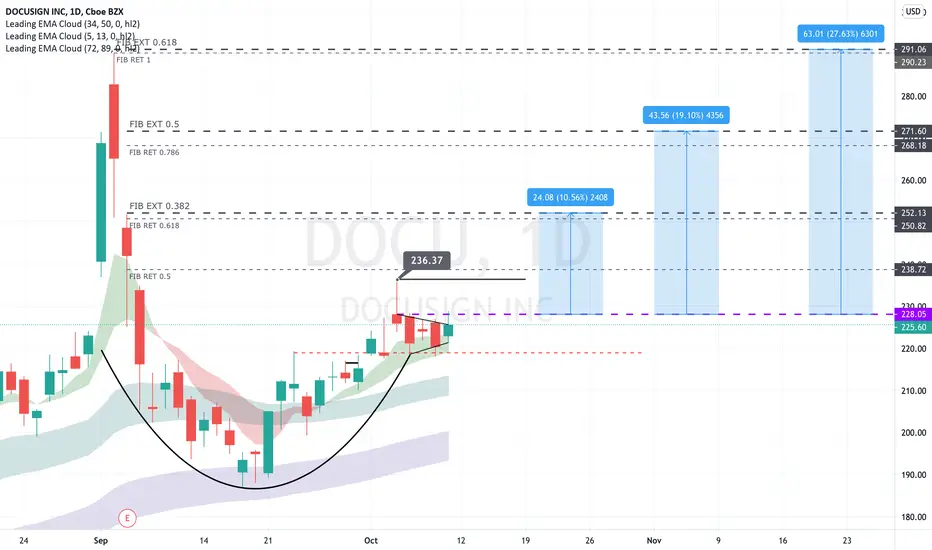
Fib channel gives path to 255Taking a different approach with this one and seeing how accurate the fib channel will prove to be. Whether a fib channel or not, price has been traveling in this channel with some exceptions bottoming out or breaking out. Overlaying volume profile indicates its about to find a base over 228-230 and may make its next move from there.

Will Tesla Break Below Support?According to the Kurutoga Cloud, we can see TSLA just tapped into its support zone. Will it bounce back up or break through support?
Comment your thoughts!
Monday is key, if it falls below it will be a start of a bear trend and fall into the high 300s. While if it continues its bull trend Monday is a great opportunity to buy.

SAP ready for a slow n steady climb back up ? SAP was until recently the largest tech company in Europe, Now replaced by PROSUS but after a disappointing Q3 earnings it fell 20%+.
Total revenue fell 4% to €6.54 billion, cloud and software revenue fell 2% and operating profit fell 12%. However, Pure-cloud services grew 11%, to €1.98 billion.
SAP’s revenue was around €300 million under expectations, though per-share profit beat expectations.
“Over the next two years, we expect to see muted growth of revenue accompanied by a flat to slightly lower operating profit. After 2022 momentum will pick up considerably though. Initial headwinds of the accelerated cloud transition will start to turn into tailwinds for revenue and profit. That translates to accelerated revenue growth and double digit operating profit growth from 2023 onwards,” SAP CFO Luka Mucic said in a call with analysts.
Looking to scale in when price is in BUY ZONE (purple box), with Entry target of $100. Stop Loss $90. Exit target MINIMUM 2:1 RR , look at levels to find an exit.
This will probably be a longer term play due to the revised forecast targets being pushed back from 2023 to 2025
THIS IS NOT FINANCIAL ADVICE, JUST A RANDOM IDEA

Cup and handle, primed for a big moveA strong name recently that has consolidated over the past week and a half with some sharp moves up that were not held. A break should yield a large move. Major and minor fibs marked above.
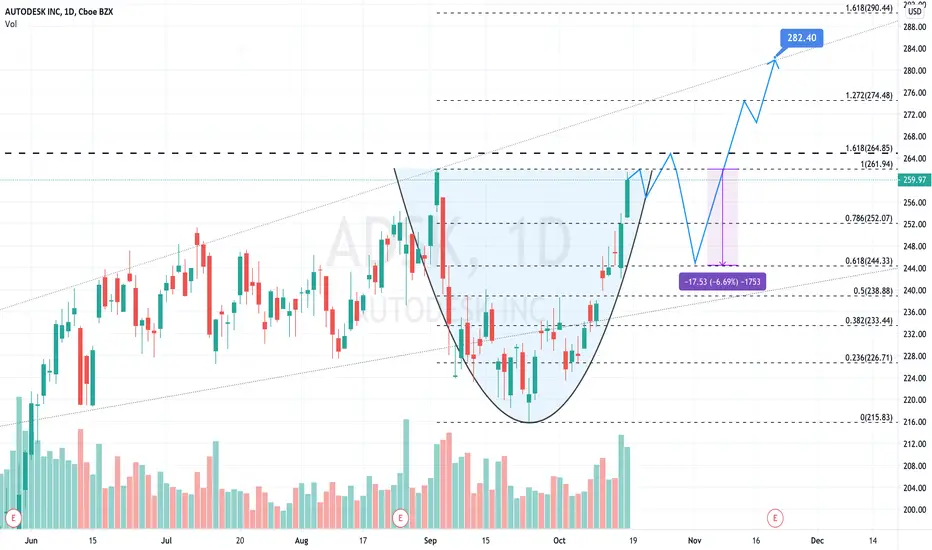
Cup formed, handle next, run into earningsUpdating my ADSK idea from a few days back which has played out nicely. This has formed a nice cup and considering 1. the bullish week it had and 2. the fib retracement (1) and extension (1.618) immediately above, it should bounce off resistance to begin forming the handle. I am reticent to predict an exact path but I think there is a good likelihood that consolidates below, potentially creating a proportional handle at 30% of the cup, before moving upward to new ATH in a pre-earnings run up.
In the past version I had incorrectly listed the 1.618 extension by a point and have updated it to 265.85. I have also updated the upper trend line and fib extensions above.
Break out of IPO baseThe enterprise IT and software leader formed a solid base and had a nice breakout. Good to 90's and above as it holds. Still a downtrend line from previous highs it needs to break as well.

Support of a volume shelf with a clear path upwardAfter consolidating, ADSK has the potential for a technical-based move upward to the top of this trend line.

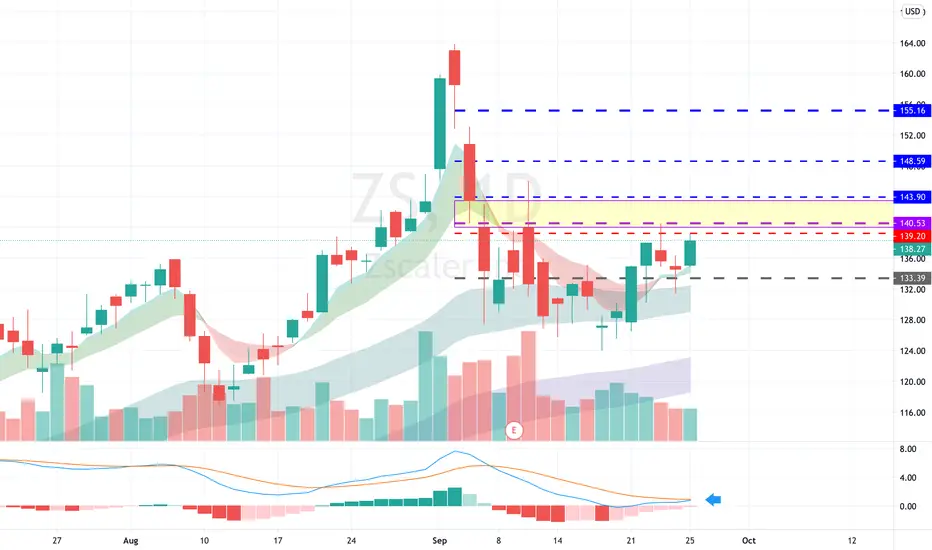
ZScaler inside uptrend channel (Watching!)ZS has been behaving well inside the uptrend channel drawn. When we touch the upper part of the channel, we see a pullback to the lower segment line.
RSI analysis suggests, we have difficulty going above the 70 level, however, the chart remains bullish whenever the RSI has been over the 43 RSI. A break below 40 in the RSI would be short-term bearish. -----> conditional Bull
OBV has been trending upwards since the earnings gap-up we had May 29th. -----> Bull
50sma is lining up with the lower channel line, which could work as a support, and a buy entry with low risk.

Bullish ascending triangleReliable pattern, slow sto oversold, name is showing strength and looks to break to the upside. Aggressive entry over 148.47, safe entry over 153.10, even safer entry over 153.90.

NICE with nice pattern and chance to move up if 240$ break volume, ma, ema, pattern is all bullish.
nice part of cloud stocks - sector that very strong in these days

Recent bottom may be inThis cloud name may rebound after a fall from recent highs. From a fundamental perspective, their shift to subscription-based revenue bodes well for their long term growth.

Solid r/r for this cloud security nameClear path up to the VPOC which aligns with a fib, stop loss at the fib below
$ZM High tight flagHigh tight flag
- Holding level
- Volume reducing = Supply dry up
- Time consolidation(Short term EMA's coming up)
Buy : 480
SL: 455
RISKY


Great upside with more momentumZS is a cloud-based information security riding COVID/work from home tailwinds helping businesses secure remote workstations. Purple line is a major fib, needs some more momentum to get up and over that, can make a nice long entry with targets above.
May reverse after disappointing post-IPO decreaseAfter hitting a high of 64.40 shortly after IPO in July 2020, price action has been descending over time recently hitting all time lows with the recent market pullback. Some initial indicators that the bottom may be in with a recent curl upwards and a close over the 5 day EMA. Its oversold and may bounce from here, especially on a rotation back into cloud/SaaS stocks. Of particular interest is the marked gap above.
Towards the fundamentals, JPM Analyst Mark Murphy said that the 34% pullback in the shares since August 6 "creates asymmetric upside potential" according to this coverage: seekingalpha.com

Potential gap fill aboveCould reverse on strength in cloud stocks. As it has been noted, ARK has been buying the dip as well.

BTC State of Everything - HTF Technicals and EconometricsBTC's recent run and sudden drop has most traders uncertain of what might come. In this analysis I'll be evaluating 12 different indicators to see if we can get a feel for BTC's direction over the coming days/weeks.
Note - I'll provide links at the bottom of this analysis to articles that describe some of the more exotic indicators.
PAGE 1 - Headline Photo (Shown Above):
Top left - Golden Ratio Multiplier (info in "resources" section below): The golden ratio multiplier has been one of the strongest indicators for spotting opportune buying/selling opportunities as well as key dynamic support and resistances. During the great 'rona selloff of 2020, we spiked down to the 2x 350SMA multiplier, the exact support that reversed the 2018/2019 selloff and launched us into the bullish paradigm that began early 2019 (and later ruined by the pandemic). We're currently resting on the 350 SMA, the SMA that is at the core of this indicator's functionality. Read alone, this would be a viable but very risky knife-catching move for any longs. I'm not particularly interested in a long here (more on that later).
Top right - Guppy: I use the guppy as an additional feel for bias. Green - I am bullish, gray - neutral, red - bearish. We recently had a flip to gray from green, which taken by itself implies neutrality at this time. Note: if interested in exploring this script further, check my scripts.
Bottom left - Log channel: BTC has spent almost its entire life between the white log channels. Taking this indicator alone, dipping below that white support and having it as resistance is either bearish, or represents a paradigm shift requiring a more nuanced channel. I don't take bets on paradigm shifts this young, so currently reading this as bearish.
Bottom right - Ichimoku Cloud (1d) + significant EMAs + RSI: Earlier this week and late last week we had 7 daily candles where attempts to break outside of the cloud were met with failure. Yesterday's daily candle also solidified a strong bearish cross. Digesting all of it, we have a bearish cross (bearish) and price action within the cloud (neutral/sideways). On top of that, we're struggling to keep above the daily 99 EMA, which is not a great sign for bulls. Summing this up, the daily cloud is fairly bearish. More relevant on higher timeframes is the weekly cloud , whose Tenkan caught this dip and we are resting there now. Regarding RSI, we had a strong divergence that played out with a mild relief rally this past week. I consider that divergence played out and equalized, meaning RSI is neutral at this time.
____________________________________________________________________________
PAGE 2:
____________________________________________________________________________
Top left - S&P500 Correlation: Unfortunately, this indicator says more than most at this time. Ever since the pandemic kicked off economic uncertainty, BTC's correlation with the S&P500 has felt unshakeable. As long as SPX looks bearish, which it does, there's no reason to expect BTC to diverge. Bearish.
Top right - Futures premiums: The last few bull runs have been futures-driven rallies where both the quarterly (blue) and weekly (yellow) contracts have been trading at a premium over spot. With the latest run, we've seen some consistent chop where weekly futures have been yo-yoing above and below spot prices, whereas quarterlies are trading consistently above. We're seeing the same here in more recent days. Good news for long term is that quarterly futures are above, however weekly contracts remain below. To me this represents firm indecision, which seems appropriate. technically speaking this reads as bullish for long term (think weeks to months), and bearish for near term (days to weeks). Net, slightly bearish.
Bottom left - Puell Mulitple (info in "resources" section): In short, this metric looks at the supply side of Bitcoin's economy - Bitcoin miners and their revenue. Specifically, BTC issuance to miners. When issuance is low, investors during that period historically have outsized returns. At this time issuance is in a slightly low phase, but not outstandingly abnormal. There is a lot of room to run upwards, but still some room downwards as well. Taken for itself, the Puell multiple of 0.6 indicates that hodlers (multi-year), should be quite fine to accumulate here while staying weary that better buying opportunities may present itself. For scale, 0.5 Puell and below is a near instant-buy for me. Net, neutral mid-term.
Bottom right - Simple Haikin Ashi: Not much to say with the Heikins. We had a very strong break of the doji printed 2 days ago. If today's candle closes with a similar or longer body, it will set the tone for further bearish continuation for proceeding days.
____________________________________________________________________________
PAGE 3:
____________________________________________________________________________
Note: With exception to Stock to Flow, this page mostly consists of long term indicators used to spot extremes where buying/selling is most profitable.
Top left - 2y MA Multiplier: We are about 20% of the distance above the 2y MA support. The current price did just proceed a dip below, which historically has sprung a long term (multi-year) bull run. Long term, bullish. Near term, neutral/irrelevant.
Top right - Stock to Flow: This crowd favorite needs no introduction, but info is in the "resources" section if needed. We're currently in the early stage of the orange phase of stock to flow, which has historically been a bullish period with lots of chop along a slow grind up. Yep, that feels about right doesn't it? The read here is that anything can happen on daily or even weekly timeframes. However in years to come we'll have a laugh on our yachts about the olden days quibbling $9k vs $11k like it actually mattered. Long term, bullish. Near/mid term neutral.
Bottom left - Pi Cycle (info in "resources" section): Fantastic for sniping tops, we can also glean some info about buy timing. Historically speaking, the Pi Cycle is bullish above the 111 DMA (pink), euphoric above the 2x350 DMA (green), and primed to sell when the 111 DMA crosses above the 2x350 DMA. Additionally, when bullish, buying dips to the 111 DMA support has proved profitable. We are there now - tentatively bullish.
Bottom right - BTC Network Momentum (info in "resources" section): Our momentum is quite low. In fact, it hasn't been this low since 2015. That said, BTCNM does have clear supports, and we are teetering on one of the supports now. Neutral for now, but a break of that support would be a clear bearish sign.
____________________________________________________________________________
SUMMARY:
____________________________________________________________________________
Golden ratio multiplier: neutral (with a potential very risky entry for bulls).
Guppy: neutral.
Log channel: somewhat bearish.
Daily cloud: somewhat bearish.
Weekly cloud: bullish, testing Tenkan support.
S&P500 Correlation: bearish.
Futures premiums: long term bullish, mid term bearish.
Puell multiple: long term bullish, mid term neutral.
Heikin Ashi: somewhat bearish (a long bodied close would confirm and make bearish).
2y MA Multiplier: long term bullish, short/mid term neutral.
Stock to flow: long term bullish, short/mid term neutral.
Pi Cycle: bullish, testing support.
BTC network momentum: neutral, testing support.
____________________________________________________________________________
CONCLUSION:
____________________________________________________________________________
In the near to midterm future, I am neutral to slightly bearish. Long term, bullish. Reading all the indicators together, they are generally printing a hodgepodge of results from slightly bearish to slightly bullish signs with very few extremes. In a truly bearish or bullish market we'd be seeing far more alignment of either bias across the board. However, and above all, our correlation to the S&P500 is a very strong indication of BTC's tie to the global economy and sets a dark bearish cloud over all investments, with particularly high impact on risky assets like crypto.
There are some key supports at play this week that could easily decide my bias with more conviction, and I'll be watching them closely: the weekly Tenkan support, futures premiums, BTC network momentum support, and Pi Cycle support. We're at all of these supports now. A strong bounce, I'd flip bullish. A breakdown, and we're purely bearish. I tend to favor the latter.
I hope you guys enjoyed this meta analysis of BTC! I have years of experience trading crypto, but this is my first publication on TradingView. If you appreciated this post and would like to see more, a like or a follow would be greatly appreciated. Thanks, and happy trading!
____________________________________________________________________________
RESOURCES:
____________________________________________________________________________
Super Guppy TradingView Strategy: unable to link, but check my scripts for source. Includes backtesting, multiples settings, and different risk profiles.
Golden Ratio Multiplier: medium.com
Puell Multiple: medium.com
Stock to Flow: medium.com
Pi Cycle: There's a good section on this near the bottom of the Golden Ratio Multiplier article.
BTC Network Momentum: blog.goodaudience.com

$ZUO in a downtrend$ZUO came back down to the downtrend channel after an uptrend breakout for 5 days with 48% gain.
.

Oversold, potential reversalA second positive day and basing over the next fib would confirm good entry. This may depend on cloud/software stocks rallying.
