Autodesk Squeezes After Strong ReportAutodesk has been squeezing near a two-year high, and some traders may expect a breakout soon.
The first pattern on today’s chart is the attempted rally on March 1 after earnings, revenue and guidance beat estimates. A falling trendline appeared as the software company pulled back, but it’s now pus
Next report date
Report period
Q1 2024
EPS estimate
1.75USD
Revenue estimate
1.39 BUSD
4.23USD
906.00 MUSD
5.50 BUSD
213.31 M
About Autodesk, Inc.
Sector
Industry
CEO
Andrew Anagnost
Website
Headquarters
San Francisco
Founded
1982
FIGI
BBG000BM7HL0
Autodesk, Inc. engages in the design of software and services. Its products include AutoCAD, BIM 360, Civil 3D, Fusion 360, InfraWorks, Inventor, Maya, PlanGrid, Revit, Shotgun, and 3ds Max. The firm also offers product development and manufacturing software, which provides manufacturers in the automotive, transportation, industrial machinery, consumer products, and building product industries with comprehensive digital design, engineering, and production solutions. Its architecture, engineering, and construction software improves the way buildings, factories, and infrastructure are designed, built, and used. The firm is also involved in digital media and entertainment, which consists of tools for digital sculpting, modeling, animation, effects, rendering, and compositing for design visualization, visual effects, and games production. The company was founded by John Walker in April 1982 and is headquartered in San Francisco, CA.

ADSK 2023-03-18 looks bullishsNASDAQ:ADSK
- Consolidate around EMA12 & SMA25 for a while
- Relative strength looks good in comparison to other stocks in S&P, didn't go down a lot with the market.
- Looks like it is waiting for a breakout
- low risk entry to be entered here.

Long-term position in Autodesk, Inc $ADSKI have entered a long-term position in Autodesk, Inc NASDAQ:ADSK
Timeframe: M
SL: ~$199
Target: ~$380

Triangle busted, look for around $256Symmetrical Triangle busted. I'm looking for around 10% upside from the top of the triangle. Which is around $256.
Also, from past trend it seems we have resistance at around that level.

ADSK 2-Year Resistance Flipped to SupportADSK has recently broken out above it's moving averages, and flipped a long term resistance level at $235 into support, and is now expanding after two years of accumulation.

ADSK - 16 months RECTANGLE══════════════════════════════
Since 2014, my markets approach is to spot
trading opportunities based solely on the
development of
CLASSICAL CHART PATTERNS
🤝Let’s learn and grow together 🤝
══════════════════════════════
Hello Traders ✌
After a careful consideration I came to the conclusion that:
-

ADSK Autodesk Options Ahead of EarningsIf you haven`t bought ADSK ahead of the previous earnings:
Then analyzing the options chain and the chart patterns of ADSK Autodesk prior to the earnings report this week,
I would consider purchasing the 210usd strike price Puts with
an expiration date of 2023-11-24,
for a premium of approximately

Long ADSKA harmonic ABCD pattern has formed on ADSK stock, with a target of the 212$ resistance zone.
A divergence between price and MACD Histogram has occurred.

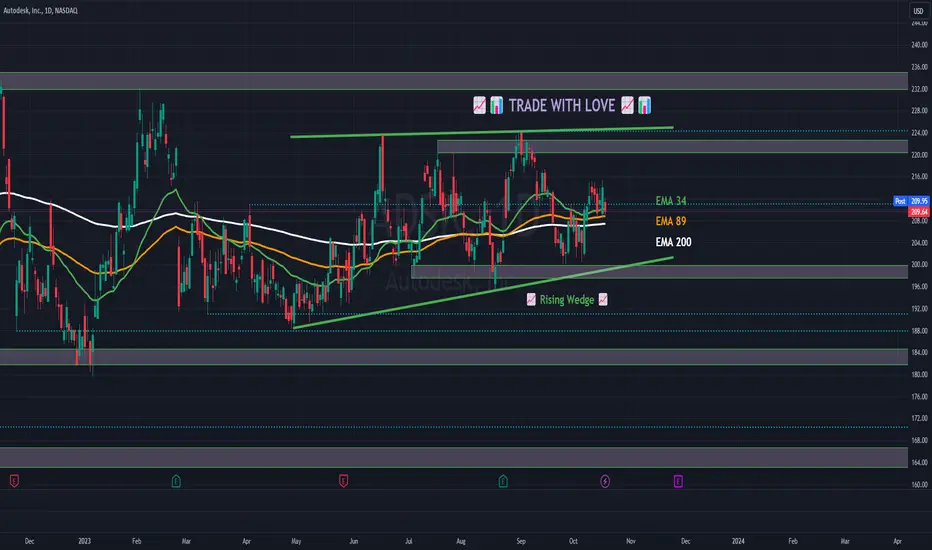
📈📊 #ChartPattern Alert! 📈📊 📈 Rising Wedge 📈📈 What is a Rising Wedge? The Rising Wedge is a bearish chart pattern characterized by two converging trendlines, with the lower trendline sloping upward more than the upper trendline. It typically signals a potential bearish reversal, with the price likely to break downward after the wedge pattern.
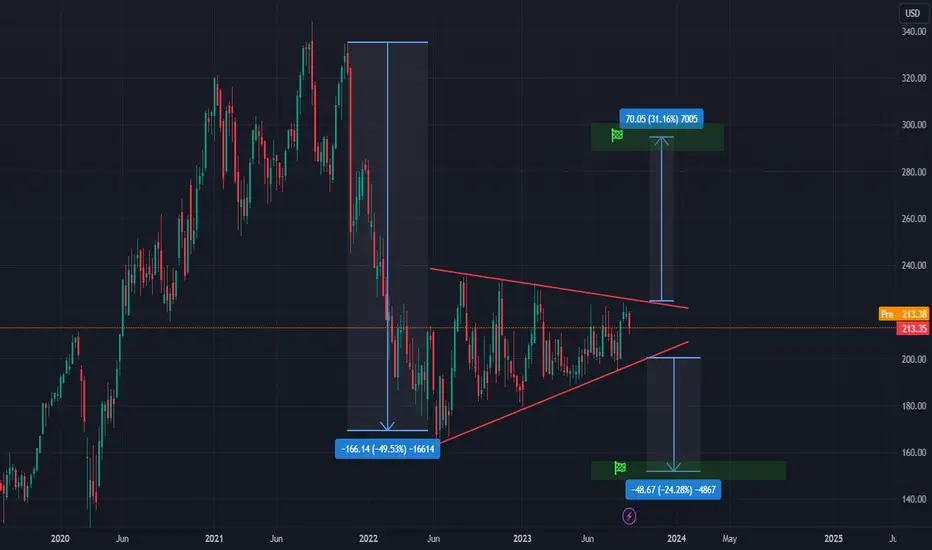
Autodesk in Year long pattern hi traders
Autodesk (ADSK) is trading in already a one year long pattern.
We are still waiting for a breakout which may indicate strong move in the breakout direction.
Enter the position once the breakout occurs.
Targets both for longs and shorts are shown on the chart
good luck
See all ideas
Trade directly on the supercharts through our supported, fully-verified and user-reviewed brokers.


Curated watchlists where ADSK is featured.


Frequently Asked Questions
The current price of ADSK is 217.93 USD — it has increased by 0.71% in the past 24 hours.
Depending on the exchange, the stock ticker may vary. For instance, on NASDAQ exchange Autodesk, Inc. stocks are traded under the ticker ADSK.
Autodesk, Inc. is going to release the next earnings report on May 23, 2024. Keep track of upcoming events with our Earnings Calendar.
ADSK stock is 1.79% volatile and has beta coefficient of 1.66. Check out the list of the most volatile stocks — is Autodesk, Inc. there?
ADSK earnings for the last quarter are 2.07 USD per share, whereas the estimation was 1.99 USD resulting in a 3.86% surprise. The estimated earnings for the next quarter are 1.95 USD per share. See more details about Autodesk, Inc. earnings.
Autodesk, Inc. revenue for the last quarter amounts to 1.41 B USD despite the estimated figure of 1.39 B USD. In the next quarter revenue is expected to reach 1.43 B USD.
Yes, you can track Autodesk, Inc. financials in yearly and quarterly reports right on TradingView.
ADSK stock has risen by 3.02% compared to the previous week, the month change is a 16.37% fall, over the last year Autodesk, Inc. has showed a 13.30% increase.
ADSK net income for the last quarter is 282.00 M USD, while the quarter before that showed 241.00 M USD of net income which accounts for 17.01% change. Track more Autodesk, Inc. financial stats to get the full picture.
Today Autodesk, Inc. has the market capitalization of 46.62 B, it has decreased by 4.87% over the last week.
No, ADSK doesn't pay any dividends to its shareholders. But don't worry, we've prepared a list of high-dividend stocks for you.
Like other stocks, ADSK shares are traded on stock exchanges, e.g. Nasdaq, Nyse, Euronext, and the easiest way to buy them is through an online stock broker. To do this, you need to open an account and follow a broker's procedures, then start trading. You can trade Autodesk, Inc. stock right from TradingView charts — choose your broker and connect to your account.
Investing in stocks requires a comprehensive research: you should carefully study all the available data, e.g. company's financials, related news, and its technical analysis. So Autodesk, Inc. technincal analysis shows the sell today, and its 1 week rating is sell. Since market conditions are prone to changes, it's worth looking a bit further into the future — according to the 1 month rating Autodesk, Inc. stock shows the neutral signal. See more of Autodesk, Inc. technicals for a more comprehensive analysis.
If you're still not sure, try looking for inspiration in our curated watchlists.
If you're still not sure, try looking for inspiration in our curated watchlists.
We've gathered analysts' opinions on Autodesk, Inc. future price: according to them, ADSK price has a max estimate of 320.00 USD and a min estimate of 230.00 USD. Read a more detailed Autodesk, Inc. forecast: see what analysts think of Autodesk, Inc. and suggest that you do with its stocks.
EBITDA measures a company's operating performance, its growth signifies an improvement in the efficiency of a company. Autodesk, Inc. EBITDA is 1.23 B USD, and current EBITDA margin is 23.05%. See more stats in Autodesk, Inc. financial statements.