Check for support near 29.20
Hello, fellow traders!
Follow us to get the latest information quickly.
Have a great day!
-------------------------------------
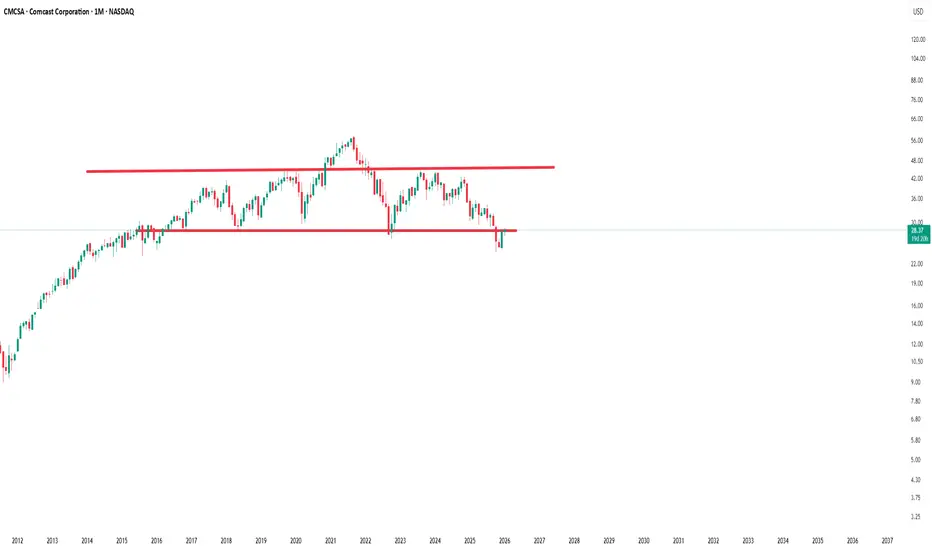
(CMCSA 12M chart)
CMCSA is located near key support and resistance levels.
If it falls below 27.78, it could fall to around 12.90. Therefore, to sustain the uptrend, it must find support near 27.78.
-
(1D chart)
Since the price is below the M-Signal indicator on the 1M chart, the top priority is to see if it can rise above the M-Signal indicator and maintain its upward momentum.
To achieve this, it must find support at three support and resistance levels and then rise.
The three support and resistance levels are:
29.20,
27.78 ~ 28.03, and
26.65.
Since a volume profile zone has formed at 26.65, the area around 26.65 is the most important support and resistance point among the three support and resistance levels.
However, if the price declines from 29.20 or 27.78 to 28.03, there's a high possibility of strong selling pressure, so caution is advised when trading.
A full-blown uptrend is likely to begin with an upward breakout above 35.09.
To ensure this, check for upward trends in the StochRSI, TC, and OBV indicators.
-
Thank you for reading to the end.
I wish you successful trading.
--------------------------------------------------
CMCSA

$Comcast Even Giants Can Stumble$Comcast is a very diversified company which does many things including media, Theme Parks, Connectivity Services. A Massive Company that has huge Free Cash Flow, Cash from Operation. I Personally have started building a position from $27.88 (200 Shares) and I plan to buy more with time. This company has paid dividends and grown them for 17 Years in a row. I Definitely like this business at these prices I find the Balance Sheet Strong while carrying a lot of Debt they produce a lot of cash to offset that, They also have an almost monopoly in Theme Parks / Connectivity considering there Size and Scale / Resources.
---------------------------
Balance Sheet:
Cash: US$9.33b
Equity: US$97.64b
Debt: US$99.06b
Total Liabilities: US$175.36b
Total Assets: US$273.00b
---------------------------
Company Performance:
Revenue: US$131.73b
Earnings: US$22.61b
Free Cashflow: US$18B
Cash From Operations: US$32B
---------------------------
Company Efficiency:
ROE: 22.81%
ROA: 9.9%
ROCE: 9.2%
---------------------------
Disclaimer:
This post reflects my personal opinions and is for informational and educational purposes only. Nothing here should be considered financial, investment, or legal advice. I am not a licensed financial advisor, analyst, or CFA. Always do your own research and consult with a qualified professional before making any investment decisions. I am not responsible for any losses or gains that may result from actions taken based on this content. In No way is this post a suggest or signal such as a buy, Hold or Sell Suggestion.
---------------------------
Data & Accuracy Disclaimer:
All financial figures, metrics, and company information presented here are based on publicly available sources that I believe to be reliable at the time of posting, but I do not guarantee their accuracy or completeness. Financial data changes frequently, and errors may occur. Always verify information independently using official filings, company reports, or trusted financial platforms.
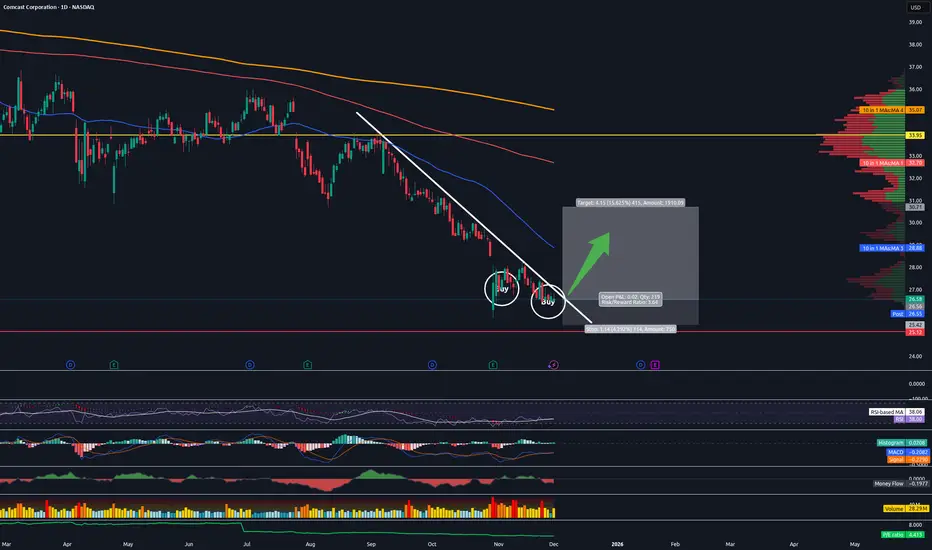
Long Comcast CMCSATrading Fam,
Not getting many long signals from my indicator these days. When I do, I pay attention. In this case, I've received two long signals on the same stock. Though, I am currently only short (and in the profit on both: TSLA and PLTR), I've decided to enter here long on Comcast. My indicator rarely fails me when it signals on these high MC/high vol. stocks. So, I will listen.
On the technical side, I am seeing a nice trendline, which, if my indicator is correct, we will break to the upside on soon. Should at least fill that recent gap down and hit the 50 SMA fairly quickly. It may be worth taking some profit at that point and raising stops to break even. I expect we'll hit our heads on that 50 SMA and draw back for a day or two at least while we wrestle around with it for a little. And then, should we break to the upside, we'll move quick. My final target may even be set too low at this point. I am trading cautiously. But we could tag the underside of that 200 SMA in red before buying subsides to some degree. I'll probably leave a little on the table for this scenario while trailing my stops up as I grab profit.
Conservative target is around $30 with a SL at around $25.50 for a 2:1 rrr. Setting a final target of that 200 SMA would increase your rrr to 5:1 with a potential profit of 23%.
✌️Stew
CMCSA Comcast Corporation Options Ahead of EarningsAnalyzing the options chain and the chart patterns of CMCSA Comcast Corporation prior to the earnings report this week,
I would consider purchasing the 37.5usd strike price Calls with
an expiration date of 2025-9-19,
for a premium of approximately $1.35.
If these options prove to be profitable prior to the earnings release, I would sell at least half of them.

CMCSA : Going long for about 0.625% of the net capitalTechnical Overview :
Took a position for about 0.625% of the net capital from the lower trendline of the parallel channel. The price did form a gap down and hence I waited for a consolidation pattern to be formed before being involved in the scrip.
Will be targeting the higher trendline of the parallel channel which is about 35% move from the average entry price.
Fundamental Overview :
In the fourth quarter ending December 31, 2024, Comcast reported a 2% increase in revenue, totaling $31.92 billion, and an adjusted earnings per share of $0.96. The Connectivity & Platforms segment saw a 5% revenue growth to $11.5 billion. However, the company experienced a loss of 139,000 broadband subscribers, exceeding the anticipated loss of 100,000.
Analysts have suggested that Comcast could unlock significant value by restructuring, potentially splitting into three separate public companies. This move is projected to increase Comcast’s stock value by 57%. The conglomerate structure has been cited as a factor leading to market discounts due to concerns over capital returns and leadership alignment.
📢📢📢
If my perspective changes or if I gather additional fundamental data that influences my views, I will provide updates accordingly.
Thank you for following along with this journey, and I remain committed to sharing insights and updates as my trading strategy evolves. As always, please feel free to reach out with any questions or comments.
Other posts related to this particular position and scrip, if any, will be attached underneath. Do check those out too.
Disclaimer: The analysis shared here is for informational purposes only and should not be considered as financial advice. Trading in all markets carries inherent risks, and past performance is not indicative of future results. It’s essential to conduct your own research and assess your risk tolerance before making any investment decisions. The views expressed in this analysis are solely mine. It’s important to note that I am not a SEBI registered analyst, so the analysis provided does not constitute formal investment advice under SEBI regulations.

CMCSA Comcast Corporation Options Ahead of EarningsAfter CMCSA reached the previous price target:
Now analyzing the options chain and the chart patterns of CMCSA Comcast Corporation prior to the earnings report this week,
I would consider purchasing the 40usd strike price Calls with
an expiration date of 2025-6-20,
for a premium of approximately $1.86.
If these options prove to be profitable prior to the earnings release, I would sell at least half of them.

Intraday, Swing trade setup in Comcast Corp (CMCSA)NASDAQ:CMCSA
Entry - 39.42 $
Target - 40.21 $
Trade will become invalid if the stock goes below 38.88 $ first before the entry level.
Indicators also showing a bullish trend

CMCSA Long Swing Aggressive Trend Trade 4RAggressive Trend Trade 4R
- short impulse
+ volumed T1 level
+ support level
+ volumed Sp
+ weak test
+ first bullish bar closed entry
Calculated affordable stop loss
1 to 2 R/R before 1/2 of daily short impulse take profit
Daily Context
+ long impulse
+ support level
+ 1/2 correction
+ monthly support level
+ biggest volume T2
+ manipulation of T2
Monthly Context
+ SOS bar level / T2?
+ 2Sp- + test

Comcast's Stellar Q4 Performance: Peacock Takes Flight
Comcast Corporation ( NASDAQ:CMCSA ) has delivered a standout performance in its fourth-quarter earnings, exceeding analyst expectations and showcasing robust growth in key segments. The company's net income of $3.26 billion or 81 cents per diluted share surpassed consensus estimates, driven by the stellar performance of its Peacock streaming services and a remarkable 12.2% increase in theme park revenue. We delve into the key factors that contributed to Comcast's success and explore the implications for investors.
Peacock's Soaring Success:
One of the standout stars in Comcast's ( NASDAQ:CMCSA ) Q4 report is its Peacock streaming platform, which reported quarterly revenue surpassing $1 billion for the first time. The platform added a substantial 3 million subscribers during the quarter, underlining its growing popularity among consumers. This achievement not only solidifies Peacock's position in the highly competitive streaming landscape but also bodes well for Comcast's ( NASDAQ:CMCSA ) digital future. The company's strategic focus on content creation and distribution is evidently paying off, as evidenced by Peacock's stellar performance.
Theme Park Triumph:
Comcast's ( NASDAQ:CMCSA ) theme parks experienced a remarkable surge in revenue, climbing 12.2% year-over-year. A significant contributor to this success was the opening of Super Nintendo World in Hollywood, drawing in crowds and boosting overall park attendance. The theme park business, often sensitive to economic fluctuations, showcased resilience in the face of challenges, proving to be a valuable revenue driver for Comcast ( NASDAQ:CMCSA ). Investors are likely to be pleased with the sustained growth in this segment, as it adds a layer of diversification to Comcast's ( NASDAQ:CMCSA ) revenue streams.
Dividend Hike and Share Repurchase Program:
Adding to the positive news, Comcast ( NASDAQ:CMCSA ) announced a dividend increase of $0.08, marking a 6.9% year-over-year growth to $1.24 per share on an annualized basis for 2024. This move reflects the company's confidence in its financial health and outlook. Shareholders are set to benefit from the increased dividend, potentially attracting income-oriented investors.
Furthermore, Comcast's ( NASDAQ:CMCSA ) Board of Directors approved a new share repurchase program authorization of $15 billion, effective from January 26, 2024. This sizable authorization underscores the company's commitment to returning value to shareholders and its confidence in its future cash flow generation. Share buybacks can be seen as a positive signal, often indicating that the company's leadership believes its stock is undervalued.
Conclusion:
Comcast's ( NASDAQ:CMCSA ) robust Q4 performance, buoyed by the success of Peacock and theme parks, positions the company favorably in the media and entertainment landscape. The dividend hike and the substantial share repurchase program further underscore Comcast's commitment to shareholder value. As the company continues to navigate the evolving digital landscape and leverage its content creation capabilities, investors may find Comcast ( NASDAQ:CMCSA ) to be an attractive proposition for both growth and income in the coming quarters.

EOY Review $CMCSA inside year, momo hammer quarterNASDAQ:CMCSA
that momo hammer on the quarter looks promising, but these type of candles can easily reverse
and when it does, it typically drops back quickly
the inside year tells me to wait for further clues first before taking trades
hence, no long or short (bias) for me on this one yet
obviously, when that hammer high on the quarter gets taken out and price continues to move up, the overall picture improves, with the '23 and '22 highs as important pivots

COMCAST Pullback ain't over yet. See where to buy.Despite the impressive six day rally after its Earnings gap down, Comcast has been rejected on the LH trendline without managing to cross over the 1D MA50. With the 1D MACD on a Bullish Cross though and the 1D technical outlook slightly bearish (RSI = 44.968, MACD = -0.620, ADX = 24.974), we expect a 0.618 Fibonacci pullback in a similar manner as November 3rd 2022 and March 24th 2023. Our medium term target is R1 (TP = 47.35).
See how well our prior idea has worked:
## If you like our free content follow our profile to get more daily ideas. ##
## Comments and likes are greatly appreciated. ##

CMCSA Comcast Corporation Options Ahead of EarningsAnalyzing the options chain and the chart patterns of CMCSA Comcast Corporation prior to the earnings report this week,
I would consider purchasing the $45 strike price Calls with
an expiration date of 2023-8-18,
for a premium of approximately $0.47.
If these options prove to be profitable prior to the earnings release, I would sell at least half of them.
Looking forward to read your opinion about it.

COMCAST Hit our long-term target. Expecting a pull-back.It has been a worthwhile wait on our previous COMCAST (CMCSA) buy signal (see chart below) that we gave on April 28, but it finally hit the $44.00 target today:
The trend is unchanged within the Channel Up pattern since the October 13 2022 bottom, but as the 1D RSI turned extremely overbought (above 70.00), it gives a sell signal since every overbought break-out delivered a pull-back towards the 1D MA50 (blue trend-line) at least. The 1D MA50 is currently on the 0.382 Fibonacci retracement level (from the ATH) and moving parallel to the bottom (Higher Lows trend-line) of the Channel Up. We project the pull-back to be within 43.50-42.50. After that, our buy target will be Resistance 1 at 48.50.
-------------------------------------------------------------------------------
** Please LIKE 👍, FOLLOW ✅, SHARE 🙌 and COMMENT ✍ if you enjoy this idea! Also share your ideas and charts in the comments section below! **
-------------------------------------------------------------------------------
💸💸💸💸💸💸
👇 👇 👇 👇 👇 👇

CMCSA: Bullish WeeklyThis communication stock may play catch u [ to some of the overbought names.
Relative strength when the sector is down is very positive.

CMCSA - Angled Double BottomsThree angled double bottoms that are very similar.
All leading to bullish results.
Bars pattern shows my bullish thoughts.
A double bottom is considered a bullish pattern.

CMCSA DCA - Cup and HandleCompany: Comcast Corporation
Ticker: CMCSA
Exchange: NASDAQ
Sector: Communication Services
Introduction:
Greetings, and welcome to today's technical analysis. We're focusing on the daily chart of Comcast Corporation (CMCSA), highlighting a bullish reversal pattern known as a cup and handle that has formed over 294 days.
Cup and Handle Pattern:
The cup and handle pattern is often a bullish continuation or a bullish reversal signal and is characterized by a 'U' shape (the cup) followed by a smaller, downward drift (the handle). The formation is complete when the asset's price breaks above the resistance line marking the top of the handle.
Analysis:
Comcast Corporation's price was previously in a downtrend, denoted by the blue diagonal resistance line. This downward movement appears to have been interrupted by the cup and handle pattern. The horizontal resistance line of this pattern is located at $40.94, with the price currently having a second breakthrough.
Notably, the 200 EMA is above the price, suggesting a bullish market environment.
Upon a successful breakout, the projected price target is $53.50, offering a potential rise of 30.70%. Therefore, a long position might be considered.
Conclusion:
The daily chart of Comcast Corporation presents an interesting scenario, with the formation of a cup and handle pattern suggesting a potential bullish reversal. With the successful breakout above the pattern's resistance this presents an opportunity for a long position.
As always, please bear in mind this analysis does not constitute financial advice. It's vital to conduct your own research and consider risk management strategies when investing.
If you found this analysis insightful, please like, share, and follow for more updates. Happy trading!
Best regards,
Karim Subhieh

CMCSA, 10d+/-14.30%falling cycle -14.3% more than 10 days.
==================================================================================================================================================================
This data is analyzed by robots. Analyze historical trends based on The Adam Theory of Markets (20 moving averages/60 moving averages/120 moving averages/240 moving averages) and estimate the trend in the next 10 days. The white line is the robot's expected price, and the upper and lower horizontal line stop loss and stop profit prices have no financial basis. The results are for reference only.

CMCSA - head and shoulders On the chart we can see that Comcast Corporation is creating a head and shoulders pattern.
We are waiting for the breakout of the neckline to take our short position.
Target and stop loss are shown on the chart.

$cmcsa will pull back?There is an uptrend for $cmcsa. I would wait a pull back to get in. My set up is as below.
Entry; $37.14
S/L; $36.84
TP1; $38.14
TP2; $39.61
Please always do your own search and analysis before you take any trade. Do not rely on anyone :)

Some more juice on CMCSA I believe we are forming a corrective zigzag with price pushing up a bit more to where i have V labeled. After this we could possibly see correction to form wave B.
*Not financial advice.

CMCSA weekly bearish hammerSell Stop 28.75 LMT 28.75 GTC
Buy Limit 23.19 GTC
Buy Stop 31.94 GTC
CMCSA weekly bearish hammer, stop loss above long day candle, take profit at next support zone.

CMCSA short on monthlyWe are pretty low, but expect to use MA 100 as resistance and MA 200 as support, so feel we can go lower in between MAs

Comcast crashing hard. CMCSAAnd this is not even after a coke binge or an overdose of something that seemed like a good idea at the start of the party. This one is heading the way that the whole market is generally heading right now.
We are not in the business of getting every prediction right, no one ever does and that is not the aim of the game. The Fibonacci targets are highlighted in purple with invalidation in red. Confirmation level, where relevant, is a pink dotted, finite line. Fibonacci goals, it is prudent to suggest, are nothing more than mere fractally evident and therefore statistically likely levels that the market will go to. Having said that, the market will always do what it wants and always has a mind of its own. Therefore, none of this is financial advice, so do your own research and rely only on your own analysis. Trading is a true one man sport. Good luck out there and stay safe.
