Why CME Raises Margins in Futures Markets█ Why CME Raises Margins: What Gold, Silver, and Commodity Traders Need to Understand
When people hear that CME raised margin requirements, the reaction is usually emotional:
“They’re manipulating the market”
“They’re trying to crash gold and silver”
*“They’re scared of traders making money”
In reality, margin hikes have nothing to do with profits and everything to do with risk control.
Let’s break it down in a way that actually makes sense.
█ What is margin (and why does it exist)?
Margin is not a fee and it’s not a cost. Margin is a security deposit.
When you trade futures, you’re controlling a large position with a relatively small amount of capital. That leverage is only possible because someone is guaranteeing your trade.
That’s where margin comes in.
Margin is the money you post to ensure that:
Losses can be covered if the market moves against you
The system stays solvent
Trades can always settle
There are two main types:
Initial margin – required to open a position
Maintenance margin – the minimum you must keep to hold it
If your account falls below maintenance margin, you get a margin call.
█ First: Who guarantees futures trades?
Every futures trade has a guarantor.
When you trade futures, you are not trading directly with another trader. Once the trade is cleared:
The clearinghouse (CME Clearing) becomes the counterparty to both sides
CME guarantees the trade will settle, no matter what
But CME doesn’t do this alone.
Between you and CME sit clearing members, large banks and institutions that:
Clear trades
Hold margin
Guarantee client positions
If a trader blows up and can’t pay, the clearing member is responsible, not CME and not the other trader.
That’s why clearing members matter so much.
█ The rent analogy
Think of it like renting an apartment.
You = the tenant (trader)
Clearing member = landlord (bank)
CME Clearing = the bank that finances the building
You put down a security deposit (margin). If things are calm, the deposit is enough.
But if:
The tenant starts throwing parties
Damage risk goes way up
Repairs could exceed the deposit
The landlord asks for a bigger deposit.
That’s exactly what margin hikes are.
█ Why margins are rising now in gold, silver, and other commodities
Right now across several commodities:
Prices have moved quickly
Volatility is elevated
Many futures traders are sitting on large unrealized profits
Unrealized profit is not cash. It can disappear very fast.
In a high-volatility environment:
A sharp move lower can flip profits into losses
Losses can exceed posted margin before positions are liquidated
That risk rolls up to clearing members (banks)
From CME’s perspective, the question is simple:
“If prices drop fast, are current margins enough to cover losses?”
If the answer is “maybe not”, margins go up.
█ Important point: CME is not calling a crash
This is critical.
CME is not predicting direction.
They are not saying gold, silver, or commodities must fall.
They are saying:
“If a fast move happens, we need more collateral in the system.”
Margin hikes usually result in:
De-leveraging
Forced liquidations for over-levered traders
Higher short-term volatility
Sometimes price pulls back. Sometimes it goes sideways. Sometimes the trend continues, just more slowly. Margin hikes are about survivability, not price targets.
█ Why this protects institutions (and why that matters)
Clearing members are major banks and financial institutions.
If one fails:
Losses spread to other members
Default funds are tapped
Confidence in settlement breaks
Liquidity disappears
That’s how markets freeze.
So CME’s job is to:
Keep positions adequately collateralized
Push risk back to traders early
Prevent losses from reaching the institutional core
This is why the system is designed institution-first. Not because it’s unfair, but because without them, there is no market.
█ What this means for retail traders
Margin hikes:
Do not change long-term commodity fundamentals
Do not affect physical holders
Do primarily affect leveraged futures traders
The real risk is not price, it’s leverage in high volatility.
█ Final takeaway
There is a lot of unrealized P&L across gold, silver, and other commodities right now, and with volatility elevated, a sharp move could create losses larger than current margin levels. CME raises margins to keep positions covered and to protect clearing members and the clearinghouse from tail risk.
That’s how the futures market works.
-----------------
Disclaimer
The content provided in my scripts, indicators, ideas, algorithms, and systems is for educational and informational purposes only. It does not constitute financial advice, investment recommendations, or a solicitation to buy or sell any financial instruments. I will not accept liability for any loss or damage, including without limitation any loss of profit, which may arise directly or indirectly from the use of or reliance on such information.
All investments involve risk, and the past performance of a security, industry, sector, market, financial product, trading strategy, backtest, or individual's trading does not guarantee future results or returns. Investors are fully responsible for any investment decisions they make. Such decisions should be based solely on an evaluation of their financial circumstances, investment objectives, risk tolerance, and liquidity needs.
Cmefutures

BTC at a Crossroad: Head & Shoulders or Moonshot? Analyzing the CME Bitcoin Futures chart, we can clearly see confirmation of the price gap between $92K and $94K, which significantly increases the probability of a Head & Shoulders (H&S) formation.
✅ Key Scenarios to Watch
Scenario 1 – H&S Confirmed:
Potential retracement toward $52K–$62K based on the right shoulder's depth
Scenario 2 – Failure H&S Confirmed:
Bullish breakout could push BTC toward $140K–$150K. based on the right shoulder's depth
🔍 Technical Insight
The left shoulde r formed near the Fibonacci 0.618 / 0.382 leve ls. Based on these Fib zones, the right shoulder could develop within a similar range—critical for validating the pattern if weekly closure occurs over 94K .
Disclaimer: This analysis is for educational purposes only and does not constitute financial advice. Always do your own research and manage risk appropriately before making any trading decisions.

CME Group ($CME) Stock: Restores Trading After Major OutageCME Group brought its Globex Futures & Options platform back online after an hours-long outage that disrupted global markets across Asia and Europe. The shutdown struck during a holiday-shortened US session, creating uncertainty for traders managing month-end rolls. Globex processes nearly 90% of CME’s total volume, so the disruption rippled across commodities, rates, equity futures, and FX-linked products.
The outage stemmed from a cooling-system failure at the Aurora, Illinois data center operated by CyrusOne. The facility has long served as the main engine for CME’s electronic infrastructure. High-frequency trading firms rely heavily on proximity to the Aurora center, making the malfunction a notable stress point for global liquidity.
Treasury futures, SOFR-linked options, gold, crude oil, and palm oil markets all experienced interruptions or erratic price action. Liquidity thinned as traders shifted into cash Treasuries to manage exposure. The timing was challenging since the previous day’s Thanksgiving closure already limited activity.
Operational Risk Concerns Rise
The event revived questions about CME’s redundancy planning. The exchange has a disaster-recovery site in the New York area, yet opted to restart from Aurora because early assessments suggested a quicker resolution. The delay highlighted how a single point of failure creates broad market friction across asset classes.
Technical Outlook: Bullish Structure Holds
CME stock maintains a bullish structure. Price retested and held support around $272 after a recent breakout. Momentum targets remain at the $288 resistance zone, followed by $290 if strength persists. The setup favors continuation as long as price remains above support.

Understanding Margin & Mechanics in Futures MarketsBefore you trade Futures, it’s essential to understand how these markets operate, especially how margin, leverage, and settlement work. This insight helps you manage risk, stay capital-efficient, and avoid unnecessary surprises.
Margin Basics
Every future position requires margin. It’s important to note margin is not an added cost per contract, margin is a good-faith deposit or can be thought of as a “performance bond” to ensure you can meet your obligations. There are three main types:
Initial Margin: The exchange sets this as a percentage of the contract’s notional value based on a wide variety of factors including volatility, size of the contract, and average market movement.
Maintenance Margin: The minimum balance required to keep your position open. If your balance drops below this, you’ll get a margin call.
Day Trading Margin: Set by your broker, often a fraction of the exchanges Initial Margin. Day Trading margins can provide more leverage, but in turn this comes with more risk.
Leverage in Action
Futures are leveraged products. With just a small amount of capital, you can control a much larger position. For example, with the E-mini S&P 500 trading at 6800, one contract has a notional value of $50 x 6800 = $340,000. We illustrate this below using initial margin and day margins examples.
Leverage using Initial Margin:
Leverage = Notional Value / Initial margin required
Example:
For 1 Long ES contract, with initial margin $23429.
Leverage = 340,000 /23429
Leverage = 14.5x
Leverage using Day Trading Margin:
Leverage = Notional Value / Day margin required
For 1 Long ES contract, with day margin at $1000.
Leverage = 340,000/1000
Leverage = 340x
**As the notional value rises or falls, so does leverage. Leverage is a double-edged sword it can work for you and against you. Higher leverage increases the risk of gains as well as losses.
Depending on your margin, you might only need a few thousand dollars to take that trade. While this enhances your buying power, it also increases risk, as losses could exceed your initial deposit.
Mark-to-Market & Daily Settlements
Futures are marked to market daily. This means your P&L is updated at the end of each session based on the day’s closing price. Gains are credited to your account, and losses are debited, helping to ensure real-time risk management and capital adequacy.
Physical vs. Cash Settlement
When a contract expires, there are two possible outcomes:
Physical Delivery: You receive or deliver the actual commodity.
Example: An oil producer secures a price of $62.00 per barrel through a long futures position. At contract expiration, the producer is obligated to take delivery of 1,000 barrels, which represents $62,000 in total value. If market prices rise to $80.00 per barrel, the producer can sell the physical oil at an $18.00 per barrel gain (before accounting for commissions and futures and other related fees).
Cash Settlement: No goods change hands, and your account is adjusted based on the final settlement price set by the exchange. This is common in financial contracts like the E-mini S&P 500 (ES).
Understanding margin and leverage is fundamental to trading futures effectively. These mechanics define how much risk you’re taking, how your capital is allocated, and how your account is managed daily.
At EdgeClear, our mission is to help traders develop a deeper understanding of the markets and the tools that move them. Follow us on TradingView for more Trade Ideas like this one, or connect with our team to learn how you can trade futures with confidence, precision, and the right guidance.
Bitcoin Update - Stay range bound or breakdown
In this video I briefly recap on the expected swing failure at the lows and how we stayed rangebound since .
Although now we are back at the range lows I look at what might be ahead of us, do we break down this time or hold and push back inside .

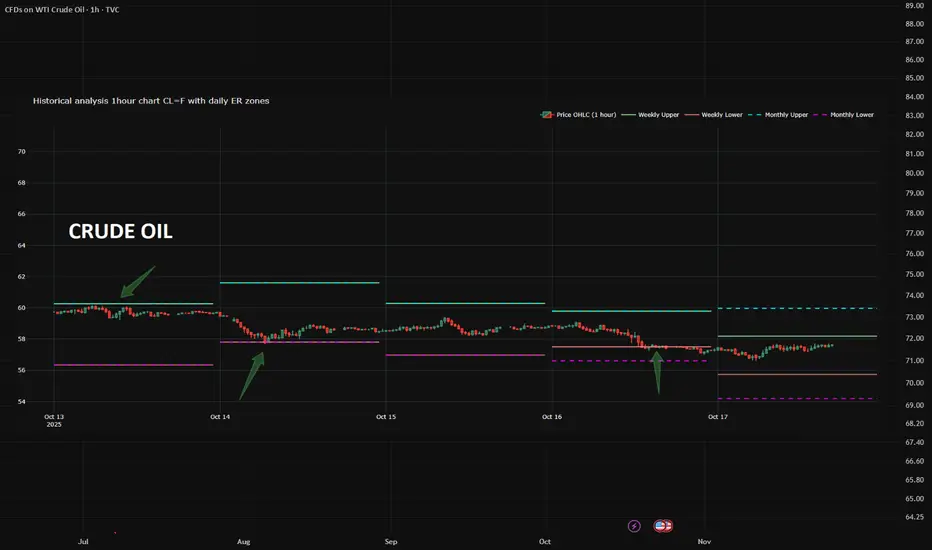
ER: The Hidden Tool 95% of Traders Ignore (But Shouldn’t)What if I told you there’s a free, stats-backed tool that shows you where price is likely to stop or reverse — with 68% confidence?
Meet Expected Range (ER) — not a magic bullet, but a massive edge when used right.
✅ Based on CME data & Nobel-winning math
✅ Defines high-probability support/resistance zones
✅ Free from CME website.
I never trade without checking ER anymore.
It turns noise into structure.
👉 Check the screenshots yourself — see how price reacted at each edge last week.
The only thing you need to do?
→ Grab ER data from the CME website daily
→ Apply a simple conversion formula
→ Plot it on your futures chart
That’s it.
Now you’ve got statistically grounded levels right in front of you.
Depending on your market view, you can:
• Short from the upper ER boundary
• Use it as a trend support entry zone
• Hide stops beyond the range — because price statistically won’t reach them
⚠️ Caveat: ER isn’t a crystal ball.
But in normal markets - ER zones hold ~4 out of 5 times.
Question for you:
Are you using ER? Or still guessing support/resistance?
Transparency first. No hype. Just real results.
Dont get trapped chasing the Opening gap Bitcoin Hello and Welcome
Here I present to you a quick theory on the Bitcoin CME open in the event we gap down and open in the 112K range.
This idea is just something to consider in the week ahead, with many traders destroyed as a result of Fridays crash and emotions running high going into the week ahead I encourage you to take a listen to this potential scenario for the week ahead on BTC.

A simple Introduction to Footprint charts
Welcome to this educational video on footprint charts .
I decided to do this introduction because I feel it would benefit so many traders who are unfamiliar with this chart type and once understood it can serve as a very powerful additional confluence in your day to day trading .
I hope I have delivered this lesson in a simple and understandable format for you too
understand the following .
The problem with just watching the price
What is order flow
Delta explained
What is open interest
How to tie it all together to produce better entries , exists and oversight into knowing when to take your trades.
I welcome any feedback or questions and I really hope that this serves you well.
*The link to the Tradingview guide is in the designated box on the right hand side I encourage everybody to use this resource .

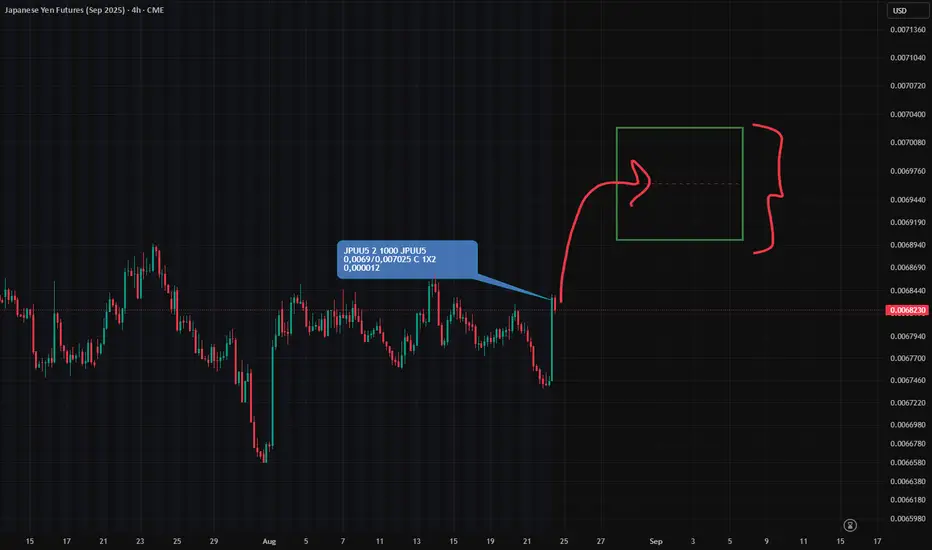
JPY "Call Butterfly" Update: Not Closed — But Sold
Yesterday’s CME data shows movement in the JPY futures call butterfly (centered at 0.00705):
The entire portfolio was re-sold — not closed.
(See arrow on chart: futures price at moment of transfer.)
🧠 What’s Going On?
Instead of unwinding the position during the dip, the market saw a transfer of ownership.
This suggests:
Another player stepped in to buy it cheaper
He believes JPY futures still has upside potential by expiry
Confidence remains — just in different hands
✅ Bottom Line:
The butterfly didn’t exit — it changed hands.
Likely moved to a more informed or confident trader.
Sentiment: moderately bullish (USDJPY - bearish), not fading.
However, from a technical standpoint, we can’t yet speak of bullish confirmation in JPY futures.
A key condition must be met first:
✅ A clear break USDJPY and close above the local low.
And in my methodology, "confirmation" means:
📌 Price must stay above (below) that level for at least 24 hours after the breakout (chart attached)

Just Because It’s Big Doesn’t Mean It’s SmartJPY Call Spread Breakdown: Bullish Signal — Or Just Obvious FOMO?
A new vertical call spread appeared in JPY options yesterday (per CME Globex data):
Long 0.0069 Call
Short 0.007025 Call
🎯 Target: 0.007025 — upside continuation play.
Open interest increased at both strikes → new position, not a roll.
Size? Relatively large for JPY (based on systematic observations).
⏰ When Was It Opened?
9:45 AM CT — after yesterday’s sharp rally in JPY futures.
In fact — right at the top of the move.
📌 Not before the move.
But after the impulse, on momentum.
🔍 Combining Flow + Chart Context:
Price had already spiked up.
The spread bets on further upside .
🧠 Key Takeaways:
✅ Sentiment: Bullish
❌ Predictive value: Low — nearly zero
Why?
The setup is too obvious.
No evidence of insider-like timing.
If this had been placed before the move — yes, it would matter.
But opening at the peak? That’s not edge — it’s FOMO dressed as strategy.
🚫 Will I go long JPY futures based on this?
No.
Not because I doubt the move.
But because this isn’t smart money behavior — it’s trend-chasing.
🎯 Final Lesson:
Not every large options trade is a signal.
Always ask:
When was it placed?
Why here?
Who’s behind it?
🔍 True edge isn’t in the trade itself — it’s in the context around it.
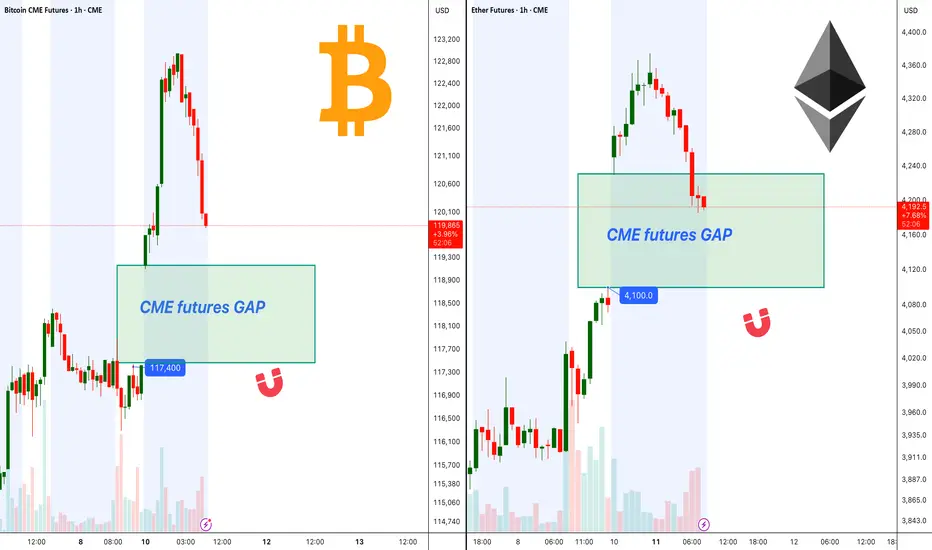
BTC, ETH CME Gaps Could Fill Before Bullish Continuation!Ethereum CME futures currently show a visible gap around $4,100 . Price is approaching this level, and based on historical behavior, CME gaps often act as magnets, drawing price in to fill them before a continuation in trend.
Bitcoin CME futures also have a gap sitting near $117,400. The recent rally has brought BTC close to this zone, increasing the probability of a short-term retracement to fill the gap before any significant breakout attempts.
Both gaps are key areas to watch, as a clean fill followed by strong buying pressure could set the stage for the next bullish wave in BTC and ETH.
Cheers
Hexa
Bitcoin - Structural Compression, CME Pull Below.⊣
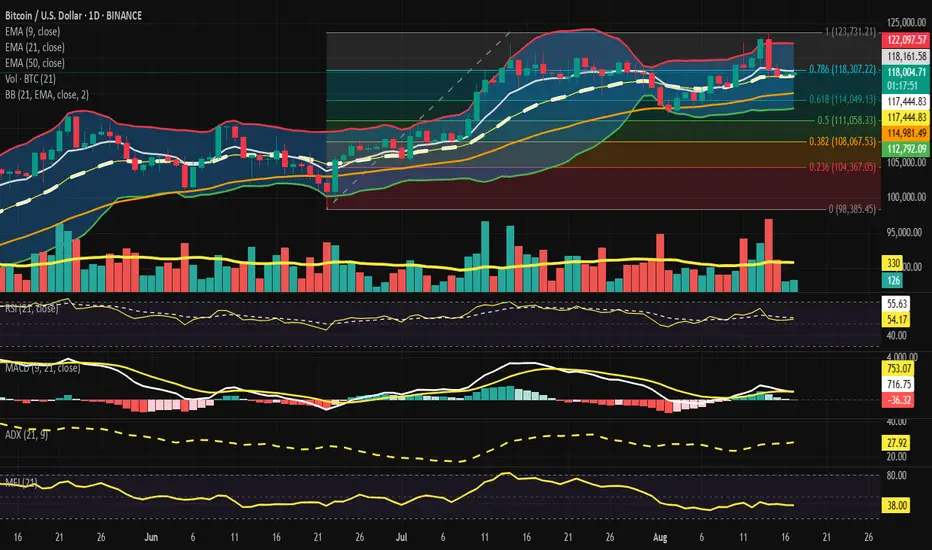
⟁ BTC/USD - BINANCE - (CHART: 1D) - (Aug 17, 2025).
◇ Analysis Price: $117,902.79.
⊣
⨀ I. Temporal Axis - Strategic Interval - (1D):
▦ EMA9 - $118,141.19:
∴ Current price sits $238.40 (−0.20%) below the EMA9, signaling short-term momentum cooling;
∴ The EMA9 is still aligned above EMA21 and EMA50, reflecting bullish micro-trend structure;
∴ However, the rejection from EMA9 suggests it is acting as immediate resistance rather than support.
✴️ Conclusion: The EMA9 transforms into a barrier for continuation; price must reclaim it promptly or risk sliding deeper into mid-range.
⊢
▦ EMA21 - $117,435.56:
∴ Spot trades $467.23 (+0.40%) above EMA21;
∴ EMA21 coincides with the Bollinger Basis, reinforcing its importance as the primary daily mean;
∴ The EMA21 serves as a pivot magnet - losing it would turn the short/mid bias neutral.
✴️ Conclusion: EMA21 remains structural support anchoring the trend, but pressure is visible from overhead EMA9.
⊢
▦ EMA50 - $114,977.49:
∴ Spot trades $2,925.30 (+2.55%) above EMA50;
∴ The bullish stack (EMA9 -> EMA21 -> EMA50) holds intact, confirming trend integrity on the mid horizon;
∴ A drop to EMA50 would mark a full corrective retracement, aligning with (Fibo 0.618 - $114,049.13).
✴️ Conclusion: EMA50 is the deeper structural defense; maintaining distance here preserves the bullish medium trend.
⊢
▦ BB (21, 2) - Basis: $117,435.56 / Upper: $122,084.15 / Lower: $112,786.98:
∴ Bandwidth (≈ 7.9%) of the basis -> market in a moderate volatility state;
∴ %B (≈ 0.54), situating price in the upper-mid envelope, not yet expansionary;
∴ Distance to upper band = (+3.54%), to lower band = (−4.34%), giving slightly more downside breathing room.
✴️ Conclusion: Market is balanced in volatility containment, with room both ways, yet downside slightly more open than upside.
⊢
▦ Volume (21) - 330 (current bar: 124):
∴ Current volume = (62.4%) below the rolling average -> weak participation;
∴ Weak volume on corrective candles indicates seller conviction lacking;
∴ Lack of strong volume also impairs breakout potential, keeping consolidation dominant.
✴️ Conclusion: Thin liquidity magnifies potential for wicks and mean reversions, reducing clarity of current move.
⊢
▦ RSI (21, 9) - RSI: 54.00 | Signal: 55.60:
∴ RSI resides in the neutral-positive range, above the 50-line;
∴ Momentum lags the EMA9 signal -> short-term bearish divergence;
∴ No oversold/overbought conditions (20–80 boundaries untouched).
✴️ Conclusion: RSI reflects fragile bullishness, vulnerable to further drift unless it recaptures momentum above signal.
⊢
▦ MACD (9, 21, 9) - Line: 705.63 / Signal: 750.84 / Histogram: –45.21:
∴ MACD line under signal confirms bearish crossover;
∴ Histogram remains negative yet shallow, consistent with corrective phase, not collapse;
∴ Momentum is softening, aligning with RSI’s neutral drift.
✴️ Conclusion: MACD indicates waning momentum but not trend failure - a corrective digestion phase is unfolding.
⊢
▦ ADX (21, 9) - 27.92:
∴ ADX -> 25 shows a moderate active trend;
∴ No extreme strength (>40), leaving market prone to external catalysts (macro/news);
∴ Combined with EMA stack, direction leans bullish, but ADX’s plateau signals loss of directional energy.
✴️ Conclusion: ADX affirms trend strength but hints that fuel is draining, requiring new impulse for extension.
⊢
▦ MFI (21) - 37.98:
∴ Sub-50 reflects capital outflows dominating inflows;
∴ Value remains far from oversold (<20), no exhaustion yet;
∴ Divergence emerges if price holds above EMA21 while liquidity bleeds.
✴️ Conclusion: Liquidity suggests buyers hesitating, weakening upside conviction.
⊢
▦ Fibonacci Retracement (0.000 / 1.000) - Low: $98,385.45 -> High: $123,731.21:
∴ 0.786 ($118,307.22) - Current price sits $404.43 (−0.34%) below, forming short-term ceiling;
∴ 0.618 ($114,049.13) - Key support, confluent with EMA50 ($114,977.49);
∴ 0.500 ($111,058.33) - Deeper retracement support, aligning with volatility lower structure.
✴️ Conclusion: Market trapped between 0.786 resistance and 0.618/EMA50 support -> pivotal compression zone.
⊢
🜎 Strategic Insight - Technical Oracle:
∴ The BTC/USD daily structure reveals a market in compression: EMA9 as immediate resistance, EMA21 as fragile pivot, and EMA50 + Fib 0.618 as deep anchor support;
∴ RSI and MACD both highlight momentum decay, while ADX confirms moderate but fading trend strength;
∴ MFI points to hesitant inflows, warning of liquidity weakness;
∴ Thus, the battlefield crystallizes: $118,307.22 (Fib 0.786 / EMA9 proximity) as resistance, and $114,049–114,977 (Fib 0.618 + EMA50) as structural defense. A break either way will dictate expansion.
✴️ Conclusion: Until resolved, the market remains in stoic compression - silence before expansion.
⊢
∫ III. On-Chain Intelligence - (Source: CryptoQuant):
▦ Exchange Inflow Total + EMA9 - (All Exchanges):
∴ Historically, surges in inflows correlate with distribution events - localized tops or sell pressure phases;
∴ The current inflow reading remains muted, far below major spikes (100K / 300K BTC) observed during prior capitulation or distribution clusters;
∴ Sustained low inflows indicate reduced immediate sell pressure, aligning with exchange reserves declining trend.
✴️ Conclusion: Current inflow profile is neutral-to-bullish, as supply entering exchanges is contained.
⊢
▦ Structural Pattern (2022 -> 2025):
∴ In 2022–2023, inflows frequently exceeded 200K BTC, triggering strong bearish legs;
∴ Since 2024, inflow peaks are smaller and less frequent, even as price advanced past $100K - showing increased holding conviction;
∴ Localized inflow upticks in early 2025 preceded short-term corrections, yet were absorbed without trend breakdown.
✴️ Conclusion: Market maturity visible - holders distribute less aggressively, supporting resilience of higher valuations.
⊢
▦ EMA9 Overlay (On-Chain Inflow Smoothing) - (not numerically explicit, observed visually):
∴ EMA9 of inflows remains flat-to-declining into mid-2025;
∴ Lack of sustained inflow uptrend -> exchanges not receiving systematic sell-side waves;
∴ This reduction aligns with macro hodling behavior dominating.
✴️ Conclusion: The inflow EMA reinforces quiet supply pressure, consistent with accumulation psychology.
⊢
🜎 Strategic Insight - On-Chain Oracle:
∴ Exchange inflow dynamics confirm a structurally quieter supply environment compared to previous cycles;
∴ While localized inflow bursts still produce short-term pullbacks, the overarching pattern is one of diminished distribution;
∴ In tandem with technical compression (Fib 0.786 vs 0.618 battle on daily chart), this on-chain restraint tilts risk asymmetry toward buyers - provided inflows remain subdued.
✴️ Conclusion: The silence of supply is itself a force: fewer coins offered into the market mean any liquidity shock could amplify upward expansion.
⊢
⟁ BTC/USD - CME Futures BTC1! - (CHART: 1D) - (Aug 17, 2025):
◇ Current Price: $118.150.
◇ Chart Link:
⊣
▦ CME Futures GAP - Observation & Ritual Closure:
CME Previous Close - $117,235.00;
CME Current Open - $117,995.00;
CME Last Print - $118,150.00.
∴ GAP CME (Open vs. Previous Close) = +760 pts (+0.65%);
∴ This leaves an upward GAP from ($117,235) -> ($117,995);
∴ GAP already in partial closure zone (low today $117,645).
✴️ Conclusion: CME opened with bullish GAP, partially tested intraday. Historical tendencies favor full gap closure within subsequent sessions (≈ 85% probability), yet persistence above $118K could normalize it as a continuation gap.
⊢
▦ Volume (CME - Session) - 38 contracts (low relative participation):
∴ Initial session prints show light activity;
∴ Weak volume reduces conviction of gap as an institutional “breakaway”;
∴ Implies gap more likely to be filled than sustained immediately.
✴️ Conclusion: Low conviction inflow reduces sustainability of gap.
⊢
🜎 Strategic Insight - CME Oracle:
∴ The CME chart reveals an upward opening GAP (+760 pts), currently under test. Historically, such gaps on BTC futures act as magnets until closure, unless validated by institutional surge volume;
∴ With today’s session showing thin activity, the odds tilt toward eventual closure at ($117,235);
∴ Thus, the institutional map places immediate magnetic risk below spot, even as the daily technicals (BTC/USD - 1D) compress between (Fib 0.786 and EMA50).
⧉ Together with subdued on-chain inflows, the structure suggests:
Spot chart = technical compression (awaiting breakout);
On-chain = low supply inflows, bullish undertone;
CME = gap pull magnet down toward ($117,235), unless denied by volume expansion.
⊢
𓂀 Stoic-Structural Interpretation:
∴ The daily BTC/USD frame manifests in compression - EMA9 overhead resistance vs. EMA21/EMA50 layered supports, with Fib 0.786 as ceiling and 0.618 as anchor;
∴ On-chain inflows remain muted, signaling reduced distribution and a silent, stoic restraint of supply;
∴ The CME Futures GAP (+760 pts) exerts a gravitational magnet toward ($117,235), yet its low-volume print weakens institutional conviction.
✴️ Stoic Arcane Conclusion: Structure stands at the threshold of stoic tension - supply muted, momentum fading, futures pulling. The silence of inflows aligns with a potential expansion, yet institutional gravity demands respect.
⊢
✦ Structure:
∴ BTC/USD (1D Spot) -> Compression defined between Fib 0.786 ($118,307) resistance and Fib 0.618 + EMA50 ($114,049–114,977) support; EMA9 acts as immediate friction, EMA21 as fragile pivot;
∴ On-Chain Inflows -> Exchange inflows remain muted (10.2K BTC recent), far from historic distribution surges, confirming supply silence and stronger holder conviction;
∴ CME Futures -> Market opened with an upward GAP (+760 pts) from $117,235–$117,995, partially tested but unresolved; low volume weakens breakout sustainability, implying magnetic pull back toward closure.
✴️ Structural Reading: Bitcoin stands at a convergent triad - technical compression, on-chain restraint, and institutional gap gravity. Expansion is imminent, but direction hinges on whether the spot chart breaks above ($118,307) or the CME magnet drags price to ($117,235).
⊢
· Cryptorvm Dominvs · MAGISTER ARCANVM · Vox Primordialis ·
· Dominivm Cardo Gyratio Omnivm · Silence precedes the next force. Structure is sacred ·
⊢
Bitcoin CME Closing Price: The Key to Next Week’s TrendIn this video I cover the CME closing price and go through a plan which includes a gap to the upside and a short squeeze before gravitating to the downside for lower targets .
I also give a bias for higher prices if the VAH is claimed .
This idea is modelled on the daily time frame and can play out over the course of the following week or more .
I also look at the Eth/Btc pair and the Btc dominance chart and marry whats happening on those charts with this idea .
When looking at BTC I use order flow software to further support my bias and the confluences I present in the chart.
If you have any questions then leave them below .
Support my work with a boost and Safe trading

ES Futures-Weekly OutlookCME_MINI:ES1!
Fundamentals and Economic Calendar
Data Recap:
• Friday: 06/06/2025
o US Non-Farm Payrolls (May) 139k vs. Exp. 130k (Prev. 177k, Rev. 147k)
o US Unemployment Rate (May) 4.2% vs. Exp. 4.2% (Prev. 4.2%)
o US Average Earnings YY (May) 3.9% vs. Exp. 3.7% (Prev. 3.8%, Rev. 3.9%)
• Overnight Monday: 06/09/2025
o Chinese Trade Balance (USD)(May) 103.22B vs. Exp. 101.3B (Prev. 96.18B)
o Chinese Exports YY (USD)(May) 4.8% vs. Exp. 5.0% (Prev. 8.1%)
o Chinese Imports YY (USD)(May) -3.4% vs. Exp. -0.9% (Prev. -0.2%)
o Chinese CPI MM (May) -0.2% vs. Exp. -0.2% (Prev. 0.1%)
o Chinese PPI YY (May) -3.3% vs. Exp. -3.2% (Prev. -2.7%)
o Chinese CPI YY (May) -0.1% vs. Exp. -0.2% (Prev. -0.1%)
Looking ahead this week on the calendar, notable economic data releases are as follows:
• Wednesday: 06/11/2025
o US CPI YoY (May)
o US CPI MoM (May)
o US 10 year Note Auction
• Thursday: 06/12/2025
o US PPI MoM (May)
o US PPI YoY (May)
o US 30 year Bond Auction
• Friday: 06/13/2025
o Michigan Consumer Sentiment (Jun)P
o Michigan 1-year and 5-year Inflation Expectations (Jun)P
On the trade and tariff front, we have China-US trade talks continuing in the UK today. The Chinese Vice Premier is visiting the UK from June 8th-13th.
There has been progress made which is visible in terms of China relaxing export controls on rare earth minerals and President Trump stating that they are very far advanced on the China deal ahead of high level talks in London today.
The FED is in a blackout period until the FOMC meeting. Trade, tariffs, and geopolitical risks still need to be monitored.
Technical:
What has the market done?
With NQ leading, ES has also reclaimed yearly open. It held above yearly open in the overnight session.
What is it trying to do?
Climb higher, overlapping bars and yearly VPOC shifting higher denote acceptance at higher prices.
How good of a job is it doing?
Overlapping bars, headline risks and leveraged positions also point towards potential for prices moving lower before resuming higher or remaining range bound. TACO acronym traders may be in for max pain.
What is more likely to happen from here?
Given the data above, we would iterate given our previous explanation that recent data including CPI, PPI, Trade imports, exports is skewed due to trade tensions and this being reflected in business and consumer behavior. FED is likely to remain on hold while it waits and averages out the impact on growth, inflation and labor market.
Scenario 1: Push higher
Prices continue to push higher, if CPI comes in lower than expected, this may prompt a short-term continuation higher.
Scenario 2: Range bound
Markets remain in wait and see mode this week having climbed above yearly open. Markets build value higher and we expect VPOC to shift higher too.
Scenario 3: Sell-off
A mix of factors could e.g., trade talks stalling, weaker than expected US 10 year and 30 year auctions could foreshadow cracks appearing in the bonds market. This may fuel a wider sell-off if yields climb back higher.
Glossary:
ES - emini-S&P 500 Futures
NQ - emini-NASDAQ 100 Futures
VPOC - Volume Point of Control: The most traded price by volume in a given range. Represents acceptance or consensus

ES Trade Idea and Upcoming NFP ReportCME_MINI:ES1!
• What has the market done?
ES futures are lagging compared to tech heavy index NQ futures. ES futures are still below yearly open. Yearly open has been a strong area of resistance since the rally of April 6th Lows in futures complex.
• What is it trying to do?
ES futures are in consolidation mode, building value higher. VPOC has shifted higher since the gap up from May 11th open. VPOC and 0.786 fib level provide a base for a continuation higher.
• How good of a job is it doing?
Markets seem to be slowing its rally. After such a strong rebound, participants are wary of any pull-backs. Although a strong trend higher, consolidation or a pullback is not illogical at these levels.
• What is more likely to happen from here?
o Scenario 1: Hold steady and NFP provides needed boost for markets to get across yearly open resistance and climb higher.
o Scenario 2: A mixed NFP report may point towards further consolidation. Key level 5873 as support on move lower before reverting higher.
o Scenario 3: A hawkish NFP report that signals higher for longer rates, may be interpreted by market participants as less monetary stimulus and dwindling rate cut bets for this year. We anticipate a sell-off towards 0.618 fib level in this scenario, moving to the lower edge of micro composite volume profile.
In all the above scenarios, there is a clear LIS at yearly open. Other key levels are defined cleanly on the higher time frame. Important thing for traders to note here is to trade what you see and not what you think. Having an alignment between fundamentals and technicals is sound but the markets do what they do, and price moves where it should. Painting narrative to any move may sound fancy but it gets less important at intraday time frames in our opinion. Hence why we view all this considering auction markets and volume profile.
Glossary:
ES - emini-S&P 500 Futures
NQ - emini-NASDAQ 100 Futures
VPOC - Volume Point of Control: The most traded price by volume in a given range. Represents acceptance or consensus
NFP - Non-Farm Payroll: Released by the US Department of Labor around the 1st Friday of every month. It reports on Unemployment, Productivity and other key metrics. Key economic release
LIS - Line In the Sand: A key zone that might tip buyers or sellers to act to cover risk and might change the overall bias of our analysis

CME Futures PREMIUM —Bitcoin Will Continue To GrowThe PREMIUM between Bitcoin's CME Futures and spot price is still on. This means that Bitcoin continues bullish.
In a previous article, I used this signal to predict a bullish breakout and bullish continuation. When there is a bullish bias Bitcoin becomes more expensive on CME vs spot, it means buy demand is very strong. With a strong demand for Bitcoin from the public, prices continue to grow.
There is a huge difference between the double top in 2021 and the chart structure in 2025.
The double top in 2021 came out of a 5-up waves pattern. The current top comes out of a 7 months long consolidation phase. Based on Elliotts law of alternation, the bull market will end in a blow off top in 2025 rather than a double top. This means that we will see one final and very strong move up followed by a crash, and that's how the bull market will end. Think of 2017/2018 and you can get a perfect picture of how the bull market will end. The only question that remains is about how far up prices will go, will the bullish wave end at $157,425 or will it go to $211,855?
Six months is enough to reach the second target.
This is a friendly reminder.
Bitcoin will continue to grow.
Namaste.

Yearly Open in Play — Is This the Real Bull or Just a Bounce?CME_MINI:ES1!
Macro Recap
Late Friday, Moody’s lowered the US’s sovereign rating from AAA to Aa1. This reflects a unanimous downgrade of the US, joining S&P and Fitch in stripping the US of its AAA status.
Would this result in a sell-off?
In our analysis, and consensus from the Street, is that it will be contained since the downgrade puts Moody’s in the same camp as S&P and Fitch.
There are talks of renegotiating UK–EU trade deals, which has boosted cable.
On the geopolitical side, not much has changed. Ceasefire talks are ongoing but stuck in neutral. No new catalysts—yet.
The spotlight, however, is firmly on the Fed. Over the weekend, President Trump called on Chair Powell to cut rates “before it’s too late,” echoing a post from April 17th where he labeled Powell’s speech “a complete mess” and added, “Powell’s termination cannot come fast enough.”
With a packed schedule of Fed speakers this week, the real question is whether they’ll double down on the Fed’s independence—or bend toward political gravity, especially with Trump reportedly eyeing the top job.
Economic data is light. That puts full attention on the Fed and headline risk. Traders should stay nimble and alert. Momentum could shift fast.
Markets are now pricing in two cuts of 25 bps each for September and December 2025.
This is very different from market pricing one month ago, when reciprocal tariffs were announced.
Monitoring rate cut expectations is another key theme this week, with multiple Fed speakers scheduled.
ES Futures
ES Futures have been one-time framing up — i.e., creating higher lows — on the weekly timeframe.
ES Futures have also created higher highs.
Key Levels:
• March 2025 High: 6052.50
• 2025 Yearly Open: 6001.25
• Previous Week High: 5977.50
• Previous Week Mid: 5856
Bull Market—or Just a Bear Bounce?
That’s the question traders are asking.
From our perspective, this looks like a recovery from a trade policy shock. The market took the hit, recalibrated, and bounced back.
But let’s not get ahead of ourselves. After a move this strong, some pause is natural. We’re watching for potential consolidation or profit-taking, especially with price action still holding below the yearly open.
Caution is warranted here—momentum’s in play, but the structure hasn’t fully confirmed the shift.
Scenario 1: Another Up Week, Capped by Yearly Open
In this scenario, the rally will be contained as the yearly open remains a strong pivot and resistance zone.
The LIS (Line in the Sand) for short trade opportunities is the yearly open pivot.
Scenario 2: Range-Bound Week
In this scenario, we expect markets to consolidate, remaining above last week’s low and finding support at the prior week’s mid-range.
We will look to initiate longs from the previous week’s mid-range, looking for level-to-level scalping opportunities in a range-bound market.

Intraday Playbook ES Futures: Trade Setup & Context CME_MINI:ES1!
Big Picture Context
Please see related trade idea.
In this analysis, we refine our intraday levels to identify potential trade setups. We also review recent price action and present a high-probability long trade example that frequently offers favorable risk-reward dynamics when it plays out successfully.
See chart image below reviewing yesterday’s long trade opportunity.
Example Trade Setup: SFP Long
Time frame: 1 hour or 30 mins
• Entry: 5612
• Stop: 5595.50 (below SFP candle)
• Target: 5682 (mCVAH — confluence with recent highs)
• Risk: 66 ticks
• Reward: 280 ticks
• Risk/Reward Ratio: 4.2 R
Note: Past performance is not indicative of future results.
________________________________________
Intraday Market Structure Review
What has the market done?
• ES Futures have rallied and reclaimed a key technical level.
• Currently trading above:
o March 2025 low
o 2025 mid-year level
o Developing Value Area Low (VAL) for the 2025 Volume Profile
What is the market trying to do?
• Recover prior months' losses.
• Price action is climbing steadily, establishing higher lows.
How well is it doing?
• Despite headline risks, ES futures show resilience.
• Price has painted green candles in the full session for the past 10 consecutive days—a strong bullish structure.
________________________________________
What Is More Likely to Happen from Here?
Scenario 1: Pullback and Continuation Higher
A pullback toward the 0.618 Fib retracement and mCVAH confluence could offer another long setup, targeting the April 2nd high. This is further supported by NQ already reclaiming those highs, with ES still lagging but showing strength.
Example Trade Idea:
Time frame: 1 hour or 30 mins
• Entry: 5688
• Stop: 5680
• Target: 5724 (May 2 High)
• Risk: 32 ticks
• Reward: 144 ticks
• Risk/Reward Ratio: 4.5 R
Target may be adjusted if relative volume and delta support strong momentum toward April 2nd highs.
________________________________________
Scenario 2: Further Consolidation
• Sellers push prices back into last week's balance/value area.
• Market consolidates and builds energy for a likely next leg higher.
• No short setup is presented, as current risk and stop placement do not justify initiating short positions.
Important Notes:
• These are example trade ideas not intended to be a recommendation to trade, and traders are encouraged to do their own analysis and preparation before entering any positions.
• Stop losses are not guaranteed to trigger at specified levels, and actual losses may exceed predetermined stop levels.

ES Futures: Upcoming Mag 7 Earnings and NFP Report
This week, although there was not much market-moving macro newsflow over the weekend, we are approaching month-end. In addition, several key catalysts are on the horizon, including earnings from the Magnificent 7 and the release of Non-Farm Payrolls (NFP) data, which typically arrives on the first Friday of the month.
The Federal Reserve is currently in its blackout period ahead of the interest rate decision scheduled for May 7th, 2025.
As part of our process, we will be reviewing technical levels and drawing a plan based on current market structure. ES futures are currently trading above the March 2025 lows. A “death cross” — where the 50-day moving average crosses below the 200-day moving average on the daily timeframe — was recently observed. This pattern is commonly touted by analysts as a bear market indicator.
However, in a macro-driven environment, this could potentially be a false signal.
Key Levels:
• mCVAL: 5622
• Upper Neutral Zone: 5620 -5585
• March 2025 Low: 5533.75
• 2022 CVAH: 5384.75
• Lower Neutral Zone: 5171.75 -5150.75
Our scenarios are as follows:
Scenario 1: Range-bound price action
A P-shaped micro composite profile suggests resistance at our neutral zone. It is labeled neutral because the price is trading above the March 2025 lows. However, if the level above acts as resistance, we expect further range-bound price action. Markets may trade below the mCVAL for further price discovery and potentially establish a new short-term range, with the 2024 lows acting as downside support.
Scenario 2: Mag 7 and NFP as bullish catalysts
Four of the Magnificent 7 companies are reporting earnings this week. The Mag 7 collectively represent around one-third of the S&P 500 index by market capitalization. Microsoft and Meta are scheduled to report on Wednesday after the close, while Amazon and Apple report on Thursday after the close.
On Friday, the NFP data will be released. This could serve as a fundamentally net-positive catalyst for U.S. markets, especially in light of recent shocks that have weakened sentiment.
In this scenario, we will be closely watching our neutral zone and mCVAL as potential areas to initiate long trades.
Glossary Index for all technical terms used:
Blue Zones: Neutral zones.
C: Composite (prefix before VAL, VAH, VPOC, VP, AVP)
mC: micro-Composite (prefix before VAL, VAH, VPOC, VP, AVP)
VAL: Value Area Low
VAH: Value Area High
VP: Volume Profile
CME_MINI:ES1!

The next trade idea for “6B” GBPUSD FX FuturesCME:6B1!
This trade idea is built on very simple premises.
Simplicity in trading is what we all strive for. Where possible, we should aim to simplify our strategies rather than complicate them with excessive information—unless the additional inputs add clear, actionable value to the trade thesis. While that holds true in this analysis, for the sake of clarity and simplicity, we’ve chosen not to include volume profile study or levels derived from volume profiling.
Also, don’t forget to check out how our example trade idea in Crude Oil played out —posted earlier this Tuesday.
6B Weekly Time frame:
Key Levels
Weekly Resistance: 1.3400 – 1.3425
Daily Double Top: 1.3425
April 21 Mid: 1.3350
April 2025 Developing Mid: 1.3067
Scenario 1: Break and Continuation
In this scenario, we anticipate further upside in 6B futures and GBPUSD. A break above the double top at 1.3425 could lead to a push toward 1.3550. Look for confirmation across other FX futures and signs of Dollar weakening to support this thesis.
Example Trade Idea 1:
Entry: 1.3425 (wait for an hourly candle to close above the double top, then enter on the pullback)
Stop: 1.3350
Target: 1.3550
Risk: 75 ticks
Reward: 125 ticks
Risk/Reward Ratio: 1.7 R
Scenario 2: Swing Failure on Weekly Timeframe
Zooming out to the weekly timeframe, 1.3425 aligns with a potential swing failure at prior resistance near 1.3423. A pullback from this level could provide a short opportunity. Watch for Dollar strength and pullbacks in 6E and 6J to further support this thesis.
Example Trade Idea 2:
Entry: 1.3350 (wait for sellers to regain control at Monday’s mid)
Stop: 1.3425
Target: 1.3067
Risk: 75 ticks
Reward: 283 ticks
Risk/Reward Ratio: 3.7 R
Important Notes:
These are example trade ideas provided strictly for educational purposes and should not be considered trade recommendations.
Traders are encouraged to perform their own independent analysis and thorough preparation before entering any positions.
Please note: Stop losses are not guaranteed to execute at specified levels. Actual losses may exceed predetermined stop amounts.

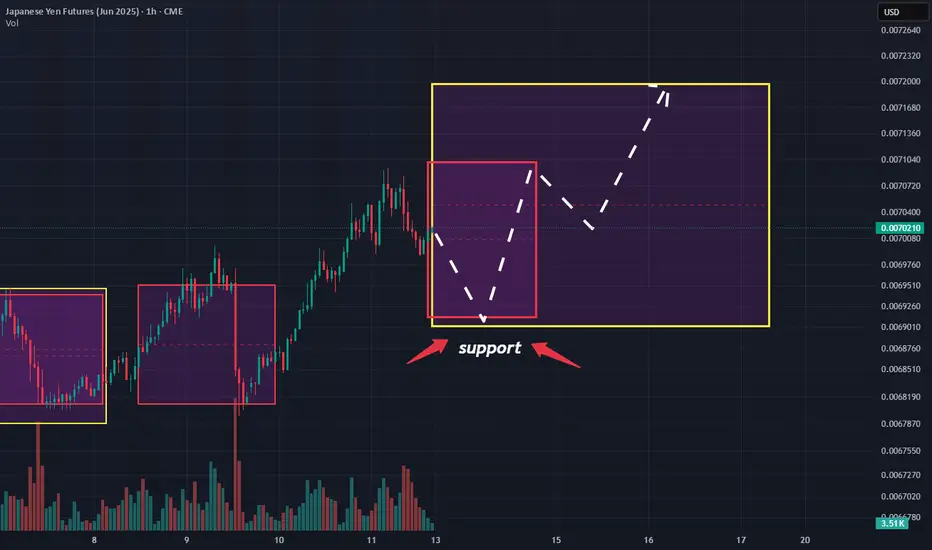
Yen Outlook: Preparing for the Coming Week! During the recent short trading week, we did not observe significant changes in the portfolios of major players. No outflows or overbought conditions—this indicates that the targets remain unchanged, and we are getting closer to the 0.0072 mark. 📊
I recall how, back in mid-December of last year, we noticed the first signs of volume accumulation in the portfolio. It felt like discovering a new horizon! We shared this insight with our subscribers, allowing us to prepare a plan in advance and identify well-founded entry points for the rise of the yen futures. 🚀
Currently, as we maintain a long position on the futures (or a short on the dollar/yen pair), it is essential to keep in mind the boundaries of the expected volatility range.
We have marked these on the chart: the yellow rectangle for Monday and the red rectangle for the upcoming week. 📅
Given the sustained positive sentiment surrounding yen futures, opening a long position as the price approaches the lower boundary of the range could present an excellent opportunity . As indicated by the arrows on the screenshot, don’t miss your chance! 🎯
Summary, we see that the yen continues to be in focus, and we have a clear action plan. We are holding our long position, monitoring the range boundaries, and preparing for the opportunities the market presents. 🌈
No Valuable Data, No Edge!

Current Mechanics playing out in US and Global MarketsCBOT:ZN1!
COMEX:GC1!
CME:6E1!
CME:6J1!
US Bond Market:
The US bond market—specifically US 10-year Notes—has long been considered a safe haven amid market turmoil. Historically, during periods of uncertainty, investors have flocked to these “flight to safety” assets, resulting in increased demand for US 10-year notes. Mortgage rates also tend to track 10-year note yields, meaning rising yields typically imply rising mortgage rates.
From the chart above, we can observe that ZN futures rose by 6.62% from the January 13 lows to the April 7 highs and what the next possible worst case scenario looks like.
Euro FX Futures:
Euro FX futures rebounded strongly from near-parity levels, climbing to a high of 1.15175—a substantial 12.27% increase versus the USD.
Gold:
Gold futures surged 21.84% from the January 6 lows to the April 11 highs.
What caused investors and market participants to abandon the US dollar and US 10-year notes?
As previously explained, broader macroeconomic forces are at play. Investors are not just pricing in a US recession—they're also reacting to an emerging supply-demand imbalance in the US bond markets. This imbalance is driving safety inflows into gold and other alternative assets, while simultaneously pushing yields higher on the long end of the US yield curve. As a result, the yield curve is steepening.
One noteworthy point: when the 10-year to 2-year yield spread falls below zero, a recession typically follows within 12 to 18 months. After a prolonged period of a negative yield spread during 2024, the yield curve has now steepened sharply.
Additionally, a recent 20% correction in US equities adds another layer of complexity to an already fragile economic outlook. Since the onset of the trade war, both uncertainty and volatility have escalated to extreme levels.
With inflation expectations rising and growth forecasts being revised downward, the most compelling asset class to watch in the coming months is the US dollar—and, specifically, the evolving status of the US 10-year T-Note as a risk haven.
Rising yields may point to further steepening of the yield curve and signal a broader shift away from the US as the global economic leader.
What’s truly at stake is the USD’s reserve currency status. How this unfolds remains anyone’s guess.

Quotes Dropping? Here’s How to Find Support & Gain Best DealHave you ever found yourself wondering how to make sense of fluctuating quotes?
What if I told you that the powerful key lies in understanding the power of expected range volatility?
Ready? Let me 5 min to introduce you how understanding expected range volatility can give you the edge you need to succeed.
The expected range volatility (ER) provides a framework for understanding how much the asset could move within a specific timeframe. Statistically, price movements within the expected volatility corridor have a 68% probability, based on CME market data and a Nobel Prize-winning calculation formula. This means that traders can rely on these insights as a powerful filter for making more precise entry points into trades.
Key insight: when the market is quiet, and we approach certain price levels, there’s a 68% chance that the price won’t break through those boundaries.
The ER formula is available on the CME exchange's website, and in just a few minutes, you can input the data to get incredible results. It’s truly amazing!
I remember the first time I stumbled upon the ER tool. It felt like finding a gold mine in the trading world! I was amazed that such a powerful resource was available for free, yet it remained unnoticed by 95% of traders.
At that moment, I began to explore the trading community and was shocked to see how underestimated this tool was. I couldn’t find a single author who utilized such valuable data in their analysis.
But once I began to focus on expected range volatility and the data provided by the CME, everything changed. Since that I never make intraday trades without ER data was checked.
Limitations:
• Market Dynamics: Short-term price movements can be unpredictable due to various factors like market sentiment, news, and economic events. The Expected Range provides a statistical estimate but does not guarantee outcomes.
• Assumptions: The formulas assume that price movements follow a log-normal distribution , which may not hold true in all market conditions.
So, what about you? Do you utilizing the power of expected range volatility in your trading strategy? Share your thoughts in the comments below! And if you want make deeper insights , don’t forget to subscribe us.
In the world of trading, knowledge is power.
No Valuable Data - No Edge!🚀💰