COIN Breakdown Setup Activated — Sellers in Control!🔥 COIN Bearish Heist 🕵️♂️ | Layered Sell Strategy in Play
📊 Asset Overview
COINBASE GLOBAL, INC. (COIN)
📍 NASDAQ Exchange
📈 Instrument Type: US Stock
⏱️ Trading Style: Swing Trade / Day Trade
COIN is currently showing structural weakness after failing to hold key consolidation levels. Price behavior suggests distribution, not accumulation.
🧠 Technical Analysis Breakdown (Detailed)
🔻 Market Structure
Price formed a symmetrical / contracting triangle
Breakout occurred to the downside, confirming bearish intent
Follow-through shows lower highs + weak rebounds
➡️ This indicates sellers are absorbing liquidity on every bounce.
📐 Moving Average Context
Price broke below clustered moving averages
MAs have shifted from support → resistance
Compression + expansion = volatility release
📉 When moving averages fail together, continuation risk increases.
📊 Momentum & Price Action
Bearish candles with long upper wicks
Failed recovery attempts = supply dominance
No strong bullish displacement after the breakdown
➡️ This favors sell-on-rally, not buy-the-dip behavior.
🎯 Trading Plan — Thief Style (Layering Strategy)
Instead of predicting the exact top, this plan uses multiple limit sell orders to build a position gradually as price reacts into resistance zones.
🕵️♂️ Entry Philosophy:
No single “perfect” entry
Scale in calmly
Let price come to you
🔴 Sell Limit Layer Zones (Example)
256.00
250.00
248.00
240.00
📌 These zones align with:
Prior structure resistance
MA rejection areas
Liquidity grab zones
➡️ You may add or reduce layers based on your execution model.
🛑 Risk Management (Expanded)
Reference Stop Loss:
265.00
This level represents:
Triangle invalidation
Failed bearish structure
Strong bullish reclaim zone
⚠️ Important Note to Thief OGs:
This stop is not mandatory.
You control:
Position sizing
Risk per layer
Partial exits or full invalidation
Trade responsibly and within your system.
🎯 Target Logic (Why 220.00?)
Target Zone: 🎯 220.00
This area is supported by:
Major historical demand
Oversold technical conditions
Correction completion zone
Possible bear trap resolution
💨 Execution Style:
Fast profit-taking
No greed
Exit when liquidity is offered
🚨 Escape quickly before volatility reverses.
🔗 Related Symbols to Watch (Correlation Insight)
Watching correlated assets improves timing and confidence:
BITSTAMP:BTCUSD 🟠
↳ Strong correlation with COIN direction and sentiment
BITSTAMP:ETHUSD 🔵
↳ Confirms crypto market risk appetite
IG:NASDAQ 📊
↳ Tech stocks weakness = pressure on COIN
NASDAQ:MSTR 🧠
↳ High-beta crypto equity, often moves first
📌 If BTC + NASDAQ show weakness, COIN downside probability increases.
🧠 Key Execution Rules
✅ Trade the structure, not emotions
✅ Layer entries, don’t chase
✅ Respect invalidation
✅ Take profits quickly at target
✅ Risk management > prediction
✨ “If you find value in my analysis, a 👍 and 🚀 boost is much appreciated — it helps me share more setups with the community!”
📢 Disclaimer:
This is a thief-style trading strategy just for fun.
Educational & entertainment purposes only — not financial advice.
#COIN #Coinbase #NASDAQ #BearishSetup #SwingTrade #DayTrade
#TechnicalAnalysis #LayeredEntry #RiskManagement
#PriceAction #MarketStructure #TradingView
Coinbaseanalysis

Coinbase Completes its Reincorporation From Delaware to Texas Coinbase Global, Inc. (NASDAQ: NASDAQ:COIN ) has completed its reincorporation from Delaware to Texas, effective December 15, 2025. The move is largely administrative and does not change Coinbase’s business operations, management structure, or day-to-day activities. The company confirmed that its Class A common stock will continue trading on Nasdaq under the ticker COIN, with no disruption to shareholders or customers. While certain shareholder rights are now governed under Texas law, Coinbase emphasized continuity across assets, obligations, and strategic direction. The decision reflects a broader trend of corporations reassessing legal domiciles amid evolving regulatory and governance considerations.
From a fundamentals perspective, the reincorporation does not materially impact Coinbase’s revenue streams, balance sheet, or growth outlook. Coinbase remains closely tied to crypto market activity, institutional adoption, and regulatory clarity in the U.S. Any long-term valuation impact will likely depend more on trading volumes, ETF-related flows, and broader digital asset sentiment than on corporate structure changes.
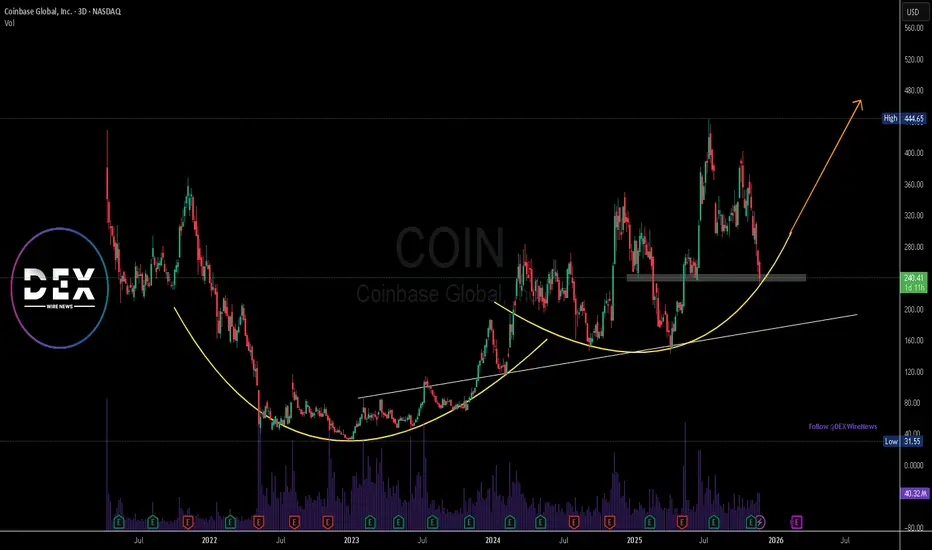
Technically, the chart shows NASDAQ:COIN pulling back sharply from recent highs near the $440 area, entering a corrective phase. Price is now testing a key demand zone around the $250–$260 region, which previously acted as both resistance and support. This area aligns closely with the rising long-term trendline, suggesting a technically important inflection point. Holding above this zone could support a bounce toward the $300–$320 range, while a clean breakdown would expose downside risk toward the low $200s. Momentum indicators have cooled, pointing to consolidation rather than immediate trend continuation.
Overall, NASDAQ:COIN remains structurally bullish on a long-term basis, but short-term price action hinges on whether buyers defend this critical support level.

COIN | 200 SMA Confluence + Bullish Doji = High-Value Setup🎯 COIN: The 200 MA Heist — Dip Buyers Stacking Bags While Others Panic 💼🔥
📊 Asset Intelligence
Coinbase Global Inc (COIN) — NASDAQ
Strategy Classification: Swing/Day Trade Hybrid
Market Bias: Bullish Pullback Confirmation
Risk Profile: Calculated Aggression
🧠 Technical Thesis — Why This Setup Slaps
Listen up, Thief OG's 👀
COIN just pulled back to the 200 Simple Moving Average and did exactly what professional setups do — it respected support and reversed. We got a textbook Heikin Ashi reversal doji candle forming right at the MA, signaling buyer exhaustion turned into buyer dominance.
Translation for the streets: Big money stepped in. Retail panicked. We capitalize.
📈 What We're Seeing:
200 SMA holding like a vault door 🔐
Heikin Ashi doji = indecision flipped to bullish conviction
Volume profile showing accumulation, not distribution
Buyers got the juice to push this higher
This isn't hopium. This is structure meeting momentum at a critical support zone.
💰 The "Thief Strategy" Entry Playbook
We don't chase. We layer. We scale. We steal profits from emotional traders.
Instead of slapping market buy like a degen, we're using layered limit orders to build our position as price moves in our favor. Think of it like planting money traps on the way down.
🎯 Entry Layers (Limit Orders):
Layer 1: $330 💵
Layer 2: $340 💵
Layer 3: $350 💵
Layer 4: $360 💵
You can add more layers if you're feeling spicy 🌶️. The goal is to dollar-cost average into strength, not weakness. Let the market come to YOU.
Pro Tip: Not all layers need to fill. Sometimes you only catch 2-3. That's fine. Better to miss some entry than to get caught in a fake-out.
🛡️ Risk Management — Protect Ya Neck
Stop Loss: $310 🚨
Real talk, Thief OG's: This is MY stop based on MY risk tolerance. You are NOT me. You don't have my account size, my strategy, or my psychology.
Set your own stop based on:
How much you're willing to lose per trade
Your position size
Your personal pain threshold
If COIN breaks below $310, the thesis is invalidated. The 200 MA failed. Buyers lost control. We exit, regroup, and find the next heist. No ego. No revenge trading. Just discipline.
🎯 Target Acquisition — Where We Take the Bag
Primary Target: $430 💎
⚡⚠️ WARNING: Resistance Fortress Ahead
At $430, we're walking into a battlefield:
Historical resistance = sellers have limit orders stacked
Overbought territory = indicators flashing red
Trap zone activated = late buyers will get liquidated here
What smart money does: Lock profits. Don't marry the trade. Don't get greedy.
Potential scenarios:
🟢 Strong momentum? Trail your stop and let winners run
🟡 Consolidation at $420? Take 50-75% off the table
🔴 Rejection at $430? Exit immediately, don't hope
(Thief OG's — again, this is MY target. You might want to exit at $400 for quick profits. You might want to hold for $450. Your rules. Your capital. Your consequences.)
🔗 Correlated Assets — The Bigger Picture
Don't trade COIN blind. Context is king.
Watch These Tickers:
BITSTAMP:BTCUSD & BITSTAMP:ETHUSD
Correlation: STRONG
COIN is basically a leveraged play on crypto sentiment. Bitcoin pumps = COIN pumps harder. Bitcoin dumps = COIN dumps harder. Always check the crypto market before entering.
⛏️ NASDAQ:MARA & NASDAQ:RIOT
Correlation: HIGH
Fellow crypto-exposed stocks. If they're ripping, COIN usually follows. If they're bleeding, stay cautious.
💳 SET:SQ (Block Inc.)
Correlation: MODERATE
Fintech + crypto exposure. Similar institutional money flows. Good confirmation indicator.
💵 TVC:DXY (US Dollar Index)
Correlation: INVERSE
Strong dollar = crypto weakness = COIN weakness
Weak dollar = crypto strength = COIN strength
Simple math. Don't ignore macro.
🔑 Key Insight: If Bitcoin is fighting resistance at $70K while COIN is trying to break out, one of them is lying. Read the room.
📌 Technical Breakdown — The Charts Don't Lie
✅ 200 SMA Support: Holding firm — institutional support level
✅ Heikin Ashi Reversal: Doji + bullish follow-through = momentum shift confirmed
✅ Volume Analysis: Accumulation on dips, not capitulation
✅ Risk/Reward Ratio: Solid if stops are honored and targets are realistic
⚠️ Resistance at $430: Real, tested, and dangerous — respect it
⚠️ Crypto Market Dependency: If BTC drops 10%, COIN drops 15%. Stay alert.
📢 Thief OG Community Rules
Never risk more than you can afford to lose — period.
Position sizing > entry price — manage your risk first, profits second.
Stick to YOUR plan — my plan is mine. Yours is yours.
Take profits — unrealized gains aren't real until you close the trade.
No FOMO, no revenge trades — discipline beats emotion every time.
✨ If you find value in my analysis, a 👍 and 🚀 boost is much appreciated — it helps me share more setups with the community!
#COIN #Coinbase #SwingTrading #DayTrading #ThiefStrategy #CryptoStocks #TechnicalAnalysis #PullbackSetup #HeikinAshi #200MA #NASDAQ #BullishSetup #LayeredEntry #RiskManagement #SmartMoney #PriceAction #TradingView #StockMarket #SwingTrader

Coinbase and Bitcoin Breakout before breakdown In this video I analyse Coinbase and BTC and draw out the idea of the push to the upside although highlighting what levels need to be claimed in order to do so .

COIN Short Trade Setup — Smart Entry Levels Revealed!🎯 COIN "The Crypto Exchange Heist" 💰
Stock Market Profit Playbook for Swing & Day Traders
📈 Analysis Overview 🔍
Asset: NASDAQ:COIN | Coinbase Global Inc. ⚡
Current Price: $295.22 (Nov 7, 2025) 💵
Market Cap: $79.60B 🏆
Trading Volume: Bullish liquidity ✅
Technical Bias: BEARISH CONFIRMED ⬇️
🎲 The Setup: Bearish Hull Moving Average Breakout
We've identified a critical bearish breakdown pattern with Hull Moving Average (HMA) confirmation. The rejection from the $350 resistance zone combined with oversold conditions creates the perfect "HEIST" opportunity for disciplined traders.
Key Technical Signals 🚨:
✅ Hull MA showing downtrend confirmation
✅ Price rejection from upper resistance
✅ Volume compression into breakdown
✅ RSI divergence in overbought territory
✅ Support trap formation at key levels
🎪 ENTRY STRATEGY: The "Layering Heist" Technique 💎
Method: Multiple Limit Order Layers (Position Stacking Strategy)
Instead of chasing ONE entry, we deploy the Thief OG Layering System — multiple entry levels to average down as the bearish thesis develops:
📍 Entry Layers (Top to Bottom):
Layer 1: $340.00 💎
Layer 2: $330.00 💎
Layer 3: $320.00 💎
Layer 4: $310.00 💎
Pro Tip: Feel free to add MORE layers based on your risk tolerance and account size! The more precise your layers, the better your average entry price. 🎯
🛑 Stop Loss Placement (Risk Management Critical)
Thief OG's Recommended SL: $350.00 🚫
This sits above the rejection zone — if price reclaims $350+, the bearish thesis is invalidated, and we exit.
⚠️ DISCLAIMER: This is YOUR trade. We recommend this SL, but YOU control your risk. Adjust based on your position size and risk appetite. No feelings — just math! 📊
🎁 PROFIT TARGET (The "Escape Plan")
Primary Target: $240.00 🎯
Target Type: Strong Support + Oversold Zone + Trap Confirmation
Why $240?
Historical support confluence 📍
RSI reaching oversold extremes 📉
Previous institutional accumulation zone 🏦
Fibonacci 0.618 retracement level ✨
⚠️ CRITICAL NOTE: This is YOUR profit target decision. Once you're in profit, TAKE YOUR MONEY — don't be greedy! Secure gains at comfortable levels. Risk management > Ego. 💪
📊 Correlation Pairs to Watch 🔗
Keep an eye on these related assets for confluence signals:
Bitcoin (BTC)
Price Action: CRYPTOCAP:BTC is COIN's strongest correlation driver
Why?: Crypto market sentiment flows through BTC first → COIN follows
Watch For: BTC breaking $100K could trigger COIN capitulation 📉
Ethereum (ETH) 💠
Price Action: CRYPTOCAP:ETH directional bias impacts institutional flows
Why?: ETH derivative volume is massive on COIN's platform
Watch For: ETH breaking below $3,500 = bearish acceleration ⬇️
Nasdaq 100 (QQQ) 📈
Price Action: NASDAQ:QQQ tech sector health matters
Why?: COIN correlates with tech rallies & risk-off dumps
Watch For: QQQ support breaks = COIN weakness confirmed 🔴
Fear & Greed Index 😨😊
Watch: Extreme Greed (75+) = Potential top | Extreme Fear (25-) = Potential bottom
Why?: COIN is highly sentiment-driven
Action: Lower entries during Fear zones for better risk/reward 🎰
📋 Trade Checklist Before You Enter ✅
Confirm HMA bearish alignment on your timeframe
Check BTC & ETH correlation for confluence
Position size = Max 2-3% portfolio risk per trade
Set alerts at each layer level
NEVER move SL in the red (that's a LOSS, not protection)
Secure profits on the way up (don't wait for PT)
Journal every trade (you learn more from losses)
💡 Pro Trading Tips 🧠
Size Down in Uncertainty — If volume is low, position smaller
Trail Your SL — Once profit doubles, move SL to breakeven
Partial Profits — Take 50% at $280, let the rest run to $240
Never Average-Up — Only add on confirmations going DOWN
Time Your Layers — Don't slam all orders at once; space them out
📢 Join The Community 🚀
✨ If you find value in my analysis, a 👍 and 🚀 boost is much appreciated — it helps me share more setups with the community!
#COIN #Coinbase #CryptoTrading #SwingTrade #DayTrade #TechnicalAnalysis #BearishSetup #TradingStrategy #CryptoExchange #NASDAQ #HullMovingAverage #TradingIdeas #CryptoMarkets #RiskManagement #ProfitPlaybook #ThiefStrategy #EditorPick 🚀✨

Coinbase Global Inc. Expands 24/7 Altcoin Futures TradingCoinbase Global Inc. (NASDAQ: COIN) is expanding its derivatives business with the introduction of 24/7 altcoin futures beginning December 5. The new lineup will include long-dated, perpetual-style futures for Avalanche, Bitcoin Cash, Cardano, Chainlink, Dogecoin, Hedera, Litecoin, Polkadot, Shiba Inu, Stellar, and SUI. This expansion builds on Coinbase’s existing 24/7 markets for Bitcoin, Ethereum, Solana, and XRP, significantly broadening access for traders seeking diverse crypto exposure.
A Major Expansion of Altcoin Futures
The move signals Coinbase’s commitment to meeting rising demand for round-the-clock crypto trading. By extending futures beyond major assets into popular altcoins, Coinbase strengthens its position as a U.S.-regulated venue offering continuous derivatives access. The newly added assets operate under the same structure as existing futures: perpetual-style mechanics with hourly funding and twice-daily settlement to keep contract pricing closely aligned with spot markets.
Unlike traditional perpetual contracts, Coinbase’s U.S. version carries five-year expirations, blending long-term optionality with the flexibility traders expect from perpetual futures. This hybrid approach appeals to institutions and advanced traders who want exposure without rolling short-dated contracts.
Strategic Positioning in a Competitive Market
With global crypto exchanges competing aggressively in derivatives, Coinbase’s move positions it as a key player offering regulated futures across a wide basket of assets. The expanded lineup enhances liquidity, attracts hedging activity, and deepens Coinbase’s ecosystem ahead of growing institutional interest.
Technical Outlook for COIN
COIN recently retraced sharply from its $444 high, falling toward the $240 support zone, where it currently trades. This level is critical: a breakdown could send price toward the ascending trendline near $170, aligning with the previous higher low.
If either support level holds, the broader bullish trend remains intact. A strong rebound may set COIN on track to retest, and potentially reclaim the $444 high, supported by its expanding derivatives business and improving market sentiment.
Coinbase at Support-Cancels $2B BVNK Deal as It Expands GloballyCoinbase has officially terminated its $2 billion plan to acquire the UK-based stablecoin startup BVNK, ending what could have been one of the biggest acquisitions in the stablecoin industry. The decision, reached during the due diligence phase, was reportedly mutual, though neither company disclosed the reasons behind the collapse.
If completed, the deal would have nearly doubled Stripe’s $1.1 billion Bridge buyout, positioning Coinbase as a dominant player in stablecoin infrastructure. Despite the setback, Coinbase remains aggressive in its global expansion. The exchange recently launched Coinbase Business in Singapore, a platform designed to help startups manage crypto payments, transfers, and treasury operations more efficiently.
In another strategic move, Coinbase announced plans to reincorporate from Delaware to Texas, citing a friendlier and more predictable legal climate. Chief Legal Officer Paul Grewal highlighted that Delaware’s recent legal unpredictability prompted the shift, while Texas offers “efficiency and stability” — critical traits for a company navigating evolving crypto regulations.
Technical Outlook
On the charts, COIN is forming a strong cup-and-handle pattern, signaling bullish continuation potential. Price is currently retesting the $300–$310 support zone, previously a key resistance. A successful hold above this range could trigger the next bullish leg, targeting $440–$450. Volume remains steady, suggesting investor confidence in the broader uptrend.
With the U.S. government nearing resolution of its shutdown and rate cuts anticipated in December, improving liquidity conditions could further boost Coinbase’s stock and crypto-related equities.

Coinbase: Progress and DistractionCoinbase initially made progress in line with our primary scenario, moving just below the support level at $291.50 before a notable rebound to the upside. Our primary expectation is that price will soon reverse and head down toward our magenta Target Zone between $255.42 and $173.05, where we anticipate the low of magenta wave will be established. In wave , we then expect the rally to continue past resistance at $444.65, which makes the magenta zone an attractive entry point for long positions. We still see the possibility of gains above the $444.65 resistance occurring earlier than expected. In this 30% likely scenario, we would anticipate an early wave alt. top, meaning the magenta wave alt. would already be complete. In that case, our magenta Target Zone would no longer be relevant.

COIN Bullish Flag: Breakout Above 368 Toward 410–440Coinbase has shifted from corrective to cautiously bullish on the 1D chart. After July’s peak, price based around the $315–$320 area and then broke structure in late September, reclaiming all key moving averages. The latest pullback tagged the MA20 after a rejection at the $390–$400 resistance, while Bollinger Bands, once contracted, are opening up again—often a sign of building energy.
The working structure is a bullish flag: a strong late-September/early-October impulse (flagpole) followed by a tight, slightly downward channel. The primary path is continuation on a break-and-daily close above ~$368 (flag top) with expanding volume. That unlocks a run toward the recent high at $390, then $400, and—on follow-through—an extension toward $410 and the July supply near $430–$440. Short-term support sits near $340 (confluent with the MA60), which has repeatedly caught dips and remains the pivot for the bullish case.
If price loses $340 on a sustained daily close, the idea is invalidated and the door opens for a deeper fade toward the $320 zone/MA120. Until a clean break, expect chop between the MA20 and $368 with momentum reset via MACD cooling.
This is a study, not financial advice. Manage risk and invalidations

Coinbase: Top Is In!We now view the top of blue wave (b) as established. Wave (c) is expected to drive further sell-offs below support at $291.50, ultimately completing magenta wave , specifically within our magenta Target Zone between $255.42 and $173.05. From there, the upward impulse should then continue past resistance at $444.65. On the other hand, we assign a 33% probability to blue wave alt.(b) reaching a higher high; in that scenario, the anticipated declines would be postponed by a detour above resistance at $444.65.

Can COIN's $330 Breakout Reach $380? ~ Tactical Entry Plan📈 COINBASE GLOBAL, INC. (COIN) - Money Heist Plan (Swing/Day Trade) 🕵️♂️
🚨 Ready to execute the ultimate heist on COIN? This Money Heist Plan uses the Thief Strategy, a layered limit order approach to catch the breakout at $330.00 ⚡. Below, I've outlined the setup, technicals, fundamentals, and macro insights to help you navigate this trade like a pro. Set your alarms, plan your escape, and let’s dive into the details! 🔒
🛠️ Trade Setup: The Thief Strategy
The Thief Strategy is a tactical approach using multiple limit order layers to enter the trade post-breakout, maximizing flexibility and precision. Here’s how to execute it:
Asset: COINBASE GLOBAL, INC. (COIN) 💰
Entry Trigger: Breakout above $330.00 ⚡
Set a price alert on TradingView to catch the breakout in real-time! 🔔
Layered Entries (Thief Style): Place multiple buy limit orders to scale in:
$310.00
$315.00
$320.00
$325.00
$330.00
Pro Tip: Adjust layers based on your risk tolerance and strategy. Confirm entries only after the breakout at $330.00! ✅
Stop Loss (SL): Place at $295.00 post-breakout 🛑
Note: Adjust SL based on your risk management. The Thief Strategy is flexible—manage risk at your discretion, dear Traders (Thief OGs)! 😎
Take Profit (TP): Target $380.00 🎯
Resistance and overbought levels signal a potential police barricade 🚔. Escape with profits before the trap! Adjust TP based on your strategy.
Disclaimer: TP is not fixed—take profits at your own risk and preference.
📊 Why This Plan? Technical & Fundamental Breakdown
🔍 Technical Analysis: The Thief’s Blueprint
Breakout Catalyst: COIN is testing the $330.00 resistance. A confirmed breakout signals strong bullish momentum 📈.
Thief Strategy Advantage: Layered entries reduce risk of false breakouts and allow scaling into the move.
Key Levels to Watch:
Support: $295.00 (SL zone)
Resistance/Target: $380.00 (overbought zone)
Setup Confirmation: Use volume spikes and RSI for breakout confirmation. Set TradingView alerts to stay sharp! 🔔
📉 Fundamental & Macro Insights
Market Cap: $81.47B
PE Ratio (TTM): 30.52 (above industry avg., signaling high valuation)
EPS (TTM): $10.39
Revenue Growth (YoY): +12.36% (2025 est.) 💪
Profit Margin: 42.67% 🔥
Cash Reserves: $7.54B (strong balance sheet)
Risks:
Q2 profit drop to $33.2M vs. $294.4M YoY 📉
High P/E (30.71) and Price/Sales (12.61) raise valuation concerns
Macro Drivers:
Genius Act: Boosted crypto optimism 🚀
Crypto Market Trends: Bitcoin’s record highs in July 2025 fuel COIN’s upside potential
😰 Fear & Greed Index
Current Sentiment: Neutral to Greedy (Crypto Fear & Greed Index: 0-100)
Trend: Mixed emotions due to crypto volatility and regulatory developments
Takeaway: Greed supports breakout potential, but stay cautious of volatility spikes.
🧠 Investor Sentiment
Retail Traders: Cautiously optimistic 😊, holding for long-term crypto growth but cautious of short-term volatility.
Institutional Traders: Mixed 🤔—some see overvaluation, others bet on crypto adoption and regulatory clarity.
🐂 Bullish vs. Bearish Outlook
Bullish Score: 60% 🐂
Why? Strong revenue growth (+13.72% YoY est. for 2026), crypto adoption, and institutional interest.
Bearish Risks: 40% 🐻
Why? Profit volatility, high valuation, and crypto market dependence.
Key Watch: Q3 earnings (Sep 2025) and crypto market trends.
💡 Why Trade COIN Now?
Short-Term: Neutral to slightly bearish due to profit concerns, but the $330.00 breakout could spark a quick swing/day trade.
Long-Term: Bullish on COIN’s role in crypto infrastructure and regulatory tailwinds.
Thief Strategy Edge: Layered entries and disciplined risk management make this setup ideal for volatile markets.
🔗 Related Pairs to Watch (USD)
BITSTAMP:BTCUSD : Bitcoin’s momentum drives COIN’s price action.
BITSTAMP:ETHUSD : Ethereum’s performance impacts COIN’s trading volume.
BITSTAMP:XRPUSD : Watch for altcoin rallies tied to regulatory news.
AMEX:SPY : Broader market trends influence COIN’s beta (3.69).
📅 Market Data Snapshot (10 Sep 2025)
Previous Close: $318.78
Day’s Range: $315.88 - $328.67
52-Week Range: $142.58 - $444.65
Avg. Volume: 13.43M shares
✨ “If you find value in my analysis, a 👍 and 🚀 boost is much appreciated — it helps me share more setups with the community!”
#TradingView #COIN #SwingTrading #DayTrading #CryptoTrading #TechnicalAnalysis #ThiefStrategy #MoneyHeist

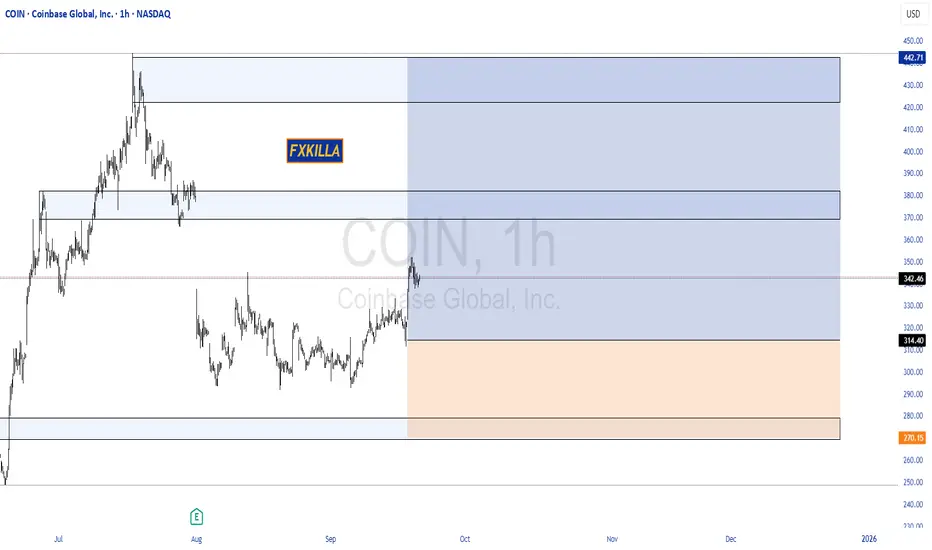
COINBASE HIGH PROBABILITY SETUP SOON!!!🚨 COIN HIGH PROBABILITY BUY SETUP 🚨
* Here We Can See Clearly The Next Potential Move For COIN Coming Hours/Days.
* Keep Your Eyes Close On Your Trading Positions.
* Happy PIP Hunting Traders.
FXKILLA.
Coinbase: Breaking HigherAfter an extended period of sideways trading, Coinbase recently broke noticeably higher, prompting us to add a more detailed substructure for magenta wave . On a smaller scale, we now see prices moving in a blue three-part pattern, with wave (a) recently completed at $291.50—a level we identify as support. In the near term, wave (b) still has some room to move higher before wave (c) ultimately dips back below the $291.50 mark, at which point the previously mentioned magenta wave should be complete—well above the lower support level at $138.45. The following wave is expected to drive the next leg higher, potentially pushing the stock well above $444.65. However, we assign a 33% probability that COIN has completed magenta wave alt. at the $444.65 high and could next fall below the $138.45 support to establish a new low for turquoise wave alt.2 via wave alt. .

COIN HIGH PROBABILITY SETUP SOON!!!🚨 COIN HIGH PROBABILITY BUY SETUP 🚨
* Here We Can See Clearly The Next Potential Move For COIN Coming Hours/Days.
* Keep Your Eyes Close On Your Trading Positions.
* Happy PIP Hunting Traders.
£ FXKILLA £

COIN Don’t Miss Out: eye-catching$330C
# 🚀 COIN Options Alert 🚀
🎯 **Setup**: Long \$330C
💵 **Entry**: \$6.35 | 📈 **Target**: \$9.53 (+50%) | 🛑 **Stop**: \$3.81
📊 **Confidence**: 60% | ⚡ Low VIX + Bullish Flow | ❗ Weak volume risk
💡 **Key Watch Levels**:
* 🔑 \$325 breakout = strong bullish confirmation
* ⚠️ Below \$291 = bearish trigger zone
⏰ Time-sensitive: 4DTE — manage risk, avoid holding into Friday’s close!
---
📌 **Hashtags **:
\#COIN #CryptoStocks #OptionsTrading #WeeklyOptions #TradingSignals #StocksToWatch #OptionsFlow #CallOptions #TradingView #StockMarket #COINbase #OptionsAlerts

Coinbase (COIN) shares fall to a 2-month lowCoinbase (COIN) shares fall to a 2-month low
According to the chart of Coinbase Global (COIN), the stock price of the cryptocurrency exchange is sliding towards the $295 level, a 2-month low.
It is worth recalling that last month we reported that COIN stock had surged to an all-time high around $400. At that time, we:
→ highlighted the long-term grey channel and the short-term blue one;
→ suggested a potential correction from the upper boundary of the grey channel.
Since then, COIN’s share price has declined by more than 20% (yesterday’s drop was fuelled by a broader risk-off sentiment in technology stocks, which we analysed earlier today in the context of the Nasdaq 100 index). If this is indeed a correction from the all-time high, it looks too deep for a bull market. Could COIN shares extend their decline?
Technical analysis of Coinbase (COIN) stock
From a broader perspective, the grey channel remains valid. Following the release of a disappointing earnings report on 1 August, COIN formed a bearish gap and found support near the median of this channel.
Note the price action (highlighted with an arrow) – the bulls attempted to push the price higher but failed. This resembles either a false breakout of the 1 August high or a retest of the gap’s lower boundary – in both cases, a bearish signal. Particularly so given the candlestick with a long upper shadow, forming a gravestone doji pattern.
The MACD indicator suggests “clouds are gathering”: the histogram is approaching zero, while the two lines have turned downward. If the bears manage to build on their advantage, this would imply that:
→ market participants view the psychological $300 level as too high for COIN;
→ the price is moving away from the median of the grey channel and might approach its lower boundary, where buyers typically tend to step in.
If this scenario unfolds, the bears will need to show persistence, given the importance of support at $273.70, where the price rallied strongly in mid-June (a sign of aggressive buying).
It is also worth noting a series of bullish news related to Coinbase (completion of the Deribit exchange acquisition, improved regulatory outlook) – but the stock is already down more than 30% from its record high, which raises concerns.
This article represents the opinion of the Companies operating under the FXOpen brand only. It is not to be construed as an offer, solicitation, or recommendation with respect to products and services provided by the Companies operating under the FXOpen brand, nor is it to be considered financial advice.

Coinbase: Brief Distraction Before Downtrend ContinuesCoinbase has recently experienced a brief uptick but has since resumed its expected downward trajectory. Magenta wave still has some room to push lower in the near term, but it should remain above the support level at $138.45 to allow the upward impulse to eventually break through resistance at $444.65. However, if price falls below $138.45, we will anticipate a new low for turquoise wave alt. 2 , which would delay the expected gains (probability: 33%).

COIN Weekly Options Crunch: Can Bulls Break Through the Trap? 🚀 COIN Weekly Options Heat Check (2025-08-14)
**Sentiment:** ⚖️ *Mixed but leaning bullish*
* **Daily RSI:** Bearish 📉
* **Weekly RSI:** Bullish 📈
* **C/P Ratio:** 1.68 (Bullish flow)
* **Volume:** Weak — limited institutional backing
* **Gamma Risk:** HIGH due to imminent expiry
---
### 📊 **Consensus Snapshot**
✅ *Bullish tilt from options flow*
⚠️ *Conflicting indicators & low volume = caution*
💡 *Tight risk management is critical*
---
### 🎯 **Trade Setup**
* **Type:** Naked CALL (Long)
* **Strike:** \$335.00
* **Expiry:** 2025-08-15
* **Entry Price:** \$0.84
* **Profit Target:** \$1.26 – \$1.68 (+50–100%)
* **Stop Loss:** \$0.50 (≈40% risk)
* **Confidence:** 65%
* **Entry Timing:** At market open
---
💬 *Play the momentum, but respect the stop — expiry is tomorrow.*
📌 *Not financial advice. DYOR.*
---
**#COIN #OptionsTrading #WeeklyAnalysis #StocksToWatch #TradingSignals #OptionsFlow #GammaRisk #DayTrading #StockMarket**

Are you Bullish on Coinbase?Do you think my T1 will get hit? Let me know.
I hope so, since Coinbase is a leading indicator for the crypto market.
But I wouldn't be surprised if it went lower after hitting T1

Are you bullish on Coinbase?Obviously I want Coinbase to do well, becuase it is a leading indicator for the crypto market.
But it's still a chart, like all other charts, that all do the same thing. So let's hope no further downside is necessary.

COIN Gamma Strom Incoming!!!🚀 COIN Weekly Swing Setup (2025-08-09) 🚀
**Bias:** 📈 **Modestly Bullish** — strong call flow + low VIX, but weak volume tempers confidence.
**🎯 Trade Plan**
* **Ticker:** \ NASDAQ:COIN
* **Type:** CALL (LONG)
* **Strike:** \$350.00
* **Entry:** \$0.90 (open)
* **Profit Target:** \$1.70 (+89%)
* **Stop Loss:** \$0.45 (-50%)
* **Expiry:** 2025-08-15
* **Size:** 1 contract
* **Confidence:** 65%
**📊 Key Notes**
* Call/put ratio 2.83 → strong bullish options flow ✅
* RSI mixed but recovering from oversold ⚠️
* VIX low → low gamma risk, favorable for option buyers ✅
* Watch volume closely at open for confirmation 🔍

COIN Gamma Storm Incoming!!!## 🚨 COIN Weekly Options Setup (Aug 7, 2025) 🚨
**Massive Call Flow vs. Bearish Momentum — Who Wins?**
> 🔍 Multiple AI models conflicted. Gamma risk rising. One day to expiry. Here's the trade...
---
### 🧠 Key Model Consensus (Across Grok, Claude, Llama, DeepSeek, Gemini):
✅ **Bullish Options Flow** from institutional players
📉 **Bearish Price Momentum** and RSI
⚠️ **High Gamma Risk** into expiration
🤔 **Signal Divergence** = Uncertainty + Volatility
---
### 🟩 **Bulls’ Case (Grok, Claude, Llama):**
* Oversold conditions + call buying = Rebound Setup
* Volume spike confirms institutional interest
* Moderate bullish lean with upside potential
### 🟥 **Bears’ Case (DeepSeek, Gemini):**
* Price action still weak
* Distribution pressure detected
* Recommending no trade or puts
---
### 📊 Trade Setup Summary
| Parameter | Value |
| -------------------- | ----------------- |
| 🎯 **Strike** | \$322.50 |
| 📅 **Expiry** | 2025-08-08 (1DTE) |
| 📈 **Direction** | CALL (LONG) |
| 💵 **Entry Price** | \$0.96 |
| 🎯 **Profit Target** | \$1.44 |
| 🛑 **Stop Loss** | \$0.57 |
| 📏 **Size** | 2 Contracts |
| 🔁 **Entry Timing** | Market Open |
| 🧪 **Confidence** | 65% (Moderate) |
---
### ⚠️ Risks to Watch:
* 1DTE = High volatility swings ⚡
* Momentum still leaning bearish 📉
* Gamma moves could trigger sharp reversals
---
📌 **Final Take**:
**Trade if you’re aggressive. Sit out if you’re cautious.**
This is a classic high-risk/high-reward setup driven by **options flow vs. price action divergence**.

COIN Don't Miss Out
## 🚨 COIN WEEKLY TRADE IDEA (Aug 4–8)
**Bullish Setup Despite Mixed Signals — \$330 CALL ON WATCH**
---
### 🧠 Model Consensus:
* **📈 Weekly RSI** = bullish recovery potential
* **📉 Daily RSI** = bearish pressure, short-term caution
* **📊 Volume** = Institutional activity spotted
* **🧠 AI Models**:
* **Grok & Claude** = Bullish bias ✅
* **Gemini** = Bearish, sees distribution ❌
* **Meta & DeepSeek** = Neutral, sit-tight ⚖️
🧭 **Net Bias: MODERATE BULLISH** (But choppy daily tape)
---
### 🔍 Trade Setup:
| 🎯 Strike | 🎯 Entry | 🎯 Target | 🛑 Stop | ⏳ Expiry | 🎯 Confidence |
| ---------- | -------- | --------- | ------- | -------- | ------------- |
| \$330 CALL | \$4.00 | \$5.00 | \$2.50 | Aug 8 | 65% ✅ |
📍 **ENTRY TIMING:** At open
📍 **VIX Conditions:** Supportive (low-vol = favor gamma grind)
📍 **Risk Trigger:** Exit on close under \$315 or stop hit
---
### ⚠️ Key Risks:
* Daily RSI → 🟥 still bearish = choppy path
* Sector-wide pressure (crypto news, SEC)
* Negative macro or earnings = fast invalidation
---
### 🔥 Tags:
`#COIN #Coinbase #OptionsTrading #CallOption #BullishBias #GammaSqueeze #AITrade #TradingView #WeeklySetup #MomentumPlay`
