Possible XAUUSD Pre NY moveswe eiter will take byuys side liquidity first which have more chances then winn retarace to the opening gap of today
Commodities

SLV | Next Leg Higher Is Here | LONGiShares Silver Trust seeks to reflect generally the performance of the price of silver. The Trust seeks to reflect such performance before payment of the Trust's expenses and liabilities. It is not actively managed. The Trust does not engage in any activities designed to obtain a profit from, or to ameliorate losses caused by, changes in the price of silver.

EURUSD – H2 Analysis .......EURUSD – H2 Analysis (based on My chart)
Market Structure
Overall bullish trend.
Price is at upper resistance / supply zone (yellow area).
Rejection + long upper wicks → pullback / correction likely.
Trendline + Ichimoku cloud below → correction, not full reversal.
📉 Sell (Correction) Setup
Sell Zone: 1.1755 – 1.1785
🎯 Target Points
Target 1: 1.1680
Target 2: 1.1560 (strong demand & trendline support)
❌ Invalidation
H2 close above 1.1800 → sell setup invalid.
📌 Clean Signal Summary
Pair: EURUSD
Timeframe: H2
Bias: Sell (pullback)
Targets: 1.1680 → 1.1560
After these targets, we can look for a fresh BUY continuation from demand

Gold, Silver Smash Records as End-Of-Year Rally ContinuesGold, silver, and platinum extended a historic end-of-year rally for precious metals, jumping to all-time highs, with spot gold peaking above $4,530 an ounce.
DICK'S Sporting Goods has recently seen its fair value estimate decrease slightly, down from $240.33 to $236.43 per share. This shift comes as the discount rate moves higher, now at 9.45 percent compared to the previous 8.73 percent. This change reflects analysts' increased caution about the company's evolving risk profile.
As the company integrates its acquisition of Foot Locker and issues new guidance, investors should stay tuned to discover how they can stay ahead of shifts in the DICK'S Sporting Goods narrative moving forward.
Technically, TVC:XAU is approaching the $4600 point as momentum peaks as the asset is up 1.41%. The daily price chart depicts a bullish flag pattern with the asset breaking above the 38.2% Fib level.

EUR/USD chart (2H timeframe)...
EUR/USD chart (2H timeframe):
Bias: Bullish (price holding above rising trendline)
Targets:
Target 1: 1.1850 – 1.1860 (near first marked resistance)
Target 2: 1.1950 – 1.1980 (upper resistance / next zone)
Invalidation / Safety:
If price closes below the trendline, bullish view becomes weak.
Conservative SL area: below 1.1720
This is a technical target, not financial advice. Trade with proper risk management.

AUDUSD: medium-term outlook🛠 Technical Analysis: On the 4-hour (H4) timeframe, AUDUSD has enjoyed a strong rally following the "Global bullish signal" identified earlier in December. The price has climbed steadily, supported by the SMA 50 and 100, reaching a major horizontal Resistance zone (0.6710 – 0.6750).
The chart indicates that the price has now "stabilized" at this resistance level. While a short-term upward spike is possible, the primary expectation is a reversal or a period of distribution. The analysis suggests that a short position can be considered either upon a clear rejection signal or as a part of a medium-term accumulation strategy, targeting a move back toward the key Support zone at 0.66191.
———————————————
❗️ Trade Parameters (SELL)
———————————————
➡️ Entry Point: approx. 0.67520
🎯 Take Profit: 0.66191 (Support).
🔴 Stop Loss: approx. 0.68185
⚠️ Disclaimer: This is a potential trade idea based on current chart patterns; market conditions can change rapidly, especially with upcoming central bank news.

Quantum's Gold Trade Plan 12/26/25CSE:GC 📸
🟢 Buyside dominate w/ POC at 4537
🔴 Sellside minimal w/small cluster 4515-4527
📍Premarket 🧲4537 ⚠️ /// 4500↕️ 🐂/🐻 Flip
📈🧲 at All Time Highs???
📉🧲at 4537 - 4531 - 4521/4520 - 4516
💡Strong upside move breaking ATH overnight. As long as buyside is remains dominate would like to pullback to pivot at 4537 or at least imbalance test at 4550 to look for a long entry. Will wait for NY opening range to be established first.

Gold in Final Bullish Wave – Last Push Higher ExpectedGold (XAU/USD 4H) is in a strong bullish trend and is currently moving in the last part of Wave (5). The clear breakout above the previous resistance shows that buyers are in control, and the bullish structure is still valid. As long as the price stays above the main support area, the outlook remains positive, with the next target around 4,580–4,650 , where this upward move is likely to finish. For short-term trades, a sensible stop-loss can be placed below 4,420 , while the bullish view becomes invalid if the price falls below 4,360 . If everything goes as expected, Gold should make one final move higher and then take a normal corrective pullback (A-B-C) after the strong rally.
Stay tuned!
@Money_Dictators
Thank you :)

WTI OIL on its 1D MA50 again. Sell signal.Last week (December 17, see chart below) we gave a strong Buy Signal on WTI Crude Oil (USOIL) after it hit and rebounded on the 8-month Support.
The resulting rally easily hit our $58.50 Target and today the price tests the 1D MA50 (blue trend-line) for the first time since the previous Lower High of the 5-month Channel Down. This is an automatic technical Sell Signal as at the same time the 1D RSI is reversing near its 4-month Resistance Zone.
Our short-term Target is again the $55.20 Support.
---
** Please LIKE 👍, FOLLOW ✅, SHARE 🙌 and COMMENT ✍ if you enjoy this idea! Also share your ideas and charts in the comments section below! This is best way to keep it relevant, support us, keep the content here free and allow the idea to reach as many people as possible. **
---
💸💸💸💸💸💸
👇 👇 👇 👇 👇 👇

GOLD | New ATH Signals Strong Bullish MomentumGOLD | Strong Bullish Momentum in Play
Gold pushed higher and recorded a new all-time high around 4540, and it is now trading above the 4500 level, which keeps bullish pressure intact.
As long as the price holds above 4500, the bullish trend remains active, with upside targets at 4521, followed by 4538 and 4570.
On the downside, a move below the 4500–4490 zone would signal a short-term corrective move toward 4472.
In the near term, gold is expected to consolidate within the 4500–4521 range until a clear 1H or 15M candle close confirms the next breakout direction.
Key Levels
Pivot Line: 4500
Resistance: 4521, 4538, 4570
Support: 4490, 4472, 4460
Bias: Bullish above 4500; corrective below 4490.

XAUUSD: Buyers Defend Structure – Retest 4,520 Resistance AheadHello everyone, here is my breakdown of the current XAUUSD setup.
Market Analysis
Gold is trading within a strong bullish structure after successfully breaking out of a descending triangle and confirming a shift in market control from sellers to buyers. The initial breakout was followed by a consolidation phase, forming a clear range where price moved sideways, indicating accumulation rather than distribution. After this range, XAUUSD resumed its bullish move and broke above the triangle resistance line, confirming continuation of the uptrend.
Currently, price is now trading above a rising trend line, which continues to act as dynamic support. Recently, gold tested the upper Resistance Zone around 4,520, where selling pressure appeared, leading to a short-term pullback. This pullback is unfolding toward the Support Zone near 4,430, which aligns with the prior breakout area and the ascending structure. As long as price remains above this support, the broader bullish trend remains intact and the move lower appears corrective.
My Scenario & Strategy
My primary scenario remains bullish while XAUUSD holds above the 4,430 support zone. I expect buyers to defend this area and push price higher for another attempt toward the 4,520 resistance zone.
Therefore, a clean breakout and acceptance above resistance would confirm bullish continuation and open the way for further upside expansion. However, a decisive breakdown below support would weaken the structure and signal a deeper correction. For now, price action continues to favor buyers as long as the ascending structure holds.
That's the setup I'm tracking. Thank you for your attention, and always manage your risk.

XAUUSD (Gold) 1H Intraday AnalysisXAUUSD (Gold) 1H Intraday Analysis: Weak High Above, Buy-the-Dip Still Favored While 4,495 Holds
Gold is holding a bullish 1H structure after a strong impulse leg (clean BOS sequence) and is now consolidating above the key reclaim zone near 4,495. The current push higher is controlled but not explosive, and the chart is clearly marking a Weak High overhead. That combination often creates a two-step intraday path: either a direct breakout into the weak high, or a liquidity sweep back into support first, then continuation.
Today’s plan is simple: trade around the 4,495 pivot and the 4,455–4,495 demand/supply overlap, using Fibonacci + trendline + EMA/RSI filters to avoid chasing.
Market Structure and Trendline Context (1H)
The rising trendline from the base move remains intact, meaning the higher probability is still pullback → continuation until structure breaks.
Recent price action shows multiple short CHoCHs inside the range (noise), but the market keeps printing higher pricing above the reclaim band, suggesting buyers are defending the midline, not distributing aggressively.
The “Weak High” area remains a liquidity magnet. If price tags it with momentum, expansion can accelerate quickly.
Key Support and Resistance Levels for Today
Resistance (targets and decision points)
4,530 – 4,545: Weak High liquidity (first major upside magnet)
4,560 – 4,575: Expansion zone if breakout candles stay strong
Support (where the best risk-to-reward usually appears)
4,512 – 4,505: Intraday pullback pocket (minor support)
4,500 – 4,495: Reclaim/hold zone (most important pivot on the chart)
4,475 – 4,455: Deeper demand block (purple zone; buy zone if defended)
4,415: Next structural support if the overlap zone fails
4,345 – 4,315: Major demand base (origin of the impulse leg)
4,261: Strong Low (higher-timeframe floor)
Fibonacci Framework (Impulse Low → Recent High)
Using the latest impulse (from the 4,315 base into the current high area), the most tradable retracement cluster typically sits at:
0.236: aligns around the 4,500–4,495 reclaim (shallow pullback)
0.382 – 0.50: aligns into 4,475–4,455 (premium dip-buy area)
0.618: tends to pull price toward the 4,415 shelf if momentum flips bearish
This is why the middle zone matters: if the move is truly trending, the market often respects 0.236–0.50 before attempting new highs.
EMA + RSI Filters (Keep It Mechanical)
Use these as confirmation, not prediction:
Bullish continuation is favored when price holds above EMA50/EMA200 on H1 and RSI stays above 50 on pullbacks.
If price starts closing below EMA50 and RSI slips below 45, expect a deeper retracement toward 4,455 and possibly 4,415.
Intraday Trading Setups (Clean, Repeatable)
Setup A: Pullback Buy from the Reclaim Zone (Conservative)
Entry idea: buy reactions at 4,500–4,495 after a clear hold (wick rejection + strong close)
Invalidation: sustained H1 closes below 4,495
Targets: 4,518 → 4,530–4,545 (Weak High) → 4,560+
Best for: trending days where price respects shallow Fibonacci retracements.
Setup B: Dip Buy from the Overlap Demand (Highest R:R)
Entry zone: 4,475–4,455 (deeper pullback into the marked purple area)
Confirmation: bullish engulf / strong rejection wick + reclaim back above the zone
Invalidation: clean break below 4,455 followed by failed retest
Targets: 4,495 → 4,518 → 4,545
Best for: days where the market “sweeps the low first” before continuation.
Setup C: Breakout Continuation (Only If Candles Expand)
Trigger: breakout and hold above 4,530–4,545 with strong bodies (no immediate long upper-wick rejection)
Entry idea: retest of breakout level as support
Invalidation: back below the breakout band
Targets: 4,560 → 4,575
Avoid chasing if the breakout is thin and RSI is diverging.
Setup D: Breakdown Sell (If 4,495 Fails)
Trigger: H1 close below 4,495, then a retest that fails (bearish continuation)
Targets: 4,475–4,455 first, then 4,415
Invalidation: reclaim back above 4,500
This is the “trend pullback turns into reset” scenario.
What to Watch During the Next Sessions
A clean hold above 4,495 keeps the bullish bias active and increases the probability of a run to the Weak High.
If price looks weak on the push, expect the market to sweep 4,512–4,505 or even dip into 4,475–4,455 before the next leg up.
The real direction usually reveals itself after price reacts at these zones, not in the middle.
Risk Note
This analysis is for educational and technical discussion only, not financial advice. Intraday volatility can spike unexpectedly, so keep risk fixed per trade, wait for confirmation at key levels, and avoid overtrading inside the middle of the range.

gravestone after a strong uptrend gravestone in past week, as long as its below past week high, a shortsell candidate with that stop into consideration.

GOLD - The market may update its ATH after a correction...FX:XAUUSD bounces off 4475 and updates its local maximum in the distribution phase to 4519.4. Against the backdrop of low liquidity associated with the end of the calendar year, movements may be sharp and unpredictable...
The fundamental background remains unchanged, supporting gold: a weak dollar, tense geopolitical situation, mixed data from the US. However, the main problem at the moment is low liquidity due to the holidays.
The Asian market bought up the supply and drove up the price. After such a strong movement, the market may enter a consolidation or correction phase, during which it may test 4508-4500 before rising.
Resistance levels: 4519, 4526, 4550
Support levels: 4508, 4500
A low-liquidity market is easier to manage (in terms of manipulation). Accordingly, use strong setups and short targets for trading, as movements can be sharp and unpredictable.
I expect the bull market to continue after the correction.
Best regards, R. Linda!

XAUUSD: Market Analysis and Strategy for December 26th.Gold prices surged to 4532 before encountering resistance, demonstrating strong bullish sentiment. A significant gain at the close today would likely fuel a continued upward trend next week, with new highs being reached. Moving averages remain in a bullish alignment, Bollinger Bands are trending upwards, and moving average support is shifting upwards. The MACD/KDJ indicators are crossing upwards, indicating ample upward momentum. Support levels to watch today are 4490/4482, while resistance is currently focused on the intraday high around 4532.
On the 1-hour chart, prices are consolidating at high levels, but the current structure still favors the bulls. The slowing upward momentum aligns with recent European session consolidation patterns. Support on the 1-hour chart is around 4496. Trading suggestion for today: Wait for support confirmation and buy on dips.
Trading Strategy:
BUY: 4478~4470
If a rapid pullback occurs, breaking below 4460,
BUY ZONE: 4448~4440
More Analysis →

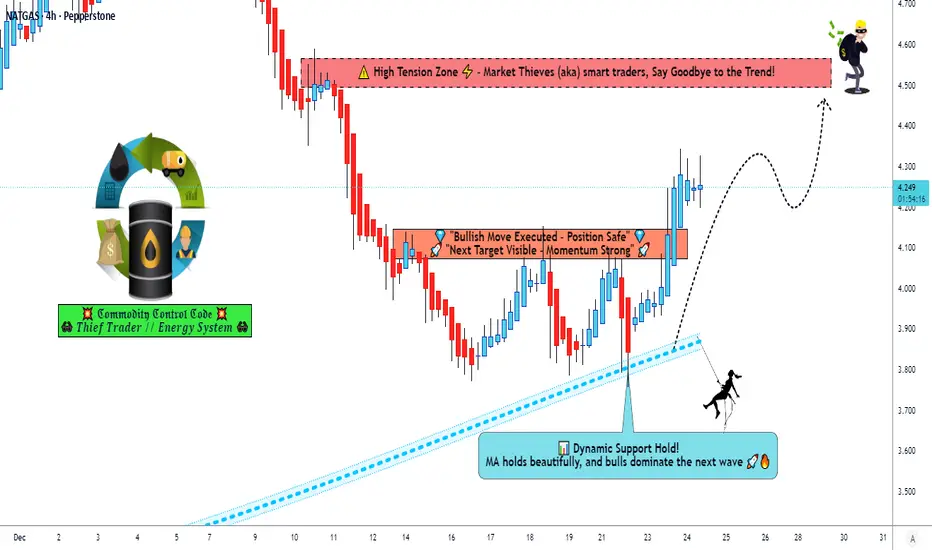
XNG/USD Trade Guide | Bullish Momentum Building🔥 XNG/USD (NATURAL GAS) — Bullish Trade Opportunity | Day / Swing Setup
📌 Asset Overview
Asset: XNG/USD — Natural Gas
Market: Energies | Commodities
Trading Style: Day Trade / Swing Trade
📈 Trade Plan — BULLISH BIAS
🟢 Primary Bias: Bullish continuation
🟢 Market Structure: Demand strength holding above key zones
🟢 Volatility: Expanding (energy markets active)
🎯 Entry Strategy
💡 Entry:
➡️ YOU CAN ANY PRICE LEVEL ENTRY
➡️ Flexible execution based on your own confirmation model
➡️ Suitable for both scalpers & swing traders
🛑 Risk Management
🚨 Stop Loss: 3.900
⚠️ This is thief SL
📝 Risk Note:
Dear Ladies & Gentlemen (Thief OG’s),
I am NOT recommending to follow only my SL.
✔️ Adjust stop loss based on your strategy, risk appetite, and account size.
✔️ Capital protection comes first.
💰 Profit Objective
🎯 Target: 4.500
📊 Target Logic:
Strong resistance zone ahead
Overbought conditions expected near highs
Trap probability increases → book profits & escape smartly
📝 TP Note:
Dear Ladies & Gentlemen (Thief OG’s),
I am NOT recommending to follow only my TP.
✔️ Secure profits based on your plan & market behavior.
🔗 RELATED PAIRS TO WATCH (Correlation Watchlist)
Keep an eye on these $-denominated energy & USD drivers:
🛢️ Energy Correlation
USOIL ( BLACKBULL:WTI ) → Strength supports energy sentiment
UKOIL ( BLACKBULL:BRENT ) → Confirms global energy demand tone
💵 USD Correlation
DXY (U.S. Dollar Index)
🔻 Weak USD = 🔺 Natural Gas supportive
🔺 Strong USD = ⚠️ May slow upside momentum
🏭 Energy Equity Proxy
Energy sector indices / producers
Institutional inflows into energy stocks often align with NG strength
🌍 FUNDAMENTAL & ECONOMIC FACTORS TO CONSIDER
🔥 Natural Gas–Specific Drivers
🌡️ Weather Outlook (US & Europe):
Colder-than-normal forecasts = higher heating demand → bullish NG
🏭 Storage Levels:
Lower-than-average inventories support upside pricing
🚢 LNG Export Demand:
Strong U.S. LNG exports tighten domestic supply
💼 Macro & Economic Factors
🏦 Federal Reserve Policy:
Rate cut expectations → weaker USD → supportive for commodities
📊 US Economic Data (GDP, PMI):
Strong growth = higher industrial energy demand
🌍 Geopolitical Energy Risks:
Supply disruptions amplify volatility & upside spikes
🧠 TRADER’S NOTE
✔️ This setup is directional, not predictive
✔️ Let price action confirm your execution
✔️ Manage risk like a professional, not a gambler
📌 If this analysis helps your trading, support it with a 👍 Like, 💾 Save, and 🗨️ Comment — it helps the idea reach more traders.
Platinum’s Nuclear Breakout Is Loading | The Chart Doesn’t LiePlatinum (XPTUSD) — Long-Term Structural Analysis Integrating Elliott Framework, Institutional Order Flow, and Macro Cycles
Platinum’s multi-decade price behavior continues to display a well-ordered impulsive structure consistent with classical Elliott Wave theory, supported by recurring institutional accumulation patterns and strict adherence to Fibonacci geometry. The asset has progressed through a full secular cycle, characterized by deep corrective retracements into high-probability value zones and expansions that consistently terminate at key Fibonacci extension thresholds—behavior typical of markets driven by institutional liquidity flows rather than retail speculation.
Elliott Structure & Fibonacci Alignment
The historical impulse demonstrates strong proportionality across waves.
The initial secular Wave 1 advanced precisely into the 1.618 extension , confirming a minimum impulse threshold.
Wave 2 retraced cleanly to the 0.618 retracement , an area frequently associated with long-horizon institutional repositioning.
The subsequent Wave 3 extended toward the 2.618 level , consistent with the most statistically probable long-cycle expansion target.
Wave 4 repeated the symmetrical 0.618 retracement , reflecting renewed accumulation in a structurally discounted region .
The current multi-year breakout sequence is consistent with an emerging Wave 5 , with a macro-projection aligning toward the 3.618 extension , a historically validated termination zone for commodities in late-cycle impulsive phases.
Macro Market Structure
Platinum has spent an extended period in re-accumulation following a prolonged distribution phase that began after the prior secular peak. Internal structure has now transitioned from compression to early expansion, evidenced by successive breaks of multi-year structural highs and sustained acceptance above formerly capped liquidity zones. This structural shift suggests the market is transitioning from long-term value consolidation into a new secular markup phase.
Institutional Order Flow & Smart Money Dynamics (ICT/SMC Framework)
Price behavior across multiple cycles reveals consistent liquidity targeting:
Corrective waves repeatedly returned to deep discount regions within the 0.618–0.786 “golden pocket,” an area historically associated with institutional accumulation and mitigation of long-horizon order blocks.
Liquidity sweeps above major multi-year highs followed by sustained displacement signal a structural shift in institutional intent.
Current price action demonstrates displacement from an extended accumulation base, confirming that the dominant flow is now upward, with liquidity pools above the historical consolidation range serving as primary targets.
Price Action Context
The market has decisively exited its multi-year equilibrium, printing higher-high/higher-low structures consistent with early-stage impulsive behavior. Breaks of internal liquidity layers reinforce the expectation of continued expansion toward higher-order liquidity pools, aligning with the projected Wave 5 trajectory.
Fundamental Alignment
Underlying fundamentals - including tight supply dynamics, structural deficits within the PGM basket, and tailwinds tied to hydrogen economy applications - reinforce the technical outlook. The confluence of cyclical tightening, inventory compression, and strategic industrial demand supports a durable long-term appreciation phase.
What do YOU think happens next?
Breakout or fake-out? Drop your prediction below!
👇 We are replying to every comment - let’s talk charts .
Smash the 👍 if this helped, hit 🔔 to catch the next setup,
and FOLLOW for more high-probability wave + SMC plays.
⚠️ Disclaimer
This content is for educational and informational purposes only and does not constitute financial, investment, or trading advice. All analyses reflect personal opinions based on publicly available data and chart structures. Markets involve risk, and you should always perform your own research or consult a licensed financial professional before making any trading decisions. Past performance does not guarantee future results.
#Platinum #XPTUSD #CommodityTrading #Breakout #Wave5 #ElliottWave #SmartMoney #SMC #ICT #PriceAction #ParabolicMove #BullishSetup #MarketCycle #Fibonacci #Metals #Macro #TechnicalAnalysis #ChartAnalysis #TradingSignals #TraderCommunity #Investing

XAUUSD Maintains Support – Buyers Eye $4,560Hello traders! Here’s my technical outlook on XAUUSD (Gold, 2H) based on the current chart structure. Gold continues to trade within a well-defined ascending channel, confirming a sustained bullish market structure. After a prolonged consolidation phase (range) on the left side of the chart, price successfully broke above resistance, signaling a shift in control from sellers to buyers. This breakout marked the beginning of the current impulsive bullish leg. Following the breakout, price accelerated higher and is now approaching the Seller / Resistance Zone around 4,500–4,510, where selling pressure has started to appear. The recent pullback is bringing price back toward the Buyer Zone near 4,430, which aligns with the previous breakout level and the midline/support of the ascending channel. This confluence makes the area a key demand zone to watch. Structurally, the pullback remains corrective, with price still holding above channel support and the broader bullish trend intact. My scenario: as long as Gold holds above the 4,430 Buyer Zone, the bullish structure remains valid. A strong reaction from this area could trigger another push toward the 4,560 (TP1) and potentially higher if a clean breakout occurs. A decisive breakdown below the buyer zone would signal a deeper correction. For now, buyers remain in control while price respects the ascending channel. Please share this idea with your friends and click Boost 🚀

GOLD is bullish now & many Traders don't see it !!!The price on the 4h timeframe is within an ascending triangle, which can be promising. If the price breaks this pattern with bullish candles, it could easily rise by the distance of AB=CD.

XAUUSD - Gold still rising?!Gold is trading above the EMA200 and EMA50 on the 1-hour timeframe and is trading in its medium-term ascending channel. Maintaining the current support level will lead to a continuation of the upward movement of gold towards 4560, while its loss will pave the way for a correction to around 4440.
The release of the **final U.S. economic growth data for the third quarter** once again drew market attention to the growing gap between **strong economic momentum** and **persistent inflation pressures**. The **4.3% GDP growth rate**—the fastest pace in nearly two years—initially paints a robust picture of the U.S. economy. However, a deeper look at the underlying details of the report suggests that **the path of monetary policy in the year ahead is far more complex than headline GDP figures alone might imply**.
The U.S. economy has not only avoided a meaningful downturn, but has continued to maintain momentum, supported by **household consumption** and **targeted investment activity**. What makes this report particularly significant from an analytical perspective is the **coexistence of solid growth with stubborn inflation**, a combination that leaves the Federal Reserve in a difficult position. Under these conditions, the central bank is constrained—unable to confidently pursue further rate cuts, yet also lacking sufficient justification for renewed monetary tightening.
Meanwhile, **consumers remain the backbone of U.S. economic growth**. A **3.5% increase in household spending** indicates that despite a gradual cooling in the labor market and ongoing pressure from higher living costs, a substantial portion of demand—especially in service sectors such as **healthcare and travel**—continues to show notable resilience. For policymakers, this sends a clear signal: **domestic demand has not weakened enough to justify an aggressive easing of interest rates**.
By contrast, **declining spending on durable goods**, including automobiles, points to the early emergence of more cautious behavior among certain income groups. This divergence in consumption patterns is likely to **widen further in 2026**, gradually exposing downside risks to economic growth.
On a separate front, **Donald Trump** outlined his views on monetary policy and the qualities of the next Federal Reserve chair in a post on the “Truth Social” platform. He stated explicitly that **any individual who disagrees with his views would never be appointed as Fed chair**.
Trump also clarified his expectations for the future head of the central bank, saying:
“I want the next Federal Reserve chair to cut interest rates even when the market is performing well.”
He went on to emphasize that he favors a market that **rises on good news and falls on bad news**. Concluding his remarks, Trump expressed an unconventional stance on inflation, arguing that **inflation either resolves itself naturally or can be addressed by raising interest rates if necessary**.
At the same time, American economist **Peter Schiff** reiterated a series of stark warnings, stating that:
* The era of **U.S. dollar dominance is nearing its end**;
* **Gold is becoming the primary reserve asset for central banks**;
* The decline of the dollar could be **more severe than that of other fiat currencies**;
* The U.S. economy is heading toward a **historic collapse**.
According to Schiff, the United States has long benefited from the **“privilege of the dollar’s global reserve status,”** but in his view, **that train is now approaching its final stop**.

XAUUSD/GOLD – 1-Hour Timeframe Tradertilki AnalysisGuys, Gold is approaching the critical level of 4,524, standing at a key decision point. A candle close above this level is the most important condition for confirming bullish momentum.
If the price closes above 4,524, my first target will be 4,555 and the second target will be 4,600.
In this scenario, buyers take control and the market may continue its upward momentum. A potential pullback into the support zone could offer better risk-reward opportunities.
However, the most crucial condition for the continuation of the bullish move is a clear candle close above 4,524.💰
These targets for XAUUSD-Gold remain valid as long as the price does not fall below the 4,424 level. Achieving the targets may take time because this is not scalping, but a swing analysis.❗️
My friends, I share these analyses thanks to each like I receive from you. Your likes increase my motivation and encourage me to support you in this way.🙏✨
Thank you to all my friends who support me with their likes.❤️

XAU/USD | Golf going strong! (READ THE CAPTION)Gold reached a new ATH! I believe all of you are aware of it. Gold went as high as 4497, but faced a little bit of correction and it's being traded at 4488. There are no indications whatsoever for gold to stop going higher. Next targets for Gold: 4500, 4514 and 4532.

As a common idea in gold...!It seems like a common idea that gold has a chance to reach the desired price range on the chart to reach higher targets and start to fluctuate upwards again!?
Or should we wait for certain events in the election of influential people in larger economies or wait for the decision-making of warmongers and warlords who consider the blood of ordinary people as the leach of their impure and worthless life! I recommend watching the movie "Lord of War" for sure.
Good luck
