Silver is about to blast off for 3 weeks! (OPTIONS PLAY INSIDE) Livermore Accumulation Pattern is playing out, low is tomorrow till Wednesday, high will be July expiration to possibly end of July. Please check out my previous threads on AMEX:SILJ and NASDAQ:QQQ to see a repeating fractal that the market has been on since COVID.
Right now buy calls for $35
Key stats
About iShares Silver Trust
Expense ratio
0.50%
Home page
Inception date
Apr 21, 2006
SLV gives investors direct exposure to silver by physically holding the metal in vaults in London. As such, investors get exposure to spot silver (determined by the London Silver Fix), less fund expenses. As this fund is considered a collectible for tax purposes, taxes on long-term gains are quite steep. Still, SLV provides stability for buy-and-hold strategies.
Classification
What's in the fund
Exposure type
Miscellaneous
Bonds, Cash & Other100.00%
Miscellaneous100.00%

SLV - Iron Condor StrategyAfter a big move up, Silver may enter into a long consolidation phase. The Standard Deviation chart indicates volatility continuing to fall being that the Bollinger bands will be moving in towards the moving average. As such, i'm putting in Iron Condor strategy anticipating that SLV prices will r

Opening (IRA): SLV July 26th 25 Monied Covered Call... for a 24.26 debit.
Comments: High IV here at 36.4%. Using the July 26th weekly here for the setup, since this is one of those options highly liquid underlyings with both liquid monthlies and weeklies, and I like to attempt to keep things in that 45 DTE wheelhouse if I can.
Because of the si

Bull Call Silver ETF (SLV) Nov 29/33Bull Call SLV 29/33. with Retrun/Risk of 2.84
Buy 15 Nov'24 Call 29
Sell 15 Nov'24. Call 33
Cost around $1.03, with maximum return of $4

SLV back to 29$This one is quite straightforward, good RRR and keeping my stop tight in case we follow through with the double top. Entry during todays open.

Silver is in short term consolidation before breaking $30It doesn't matter what short term paper contracts do, or taking profits - the East is importing gold and silver at a beguiling rate that won't allow for much shenanigans for the metals market. I was however surprised to see the price bounce exactly off the top of the box.
I see silver going down t

SLV to 33.70Sure does appear to be a typical Wave 3 extension formation. 2.618 fib measurement of Wave 1 would put SLV at 33.70

Next leg down to ~$26 on SLV ETFAfter Elliot 12345 up move, we are completing first ABC
Possible down move to 26 in new trend after distribution

$2.63 Mil on Silver?!Silver 5/22/2024 Exp
Silver has been on a surge so far this month, rising 20.54% from the beginning of May. This previous friday an option order totalling $2.63 Mil came in for AMEX:SLV targeting the $28 strike expiring on 5/22. The problem with this order is it is way too enormous for the ticke

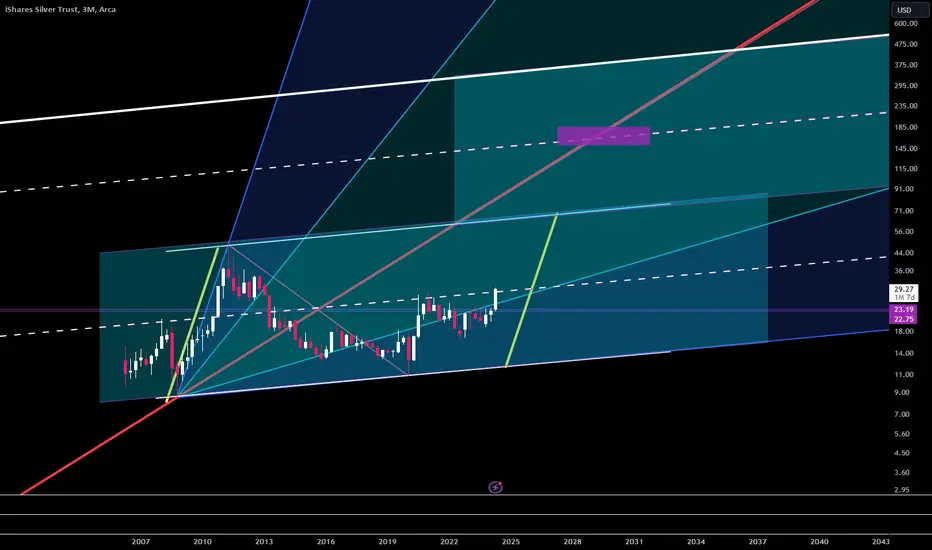
silver slv update on AMEX:SLV #slv #silver we are looking at a key 3-month resistance being tested, to continue to the upside. slv
See all ideas