XAUUSD H4 Buy Limit | Trend Continuation Setup📊 XAUUSD Technical Analysis (H4)
Price is moving within an ascending structure and continues to respect the bullish trendline.
After a healthy pullback into the demand zone, a continuation to the upside is expected.
🔹 Entry Zone: Buy Limit at 4258 – 4216
❌ Stop Loss: Two H4 candle closes below 4196
✅ Target: 4353
📌 Once the buy limit is activated, partial risk management will be applied.
After price reaches 4290, the position will be secured by moving to break-even (risk-free).
⚠️ Always manage your risk properly.
Wishing you success and victory,🧿❤️✌️
FXG Team Management” 🏅
Commodities

USD/JPY | Next targets ahead! (READ THE CAPTION)By analysing the 2H chart of USDJPY, we can see that after reaching the FVG zone at 156.484-156822 twice, and sweeping the BuySide Liquidity above 156.545 level, it has dropped in price all the way to 155.856 and it is currently being traded at 155.930.
For the time being, USDPJY Bullish Targets are: 156.140, 156.43, 156.730 and 157.000.
And the bearish targets are: 155.550, 155.260 and 154.970.

GOLD: Break Below Crucial Zones, What to Consider.Hello There,
an important chart on the gold price recently caught my attention. There is a crucial underlying dynamic that pushed gold below dangerous levels. Especially the drop below the uptrend line has been a key sign of massive bearishness entering. This also confirmed a trade on the short side. Currently there are many signs that gold will continue in the bearish direction.
As seen in my chart, the gold price just dropped below this crucial uptrend line. Also, the drop below the 100-MA was a clear sign of the overall bearishness for gold taking over. Now, gold is likely to form the next bear flag in the range. With a pullback from the short entry zone as seen in my chart, the trade entry on the short side will be confirmed.
Trade on the Short-Side Setup
ENTRY: 4350 - 4380
MINIMUM TARGET: 4180
EXTENDED TARGET: 4060
MINIMUM STOP LOSS: 4490
The next times will be extremely crucial for the overall gold price. Especially when there is a massive pullback from the named zone, this will be a determined setup for the next bearish pressure to set up. With an acceleration of bearishness, the main target zones are likely to be reached. Beyond this level, a continuation of bearish pressure should also not be underestimated.
In this manner, thank you very much for watching. Have a great New Year's Eve!

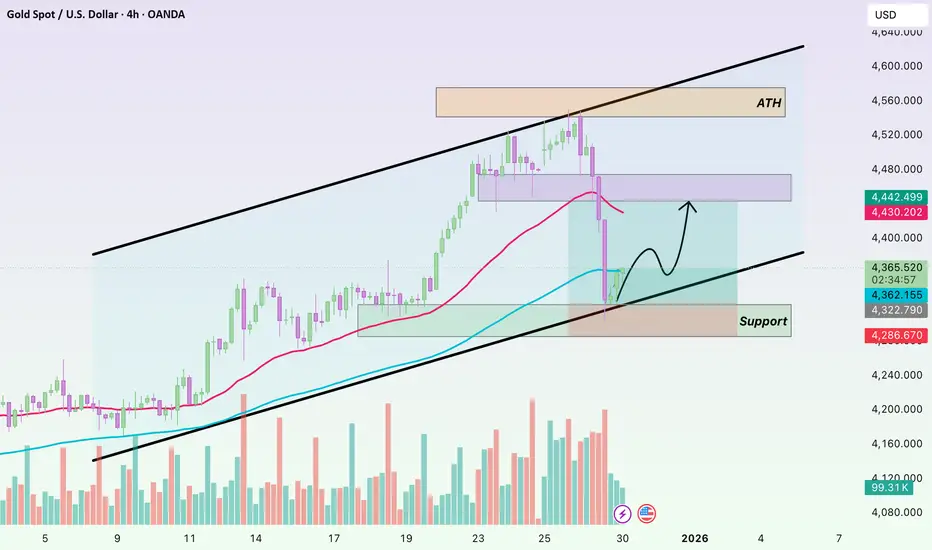
London Sell Off, New York Bullish SetupGold followed a bullish trendline and delivered a strong upside move, reaching the 4550 (ATH area), which acted as a major resistance zone.
After rejection from this level, strong bearish momentum appeared during the London session, resulting in a clear break of the bullish trendline.
Following the London session sell-off, price formed a strong support at 4302.
During the New York session, the market moved into consolidation, indicating preparation for the next impulse move.
Trade Plan (Buy on Pullback)
Entry: 4340
Target 1: 4407
Target 2: 4477
Stop Loss: Below 4302 (H1 close)
Bias
Bullish continuation expected after the pullback, once New York session momentum is confirmed
Based on my analysis, will the market reverse at the entry level? Please let me know in the comment section.

XAUUSD Sell Setup | Gold Rejects Key ResistanceGold is trading below a key resistance zone and showing clear bearish price action. As long as price remains under this level, selling pressure is expected to continue toward lower liquidity areas. Risk is well defined with invalidation above resistance.

Aussie Bull Run: Why AUD Futures Are the 2026 Trade to WatchThe March 2026 Australian dollar (A6H26) futures have emerged as a premier opportunity for currency traders. As of late December 2025, prices have surged to new contract highs, supported by a perfect storm of technical and fundamental catalysts. For the modern trader, the "Aussie" is no longer just a proxy for copper; it is a sophisticated bet on global technology and fiscal shifts.
Technical Mastery and MACD Momentum
The daily bar chart for A6H26 reveals a textbook bullish trend. Prices recently breached key resistance, establishing a solid floor for further appreciation. Technical analysts point to the Moving Average Convergence Divergence (MACD) , which remains in a strong posture. The MACD line sits comfortably above the signal line, with both trending higher.
The path of least resistance is clearly upward. A sustained move above the. 6729 contract high activates a buy signal for many institutional desks. Traders are now eyeing a primary price objective of 6950 . To manage risk, professional stops are typically placed just below support 6625 , ensuring a disciplined approach to this high-conviction setup.
Macroeconomics: The Fed’s Dovish Pivot
A primary driver for the Australian dollar's strength is the diverging path of global central banks. The U.S. Federal Reserve has transitioned toward a more accommodative stance to support labor markets. Lower U.S. interest rates naturally weigh on the Greenback, making high-yielding currencies like the AUD more attractive to international carry traders.
Conversely, the Reserve Bank of Australia (RBA) maintains a hawkish bias. Persistent domestic inflation and a resilient job market have forced Australian policymakers to keep rates elevated. This widening interest rate differential acts as a powerful magnet for global capital, fueling the "long Aussie" trade into 2026.
Geostrategy: Powering the AI Revolution
Australia’s geostrategy has shifted from traditional mining to securing the "Green and Digital" transition. The nation is a critical supplier of lithium, copper, and rare earths , the literal building blocks of AI data centers and renewable energy. As global demand for computing power explodes, Australia’s trade balance benefits from a structural "AI premium."
Furthermore, the Australian government is aggressively implementing blockchain-based supply chain tech . These innovations reduce friction at the border and enhance the security of resource exports. By leading in "High-Tech Mining," Australia ensures its currency remains a vital asset in the global technological race.
Professional Note: Success in AUD futures requires monitoring both the RBA’s tone and China’s industrial demand. While the technicals suggest a move to .6950, stay alert for any sudden shifts in global risk appetite that could spark short-term volatility.

AUD/USD | Going back up? (READ THE CAPTION)As you can see in the 4H chart of AUDUSD, it has reacted to the high of the FVG at 0.66758 and has rebounced and now is being traded at 0.66826. Should it go higher, I expect a reaction to the low of the Bearish OB at 0.67022.
Current Bullish targets for AUDUSD: 0.66960, 0.67120 and 0.67270.
Bearish Targets: 0.66640, 0.66490 and 0.66330.

XAUUSD Short: Trend Line Break Signals Downside ContinuationHello traders! Here’s a clear technical breakdown of XAUUSD (3H) based on the current chart structure. Gold previously traded inside a well-defined range, indicating a phase of accumulation before buyers gained control. From this range, price broke out to the upside and followed a rising trend line, confirming a strong bullish impulse and a clear shift in market structure. The trend remained intact as price continued to form higher highs and higher lows.
Currently, gold is trading below the broken trend line and moving toward the Demand Zone near 4,320, which aligns with a previous breakout area and an important horizontal reaction level. Below this area lies the next Demand Zone around 4,270, which represents the next key downside target if selling pressure continues. The move lower appears impulsive, suggesting that the market is entering a corrective or reversal phase rather than a simple pullback.
My scenario: as long as XAUUSD remains below the Supply Zone and stays under the broken trend line, the bias favors sellers. I expect continuation to the downside toward the 4,320 Demand Zone, with a possible extension to 4,270 if bearish momentum remains strong. A strong bullish reaction from demand could lead to short-term consolidation, but without reclaiming the trend line, any upside remains corrective. Manage your risk!

XAUUSD Intraday OutlookXAUUSD Intraday Outlook (1H): Range Reclaim After the Dump, Eyes on 4,365 Then 4,485
Gold (XAUUSD) is trading back inside a large 1H range after a sharp selloff from the 4,52x supply. The key intraday read from the chart is simple: price is attempting to rebuild a base inside the green demand/range zone, and the next directional move will likely be defined by whether bulls can reclaim and hold above the 4,365 range ceiling.
With year-end liquidity often thinner, expect sharper wicks around the edges of the range. Trade the levels, not the noise.
Market Structure and Price Behavior (1H)
A strong impulsive drop broke the previous bullish sequence, creating a new short-term bearish leg.
Price then returned into the prior range/demand (large green box), showing acceptance rather than immediate continuation lower.
The recent low printed near the bottom of the range and snapped back quickly, suggesting buy-side defense is active.
Current bias is “range-to-reclaim”: bullish intraday as long as price holds above the lower band, but still capped until 4,365 is reclaimed.
Key Support and Resistance Levels (High Priority)
Support Zones
4,318–4,300: intraday decision area (current acceptance zone).
4,295: first support shelf; repeated reaction level.
4,270–4,265: range floor and main invalidation for longs (break and hold below shifts bias back to sell continuation).
4,240–4,216: deeper support if the floor fails (only relevant if 4,265 breaks clean).
Resistance Zones
4,355–4,365: range ceiling and the most important intraday trigger level.
4,405: mid resistance on the way up (often a pause/partial TP zone).
4,445: pre-supply reaction level.
4,475–4,485: major supply zone (green band above); primary upside target if 4,365 breaks and holds.
4,525–4,560: higher-timeframe supply zone (top green band); only in play if momentum is strong.
Fibonacci Map (Using the Selloff Swing High to Swing Low)
From the visible drop (high around 4,52x to low around 4,27x), the most useful retracement cluster for intraday is:
Fib 0.382: around 4,36x (lines up with range ceiling 4,365)
Fib 0.50: around 4,39x–4,40x (lines up with 4,405 region)
Fib 0.618: around 4,42x–4,43x (reaction zone before the 4,445–4,485 supply)
This confluence is why 4,365 is the key “go/no-go” level for bullish continuation.
EMA and RSI Read (How to Use Them Today)
EMA (Practical Use Intraday)
If price is below EMA50/EMA200 on 1H, rallies into 4,355–4,405 can still be sold unless price shows strong closes above the EMAs.
The clean bullish confirmation is: reclaim 4,365 + hold above EMA50, then use EMA20 as a dynamic support on pullbacks.
If price keeps closing back under EMA20 after touching 4,355–4,365, that is a sign the range top is still rejecting.
RSI (Confirmation, Not a Signal Alone)
RSI recovering back toward 50 supports the “base-build” idea.
Bullish continuation is favored if RSI holds above 50 during pullbacks after a 4,365 breakout.
Rejection setups are higher probability if RSI fails under 50 at the range top and prints bearish divergence near 4,365.
Intraday Trade Plans (Clear Conditions, Clean Invalidation)
Plan A: Buy the Dip Inside Demand (Best RR if You Get the Pullback)
Entry idea: 4,318–4,300 (or deeper 4,295 if a sweep happens)
Stop-loss: below 4,265 (range floor break)
Targets:
TP1: 4,355–4,365
TP2: 4,405
TP3: 4,445
Management: reduce risk into 4,355–4,365 because it is the major decision ceiling.
Plan B: Breakout Buy Above 4,365 (Momentum Confirmation)
Trigger: 1H close above 4,365 with follow-through, then a retest that holds (no immediate reclaim failure)
Stop-loss: below the retest swing low (or below 4,345 for tighter structure-based risk)
Targets:
TP1: 4,405
TP2: 4,445
TP3: 4,475–4,485 supply zone
Note: A breakout without a hold usually turns into a bull trap. Wait for acceptance.
Plan C: Sell Rejection at Range Top (If 4,365 Keeps Failing)
Trigger: rejection wicks + weak closes under 4,355, ideally with RSI failing under 50
Stop-loss: above rejection high (above 4,380 is a clean buffer)
Targets:
TP1: 4,318
TP2: 4,295
TP3: 4,270–4,265
Plan D: Sell at 4,485 Supply (If Price Reaches the Green Band)
Trigger: first touch reaction is common; confirm with 1H failure to close above supply
Stop-loss: above 4,505 (or above the supply high)
Targets:
TP1: 4,445
TP2: 4,405
TP3: 4,365
What to Watch During the Session
If price holds above 4,295 and keeps building higher lows, the market is preparing for a 4,365 break.
A clean reclaim and hold above 4,365 increases the probability of a push into 4,405 then 4,445.
The first major upside objective remains 4,475–4,485 supply; expect reaction there.
A breakdown and acceptance below 4,265 invalidates the bullish reclaim thesis and opens the door to 4,240–4,216.
Risk Note
This is a technical analysis view for trading and education, not financial advice. Intraday volatility can spike, especially around range edges and thin liquidity periods. Keep risk fixed per trade and avoid overtrading the middle of the range.
If you found these levels and trade plans useful, follow and save this idea to get more session-based XAUUSD strategies.

XAUUSD: Bullish Trend Remains Intact in Rising ChannelHello everyone, here is my breakdown of the current XAUUSD (Gold) setup.
Market Analysis
Gold has confirmed a bullish shift after breaking out of a prior triangle structure, where price was previously compressed between descending resistance and ascending support. This breakout marked a clear change in market structure and initiated a strong impulsive move higher. After the breakout, price transitioned into a consolidation range, indicating temporary balance before continuation.
Currently, XAUUSD established a clear upward channel, respecting both the lower channel support and the ascending trend line. This structure confirms sustained bullish momentum with higher highs and higher lows. Price has continued to trend higher and recently pushed into a key Resistance Zone, where the market is currently showing signs of reaction and testing supply. Below current price, the former resistance has flipped into a well-defined Support Zone, which aligns with the prior breakout level and the lower boundary of the upward channel. This area has already shown buyer response, reinforcing its importance as a demand zone within the bullish structure.
My Scenario & Strategy
My primary scenario remains bullish as long as XAUUSD holds above the Support Zone and respects the upward channel structure. I expect buyers to defend this area and attempt another push toward the Resistance Zone. A successful breakout and acceptance above resistance would confirm continuation of the bullish trend and open the path toward higher targets.
However, a strong rejection at resistance followed by a breakdown below the support zone would weaken the bullish structure and suggest a deeper correction or consolidation. For now, price action continues to favor buyers while the ascending structure remains intact.
That’s the setup I’m tracking. Thank you for your attention, and always manage your risk.

Why Did XAUUSD Drop Sharply in the Latest Session?I don’t see this decline as abnormal. It is more the result of several factors aligning at the same time.
First, large-scale profit taking. Since the beginning of 2025, gold has gained more than 70%. As price approached the 4.55x area — a very strong psychological level — institutional money began locking in profits. Funds often distribute positions in a concentrated manner to optimize liquidity, which is why price dropped quickly instead of correcting gradually.
Second, the short-term macro backdrop has turned less supportive. The USD has seen a technical rebound, while US Treasury yields remain elevated around 4.1%, increasing the opportunity cost of holding gold. That alone is enough to create pressure when price is already in an overbought state.
Third, thin year-end liquidity. During the December 30–31 period, many funds have already closed their books. In such conditions, a single large sell order can push price much further than usual, making the move appear more aggressive than it actually is.
Finally, technical factors played a role. Price closed below the fast EMA, broke the short-term balance zone, and triggered stop-losses from trend-following long positions. This created a cascading sell effect that quickly dragged price down toward the 4.33x area.
The key takeaway: the larger structure remains intact. Price is still holding above the slower EMA and has not broken the H4 swing low around 4.28x–4.30x. Therefore, this move should be seen as a sharp correction within an uptrend, not a trend reversal signal.
Welcome 2026 — A New Year for Better TradesHappy New Year 2026, Traders.
2025 has been a year that truly tested every trader strong volatility, constant macro shifts, and markets that rewarded discipline while punishing emotional decisions. This year reminded us that profitability does not come from being right once, but from managing risk correctly over hundreds of trades. There were winning trades that built confidence, and losing trades that reinforced an essential truth: the market is always right, and our job is to adapt.
As we step into 2026, I wish every trader a strong and stable mindset. Trade with a plan, respect your stop-loss without hesitation, and never let emotions override structure. May you stay calm during sudden spikes, remain disciplined during winning streaks, and trust your system during drawdowns. Consistent profits are the result of patience and execution not speed or prediction.
May 2026 be a year of clean trading: fewer impulsive trades, less FOMO, more high-quality setups, and a steadily rising equity curve over time. Wishing you good health, mental clarity, and continuous growth as a trader. Happy New Year 2026.

SILVER'S PRICE WITHIN BUYERS' LEVELSilver has declined to the buyers' level...
N.B!
- XAGUSD price might not follow the drawn lines . Actual price movements may likely differ from the forecast.
- Let emotions and sentiments work for you
- ALWAYS Use Proper Risk Management In Your Trades
#silver
#xagusd

Gold Drops More Than 200 USDAt the close of trading on December 29, gold plunged 201 USD to 4,331 USD. In the following session on December 30, prices edged slightly higher to around 4,350 USD.
The precious metal had set a new peak late last week at 4,548 USD, but the rally was quickly reversed. This move is largely attributed to aggressive profit-taking and year-end liquidation by short-term futures traders.
So far, although gold has shown some short-term volatility on the chart, the magnitude remains manageable. However, strong selling pressure may persist today and tomorrow, potentially leading to more significant price swings—especially if the current price channel is decisively broken.
If gold rebounds sharply in the coming days, today’s low could become the latest reaction low within the broader uptrend. In other words, price action over the next two sessions will be critical in determining gold’s direction in the weeks ahead.
From a technical standpoint, the next upside objective for February gold futures bulls is a break above the strong resistance at the record high of 4,548 USD. On the downside, bears are aiming to push prices below the key technical support at 4,200 USD.
What’s your view on where XAUUSD is heading next? Share your thoughts in the comments.

Silver Shorting IdeaSilver going to fall like it has done before. Idea shared as Text on the chart itself.
Shorting Idea.

XAUUSD: bullish exhaustion🛠 Technical Analysis: On the 4-hour (H4) timeframe, Gold (XAUUSD) has encountered significant selling pressure after testing the major psychological and technical resistance zone between 4,520 and 4,550. While the pair previously maintained a "Global bullish signal" throughout December, the current price action indicates a structural shift.
The price has decisively broken below the steep diagonal resistance line that guided the recent impulse move higher. Currently, Gold is trading at 4,370, struggling to hold above its immediate support level. Further price pressure on support will lead to a breakout, a scenario that should be expected after the New Year holidays.
———————————————
❗️ Trade Parameters (SELL)
———————————————
➡️ Entry Point: Sell on breakdown of current support (approx. 4,336.58)
🎯 Take Profit: 4224.40 (Support)
🔴 Stop Loss: 4,411.82
⚠️ Disclaimer: This is a potential trade idea based on current analysis; market conditions and price direction are subject to change based on news factors and volatility.

(GOLD)I SEE ONLY RED AFTER THISGuys Hope You all Doing well
Today i believe this Resistance will help price
to reach to our Daily Goals this is one of the Resistance
must be Claimed Before reach Down to the target All levels
that i mark are technically very calculated or precise .

COPPER IS PRIMED AND READYSo this decade precious metals have finally shown volatility. Gold and Silver have been a highlight especially with the past Administration boasting EV, GREEN-NEW DEAL, and now with AI; Precious metals are showing that people as of right now prefer a physical safe haven asset rather than “code” like cryptocurrency. Even now with the Trump administration, space exploration and the ongoing need and increasing demand for more precious metals is obviously making these assets worth looking at BUT one metal that stands out the most but no one is talking about, is COPPER (CU)!
COPPER is by far primed and ready to show what its really made of. Often overlooked, with pennies being disclosed as being “worthless,” it takes more to produce 1 penny than what its actual value is, with only 2-4% of modern day pennies being made of Copper (CU) and 96%+ being zinc and other over supplied metals. Why?
By 2026 the US Government will stop printing pennies, and any 1 cents transactions will now be rounded to the nearest Nickel.
Gold and Silver showed similar chart patterns, and experienced almost the same innovations that lead to its increase demand thus leading to price being bullish as well. One thing that leads me to believe COPPER IS VERY UNDERVALUED is the FACT that silver mining and gold mining can be done by basically any individual with an increased appetite to fund a business venture of 1mil+, and in this day and age thats more common than you think. But copper mining takes at least 10times more money, and it takes at least 15 years to get a Copper Mine up and ready before you start to dig your first ore. With that being said, and the fact that most copper mines if not all of them up to unow, are starting to show depletion…. its TIME.
Technical analysis is easy here, basic trend and resistance/support and price action on the monthly outlook. This asset will be like when your daddy or great granddaddy bought gold cheap!

Happy New Year 2026 — Trade Smart, Stay Disciplinedwe step into 2026, may clarity replace noise, patience replace haste, and execution replace hesitation.
May every trade be planned, every risk calculated, and every loss treated as tuition—not failure. Wishing all traders a year of emotional control, consistent decision-making, and an equity curve that trends steadily upward.
Happy New Year 2026 — trade smart, manage risk, and let probabilities work in your favor.

Gold After the Flush — Stabilization, Not ReversalOn the 1H timeframe, Gold (XAU/USD) has just completed a sharp impulsive sell-off, breaking the prior short-term structure and accelerating downside momentum. The decline was fast and vertical, suggesting liquidity-driven selling rather than a controlled trend transition. This type of move typically exhausts sellers in the short term but does not automatically signal a trend reversal.
After the sell-off, price is now stabilizing above a clearly defined support zone around 4,300–4,320. The current candles show smaller bodies and overlapping ranges, indicating that bearish momentum has slowed. However, this behavior should be interpreted as temporary absorption, not confirmation of bullish control. Structurally, the market remains below the descending trendline that guided the sell-off.
From a price action perspective, the rebound from support is corrective in nature. The market is forming a sequence of short-term higher lows, but these are developing inside a broader bearish leg, not as part of a confirmed trend change. Until price reclaims and holds above the prior breakdown area near 4,380–4,400, upside moves should be treated as pullbacks rather than trend continuation.
In terms of market context, this type of reaction is typical after a high-volatility flush, especially ahead of low-liquidity periods and year-end positioning. With no immediate macro catalyst forcing aggressive dollar weakness, gold lacks the conditions for a clean upside expansion at this stage. As a result, price is likely to rotate between support and the first supply reaction zone before the next directional decision.
In summary, gold is currently in a post-selloff consolidation phase. The support zone is holding for now, but the broader structure remains vulnerable. A sustained recovery would require acceptance back above key resistance levels, while failure to build continuation could expose price to another test of support or a deeper retracement. Patience and level-based execution remain critical in this environment.

Gold at a Crossroad: Correction Phase Still in ControlHello Traders,
OANDA:XAUUSD is currently trading in a critical transition zone following a sharp rejection from the all-time high (ATH) near 4,550. The sell-off from this level was impulsive and decisive, indicating strong profit-taking and distribution at premium prices. However, the subsequent price action shows stabilization rather than continuation, suggesting the market has entered a rebalancing phase after extreme volatility.
From a market structure perspective, the breakdown below the former support zone around 4,430–4,450 marked a short-term structural shift. This zone now acts as a key resistance, where prior demand has turned into supply. Price is currently trading below this level, confirming that the market has not yet regained bullish control. At the same time, sellers have failed to extend price significantly lower after the initial breakdown, which limits immediate downside momentum.
The rebound from the 4,300–4,320 support zone is technically significant. This area aligns with a higher-timeframe demand zone where buying interest has previously emerged. The reaction here shows that buyers are still active at discounted prices, but the recovery remains corrective in nature, characterized by overlapping candles and measured upside moves rather than impulsive expansion.
Dynamic indicators support this neutral view. Price remains below the 34 EMA and 89 EMA, both of which are flattening after a prior bullish slope. This behavior typically reflects a loss of directional momentum and the development of a range. A sustained move above these moving averages would be required to shift momentum back to the upside, while rejection below them would reinforce resistance.
From a macro standpoint, gold is currently influenced by mixed drivers. U.S. Treasury yields have stabilized after recent volatility, while the U.S. dollar is holding firm but not accelerating. This macro balance reduces the probability of an immediate directional breakout and instead supports range-bound price behavior, especially as markets approach year-end liquidity conditions.
In conclusion, gold is not confirming a bullish continuation, nor signaling a bearish expansion at this stage. The market is trading between defined support at 4,300–4,320 and resistance at 4,430–4,450, with ATH supply overhead near 4,550. Until price either reclaims resistance with strong acceptance or breaks support with follow-through, gold remains in a neutral, level-driven environment, where discipline, confirmation, and risk management are more important than directional bias.

Happy New Year 2026 TRADERSAs we close the chapter on 2025, it’s worth acknowledging what this year truly tested — not just strategies, but discipline, patience, and emotional control. The market offered moments of clarity and long stretches of uncertainty, sharp trends followed by brutal consolidations, and powerful macro moves that rewarded preparation while punishing impulse. Every win came from respecting structure, and every loss carried a lesson for those willing to learn from it.
To all traders who stayed committed to the process managing risk, protecting capital, and waiting for high-probability setups this year has strengthened you more than any single trade ever could. Progress in trading is built quietly, over time, through consistency and self-control.
As we step into 2026, may your decisions be calm, your risk disciplined, and your confidence grounded in experience rather than emotion. May you trade with clarity, adapt quickly, and continue evolving with the market. Wishing every trader health, resilience, and a year ahead filled with focus, growth, and sustainable profitability.
HAPPY NEW YEAR 2026

Gold 1H – Smart Money Breakdown Targets 4040 Liquidity🟡 XAUUSD – Intraday Smart Money Plan | by Ryan_TitanTrader (30/12)
📈 Market Context
Gold has suffered a sharp breakdown following year-end positioning flows, marking its largest single-day drop in weeks. According to today’s hot ForexFactory update, bearish momentum is accelerating as price decisively breaks below key technical levels, with downside targets now aligning toward the $4040–4050 liquidity zone.
This move appears driven less by fresh macro catalysts and more by portfolio rebalancing, profit-taking, and thin liquidity conditions, typical of late-December trading. Despite some dip-buying interest emerging intraday, the broader flow suggests distribution rather than accumulation, keeping Gold vulnerable to further downside sweeps before any sustainable recovery.
Smart Money behavior in this environment favors sell-side continuation with corrective pullbacks, rather than impulsive trend reversals.
🔎 Technical Framework – Smart Money Structure (1H)
Current Phase: Bearish displacement after HTF distribution
Key Idea: Sell premium pullbacks; buy only at deep discount liquidity
Structural Notes:
• Clear CHoCH confirmed after loss of prior bullish structure
• Strong bearish displacement created inefficiencies below
• Previous bullish trendline invalidated
• Price trading below equilibrium, attempting weak corrective retrace
• Internal liquidity partially cleared; external sell-side liquidity rests below
• Resistance zone aligns with prior supply and breakdown origin
💧 Liquidity Zones & Triggers
• 🔴 SELL GOLD 4480 – 4490 | SL 4500
• 🟢 BUY GOLD 4310 – 4320 | SL 4300
🧠 Institutional Flow Expectation
Liquidity sweep → MSS / CHoCH → BOS → displacement → FVG / OB retest → continuation
🎯 Execution Rules (matching your exact zones)
🔴 SELL GOLD 4480 – 4490 | SL 4500
Rules:
✔ Pullback into premium resistance / supply
✔ Bearish MSS or CHoCH on M5–M15
✔ Downside BOS with impulsive displacement
✔ Entry via bearish FVG refill or refined supply OB
Targets:
4420
4370
4310 – extension if bearish momentum persists
🟢 BUY GOLD 4310 – 4320 | SL 4300
Rules:
✔ Sell-side liquidity sweep into deep discount
✔ Bullish MSS / CHoCH confirms absorption
✔ Upside BOS with strong bullish displacement
✔ Entry via bullish FVG fill or demand OB retest
Targets:
4370
4420
4480 – only if structure flips bullish
⚠️ Risk Notes
• Bearish momentum dominates after structural breakdown
• Year-end liquidity increases fake pullbacks and stop hunts
• No trade without MSS + BOS confirmation
• Expect volatility during U.S. session and around USD yield headlines
• Reduce position size if volatility expands unexpectedly
📍 Summary
Gold has transitioned from accumulation to distribution, with Smart Money now favoring downside continuation toward deeper liquidity pools. The plan is clear:
• Sell premium pullbacks at 4480–4490, or
• Buy only at deep discount 4310–4320 after confirmation
Let liquidity be engineered.
Let structure confirm intent.
Smart Money waits — retail reacts. ⚡️
📌 Follow @Ryan_TitanTrader for daily Smart Money gold breakdowns.
