DeGRAM | GOLD is testing the important resistance level📊 Technical Analysis
● XAU/USD is trading near the upper boundary of a rising channel, where multiple rejections from the resistance line signal weakening bullish momentum. The latest push created a visible gap and false breakout, often preceding corrective pullbacks.
● Price structure shows exhaustion after a steep impulse, with consolidation zones below acting as magnets. A breakdown toward 4,450–4,400 aligns with channel mean reversion and prior support levels.
💡 Fundamental Analysis
● Gold faces pressure from stable US yields and reduced safe-haven demand as risk sentiment improves, limiting upside continuation in the medium term.
✨ Summary
● Medium-term short from channel resistance. Key resistance: ~4,520. Targets: 4,450–4,400. Trend weakens if price holds above the channel top.
-------------------
Share your opinion in the comments and support the idea with a like. Thanks for your support!
Commodities

Gold Technical Analysis | XAUUSD Holds Support, Eyes 4600+ LevelGold remains bullish within a rising channel and is currently trading above the key support zone around 4470-85 which aligns with the 0.5–0.618 Fibonacci retracement and the lower trendline of the channel. Price recently showed BOS (break of structure) and CHoCH confirming bullish market structure followed by a healthy pullback that held support.
The current consolidation just below 4535-40 suggests liquidity buildup rather than weakness. As long as price holds above 4485 the bias stays bullish with upside targets toward 4586 and 4617. A clean breakout and hold above 4540 could accelerate momentum toward 4600+ while a break below 4470 would delay the move and shift price into deeper consolidation.
Overall, trend remains bullish with pullbacks seen as buying opportunities.
Note
Please risk management in trading is a Key so use your money accordingly. If you like the idea then please like and boost. Thank you and Good Luck!

Gold in 2026: Will the Bull Market Defy Gravity?Gold emerged as the premier asset of 2025, delivering a remarkable year-to-date gain of roughly 60% . The precious metal shattered multiple records, peaking near $4,550 per ounce in December. While the S&P 500 advanced approximately 17%, gold decisively outperformed almost every major asset class. As we enter 2026, the market must decide if this powerful uptrend still has "fuel in the tank."
Fed Policy and the Opportunity Cost Shift
Federal Reserve policy remains the primary engine for gold’s momentum. After reigniting the easing cycle in late 2024, markets now price in approximately * 60 basis points of additional cuts for 2026. Lower interest rates reduce the opportunity cost of holding non-yielding bullion, making gold more attractive to institutional investors.
The potential appointment of a more dovish Fed chair in mid-2026 could further accelerate this trend. President Trump has publicly pressured for more forceful rate reductions to support economic expansion. If the Fed adopts a markedly more accommodative tone, gold could easily target the $5,000 psychological barrier .
Geopolitical Flashpoints and Tariff Warfare
Military conflicts in Ukraine, Gaza, and the Middle East continue to drive persistent safe-haven inflows. However, the "Trump Liberation Day" announcement of sweeping global tariffs has become an even larger catalyst for demand. Investors increasingly utilize gold as a hedge against the resulting trade-war uncertainty and currency volatility.
Central Banks and the De-Dollarization Narrative
Central banks are fundamentally altering the global reserve landscape. Emerging market institutions, led by China and India, are stockpiling gold to reduce reliance on the U.S. dollar. In 2025, official sector demand reached record-breaking levels, with quarterly totals often exceeding 900 tonnes .
While the pace of accumulation may moderate slightly in 2026, the structural trend remains firmly bullish. Central banks now treat gold as strategic collateral in an increasingly fragmented global financial system.
The Gold-to-Silver Ratio Compression
While gold’s performance was exceptional, it lagged behind the explosive gains in silver, which surged over 150% in 2025 . This dynamic caused the gold-to-silver ratio to tumble toward the 70 mark. Historically, such a sharp compression often precedes a renewed acceleration in the gold rally as the ratio reverts toward the mean.
Risks: Jewelry Demand and Regulatory Headwinds
Despite robust investment interest, record-high prices are crushing physical jewelry demand. Worldwide jewelry consumption saw a 31% year-on-year decline in Q3 2025 as consumers balked at elevated costs.
Additionally, new regulatory measures could dampen local demand in key markets. China’s decision to cut tax exemptions on certain gold holdings might exert downward pressure on prices in early 2026. If the Fed implements fewer rate cuts than anticipated due to a resilient U.S. economy, the bull run could enter a consolidation phase during the second half of the year.
Strategic Outlook for 2026
Technical analysts target the $5,000 to $5,200 range for gold in the first half of 2026. This target aligns with the 261.8% Fibonacci extension of recent corrections. While the path will not be linear, the convergence of geopolitical risk, debt expansion, and accommodative monetary policy justifies a higher equilibrium price.

UKOILSPOT H1 | Potential Bearish ReversalBased on the H1 chart analysis, we could see the price rise to our sell entry level at 61.24, which is a pullback resistance that aligns with the 50% Fibonacci retracement.
Our take profit is set at 61.24, which is a pullback resistance that aligns with the 50% Fibonacci retracement.
Our stop loss is set at 62.05, which is a swing high resistance.
High Risk Investment Warning
Stratos Markets Limited (

GOLD ANALYSIS 12/29/20251. Fundamental Analysis
a) Economic Factors:
• USD: After a period of weakness driven by expectations of FED rate cuts, the USD is showing a short-term technical rebound → creating mild corrective pressure on gold within a narrow range.
• US Equities: Capital flow still favors risk assets, but momentum is slowing as markets approach high valuation zones.
• FED: Expectations of rate cuts next year remain the key pillar supporting gold in the medium–long term. The FED is not rushing into aggressive easing → gold is likely to move sideways or undergo technical corrections.
• TRUMP: Statements and the possibility of a return to the political stage increase policy uncertainty, which is beneficial for gold in the long run.
• Gold ETFs (SPDR): ETF flows remain in accumulation mode with no significant outflows → confirming the primary uptrend is intact. However, current holdings are very high, and partial profit-taking this week is highly possible → be cautious of sudden sharp drops.
b) Political Factors:
• Global geopolitical risks remain elevated (Middle East, Russia–Ukraine) → gold continues to play its safe-haven role.
c) Market Sentiment:
• Mild risk-on sentiment but cautious. Investors are not ready to aggressively sell gold; instead, they are waiting for pullbacks to buy.
• Year-end trading is quiet with thin liquidity.
2. Technical Analysis
• Main trend: UP (Higher High – Higher Low) on H1/H4.
• Price is consolidating below the strong resistance zone around 4,550 after printing a new ATH.
• Rising trendline remains intact → market structure is not broken.
• RSI:
• Pulling back to the neutral zone and bouncing again → signals short-term correction, not reversal; potential for a mild rebound in the early Asian session.
• Preferred scenario: Sideways movement – shallow pullback – then continuation of the uptrend. Look for buying opportunities at support zones when signals appear.
• Key Technical Levels:
• Resistance: 4,550 – 4,577 – 4,604
• Support: 4,525 – 4,500 – 4,481
3. Previous Session (26/12/25):
• Gold surged strongly with a breakout to new highs, then moved sideways without heavy selling.
• Buying pressure remained dominant; selling was mainly technical profit-taking.
• No major distribution signals → market remains healthy.
4. Today’s Strategy (29/12/25):
🪙 SELL XAUUSD | 4510 – 4508
• SL: 4514
• TP1: 4502
• TP2: 4496
🪙 BUY XAUUSD | 4402 – 4404
• SL: 4398
• TP1: 4410
• TP2: 4416

GOLD H1 | Could We See A Bounce?The price is reacting off our buy entry level of 4,444.83, which is a pullback support that aligns with the 50% Fibonacci retracement.
Our take profit is at 4,519.14, which is a pullback resistance.
Our stop loss is at 4,417.57, which is a pullback support that aligns with the 127.2% Fibonacci extension.
High Risk Investment Warning
Stratos Markets Limited (

DOW THEORY – THE FOUNDATION OF TREND READING1. The Market Moves in Trends – Not Randomly
Price does not move randomly. What looks like chaos is simply organized collective behavior.
A trend exists only when price structure is respected:
Uptrend: Higher Highs & Higher Lows
Downtrend: Lower Highs & Lower Lows
As long as this structure remains intact, the trend is still valid, regardless of news, opinions, or emotions.
2. Every Trend Has Three Levels of Movement
Markets operate across multiple time layers simultaneously:
Primary Trend: The dominant direction (weeks to months)
Secondary Move: Corrections against the main trend
Minor Swings: Short-term noise
Most traders lose money because they trade against the primary trend, reacting emotionally to minor fluctuations and mistaking them for reversals.
3. The Three Psychological Phases of a Trend
A trend evolves through three distinct phases:
🔹 Accumulation
Smart money builds positions quietly
Sideways price action, low volatility
Minimal public interest
🔹 Participation
Trend becomes obvious
Breakouts occur
This is where most profits are made
🔹 Distribution
Late buyers enter emotionally
Volatility increases
Smart money exits
Understanding these phases helps traders avoid buying tops and selling bottoms.
4. Structure Is the Only Valid Trend Confirmation
A trend is not confirmed by indicators.
A trend is confirmed when:
- Price breaks structure in the trend direction
- Pullbacks respect previous swing levels
- Momentum continues after corrections
If structure is not broken, there is no reversal only a correction.
This is why predicting tops and bottoms is dangerous.
5. Volume Confirms Direction — Not Timing
Volume does not tell you when to enter — it tells you whether the move is real:
- Rising volume with the trend → confirmation
- Weak volume during pullbacks → healthy correction
- High volume against structure → warning sign
Price leads. Volume confirms.
HOW TO APPLY DOW THEORY IN REAL TRADING
A simple, repeatable framework:
1. Identify the dominant trend (HH/HL or LH/LL)
2. Wait for a correction, not a reversal
3. Enter only after structure resumes in trend direction
4. Place stop-loss where structure becomes invalid
5. Hold until the market changes structure
No prediction. No guessing.
Just reading what price is already telling you.

The vertical rise of Gold.In the mid-seventies Gold made a top and a bottom, from which we measure using a fibonacci extension tool.
Of special interest are the 2.272, 3.272 and 4.272 levels. Those give us a glimpse into the possible future, at which levels Gold might top out.
Since 2022 major Central Banks have been going on a Gold shopping spree, the once described barabrous relic seems to be a very coveted commodity, and it makes sense.
When everything becomes digital, virtual and ephemere, hard assets save the day.
Do you see 15K happening ?

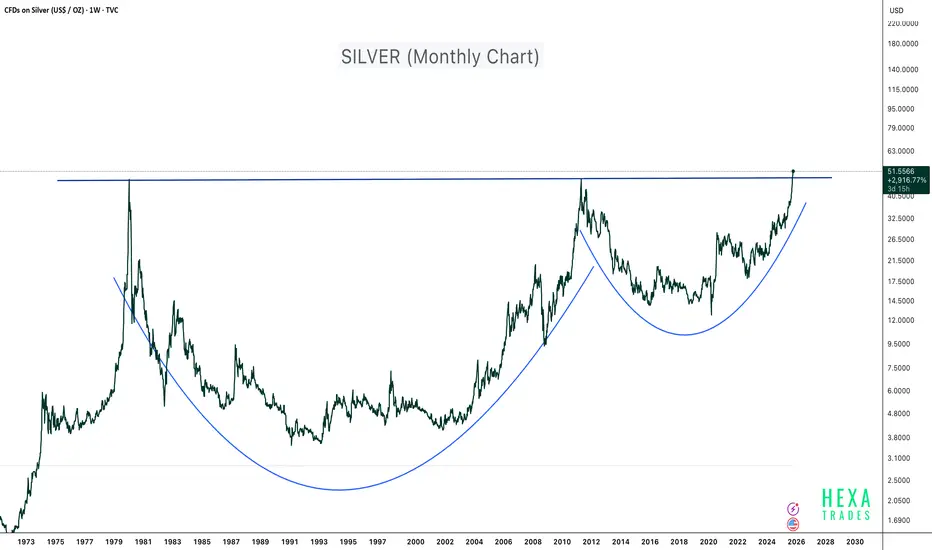
Silver - 45 Years of Breakout!Silver has just completed one of the largest and longest cup and handle patterns in financial history, spanning more than four decades. The metal has officially broken above the 1980 and 2011 highs, signaling a potential supercycle breakout on the monthly timeframe.
This type of long-term technical structure typically marks the beginning of a massive secular bull run, often driven by macroeconomic shifts such as inflation cycles, fiat currency debasement, and rising demand for hard assets.
Technical Highlights:
- Pattern: 45-year Cup and Handle formation
- Breakout Zone: Above $50 confirmed (Weekly chart)
- Structure: Deep base formation showing multiple accumulation phases (1981–2001 and 2012–2023)
Macro Perspective:
Silver is benefiting from:
- Increased industrial demand (especially in solar, EV, and electronics sectors)
- Inflationary monetary policies and growing global money supply
- Renewed investor interest in tangible and real assets
This breakout could mark the start of a multi-year bull run for silver. Long-term investors may view this as an opportunity to accumulate and hold for 10–15 years, aligning with the magnitude and duration of the pattern.
If the price experiences short-term pullbacks in the coming months, use DCA (Dollar-Cost Averaging) to build long-term exposure.
Conclusion:
After 45 years of consolidation, silver is finally breaking free. The chart points toward a historic structural breakout, potentially setting the stage for the next precious metals supercycle.
Cheers
Hexa
Disclaimer:
This analysis is for educational purposes only and does not constitute financial advice. Always conduct your own research and manage risk responsibly.
Gold 1H – Institutions Play Liquidity Between 4530 & 4430🟡 XAUUSD – Intraday Smart Money Plan | by Ryan_TitanTrader (29/12)
📈 Market Context
Gold remains bullish by higher-timeframe structure, but current price action shows clear signs of compression and distribution after an extended impulsive rally. As price trades near recent highs into year-end, liquidity conditions are thinning — increasing the probability of engineered moves rather than clean continuation.
With USD flows mixed and no decisive macro catalyst dominating, Gold is vulnerable to Smart Money manipulation: attracting breakout buyers near resistance while forcing weak longs out at discount levels before revealing true directional intent.
In this environment, patience and confirmation are critical. Smart Money is likely to sweep liquidity on one side of the range before committing to the next expansion.
🔎 Technical Framework – Smart Money Structure (1H)
Current Phase: HTF bullish structure, short-term corrective distribution
Key Idea: Liquidity interaction expected at premium or discount before displacement
Structural Notes:
• Higher-timeframe BOS remains intact
• Short-term CHoCH signals corrective phase
• Price trades inside a rising corrective channel
• Premium conditions favor stop hunts
• Clear imbalance and demand sit below current price
• Defined range between resistance and correction lows
• Buy-side liquidity above 4528–4530
• Sell-side liquidity resting below 4430
Liquidity Zones & Triggers:
• 🔴 SELL GOLD 4528 – 4530 | SL 4540
• 🟢 BUY GOLD 4430 – 4432 | SL 4420
🧠 Institutional Flow Expectation:
Liquidity sweep → MSS / CHoCH → BOS → displacement → FVG / OB retest → expansion
🎯 Execution Rules (Matching Exact Zones)
🔴 SELL GOLD 4528 – 4530 | SL 4540
Rules:
✔ Sweep into resistance / buy-side liquidity
✔ Bearish MSS or CHoCH on M5–M15
✔ Downside BOS with impulsive displacement
✔ Entry via bearish FVG refill or refined supply OB
Targets:
4500
4475
4430 – extension if downside momentum accelerates
🟢 BUY GOLD 4430 – 4432 | SL 4420
Rules:
✔ Liquidity grab into correction / demand zone
✔ Bullish MSS or CHoCH confirms demand control
✔ Upside BOS with strong displacement
✔ Entry via bullish FVG fill or demand OB retest
Targets:
4460
4500
4528 – extension if bullish structure resumes
⚠️ Risk Notes
• Premium pricing increases fake breakout probability
• No entry without MSS + BOS confirmation
• Expect volatility during U.S. session
• Reduce risk in thin year-end liquidity conditions
📍 Summary
Gold remains bullish by structure, but current price action favors liquidity games inside a defined range. Smart Money is likely to engineer stops before expansion:
• A sweep above 4528–4530 may fade back toward 4475–4430, or
• A liquidity grab near 4430–4432 could reload longs toward 4500–4530+
Let price show intent — Smart Money waits, retail reacts. ⚡️
📌 Follow @Ryan_TitanTrader for daily Smart Money gold breakdowns._

Market Report — Friday 26.12.25📉 Market Moves
WTI front-month (CLG26): −2.76% (−1.61)
Behavior: sharp sell-off through the session; prices weakened intraday as peace-deal headlines gained traction and closed near session lows.
RBOB gasoline (RBG26): −2.66% (−0.0467)
Behavior: tracked crude lower with high beta; product selling accelerated alongside crude as risk premium was removed.
Complex view: broad risk-premium unwind, with crude and products moving in tandem.
📊 Key Drivers
Bearish
Ukraine–Russia peace progress (major):
Ukrainian President Volodymyr Zelensky said a 20-point peace plan is ~90% complete and expects to meet Donald Trump, increasing expectations that sanctions on Russian energy could eventually be eased.
Risk premium compression:
Markets discounted reduced geopolitical disruption risk if negotiations advance, prompting liquidation after recent supply-risk rallies.
Rising US rig count:
Baker Hughes reported US oil rigs up +3 w/w to 409, tempering the bullish supply narrative from prior weeks.
Medium-term surplus narrative:
OPEC and IEA continue to project 2025–26 surplus conditions.
Bullish
Venezuela tanker blockade (secondary):
The US Coast Guard forced the sanctioned tanker Bella 1 to turn away as part of the blockade involving Venezuela, supporting prices at the margin.
Russia supply constraints (secondary):
Continued Ukrainian attacks on refineries and tankers and ongoing US/EU sanctions limit exports from Russia.
Nigeria security strikes:
US strikes on ISIS targets in Nigeria (an OPEC member) added minor geopolitical support.
OPEC+ discipline:
OPEC+ reaffirmed its plan to pause production increases in Q1-2026.
📝 Post-Mortem Analysis
Why prices moved: Markets aggressively priced in the possibility of a Ukraine–Russia ceasefire, stripping out geopolitical risk premium despite ongoing physical disruptions.
Crude vs products: Gasoline followed crude lower with little independent support, reflecting weak seasonal demand and high correlation during risk-off sessions.
What changed from prior day: The narrative shifted from supply disruption escalation to diplomatic progress, reversing the bullish momentum built earlier in the week.
🧾 Summary
Oil prices sold off sharply as peace-deal optimism triggered a risk-premium unwind that overwhelmed ongoing Venezuela and Russia supply constraints.

Gold 1H – Liquidity Games Set Up Between 4532–4473🟡 XAUUSD – Intraday Smart Money Plan | by Ryan_TitanTrader (26/12)
📈 Market Context
Gold continues to respect a bullish higher-timeframe structure, supported by a rising trendline and a series of higher lows. However, recent price action shows clear hesitation near highs, suggesting short-term distribution rather than clean continuation.
With year-end liquidity thinning and USD flows remaining mixed, Gold is vulnerable to Smart Money manipulation — engineered stop hunts above resistance and liquidity grabs into demand before the next impulsive move.
This environment favors patience and confirmation-based execution, not chasing breakouts.
🔎 Technical Framework – Smart Money Structure (1H)
Current Phase: Bullish HTF structure, short-term range engineering
Key Idea: Expect liquidity interaction at premium (4530–4532) or discount (4475–4473) before displacement
Structural Notes:
• HTF bullish BOS remains intact
• Short-term CHoCH hints at distribution near highs
• Price is trading above equilibrium, extended into premium
• Unmitigated demand rests around 4475–4473
• Clear liquidity pools above 4530 and below 4475
• Compression favors stop-driven moves before expansion
Liquidity Zones & Triggers:
• 🔴 SELL GOLD 4530 – 4532 | SL 4540
• 🟢 BUY GOLD 4475 – 4473 | SL 4465
🧠 Institutional Flow Expectation:
Liquidity sweep → MSS / CHoCH → BOS → displacement → FVG / OB retest → expansion
🎯 Execution Rules (matching your exact zones)
🔴 SELL GOLD 4530 – 4532 | SL 4540
Rules:
✔ Sweep above buy-side liquidity near highs
✔ Bearish MSS / CHoCH on M5–M15
✔ Clear downside BOS with impulsive displacement
✔ Entry via bearish FVG refill or refined supply OB
Targets:
4510
4490
4475 – extension if USD strengthens or risk-off flows appear
🟢 BUY GOLD 4475 – 4473 | SL 4465
Rules:
✔ Liquidity grab into discount and prior demand
✔ Bullish MSS / CHoCH confirms demand control
✔ Upside BOS with strong bullish displacement
✔ Entry via bullish FVG fill or demand OB retest
Targets:
4495
4515
4530 – extension if USD weakens and bullish momentum resumes
⚠️ Risk Notes
• Trading in premium increases fake breakout probability
• No entries without MSS + BOS confirmation
• Expect volatility during U.S. session and thin year-end liquidity
• Reduce position size around unexpected USD or yield headlines
📍 Summary
Gold remains bullish by structure, but current price action suggests liquidity games inside a defined range. Smart Money is likely to run stops before revealing direction:
• A sweep above 4530–4532 may fade back toward 4490–4475, or
• A liquidity grab into 4475–4473 could reload longs toward 4515–4530+
Let price show intent — Smart Money waits, retail reacts. ⚡
📌 Follow @Ryan_TitanTrader for daily Smart Money gold breakdowns.

YTD 2025 Market Performance Overview by ProjectSyndicate
🟡 1. YTD 2025 Market Performance Summary
Below is a snapshot of major asset class returns through 2025 YTD:
📊 Performance Infographic – YTD Returns (2025)
• Precious Metals
◦ 🥈 Silver: +150%
◦ 🥇 Platinum: +147%
◦ 🪙 Palladium: +92%
◦ 🟡 Gold: +64%
• Equity Markets
◦ 📈 Nikkei: +27%
◦ 📈 DAX: +22%
◦ 📈 QQQ: +22%
• Cryptocurrencies (Risk Assets)
◦ 🪙 Bitcoin (BTC): –4%
◦ 🪙 Ethereum (ETH): –10%
Insight: Classic safe havens precious metals vastly outperformed equities and digital assets through 2025, reflecting both macro uncertainty and the ongoing demand for real assets.
🌟 2. Key Investment Themes for 2025
🔶 A. Precious Metals Rally
Performance Drivers:
• Elevated inflation expectations and rate cut prospects pushed investors into hard assets.
• Silver’s industrial demand (EVs, solar, electrification) amplified its gain vs. gold.
• Platinum & palladium benefited from supply constraints and vehicle emissions tech demand.
• Safe-haven demand lifted gold to multi-decade highs.
🤖 B. AI Technology Sector
While we don’t have precise index returns in this report for AI technology stocks, broad AI adoption drove significant equity performance — especially among semiconductor and AI platform leaders:
• NVDA Nvidia — continued leadership in AI compute.
• AMD — robust gains from data-center and AI client demand.
🧬 C. Biotechnology & Innovation
Biotech remains a structural growth sector due to:
• Aging demographics and healthcare demand.
• New drug modalities and AI-assisted discovery.
• Continued regulatory approvals of new therapeutic classes.
Although biotech performance varies by sub-sector, its role in diversified growth portfolios remains strong.
⚠️ D. Crypto Markets — Flat to Red
• BTC and ETH posted slight declines YTD, contrasting sharply with metals and equities.
• Cryptocurrencies did not act as “digital gold” in 2025 — failing to preserve value relative to hard assets.
Implication: Risk on/off dynamics favored traditional safe havens over digital assets this year.
📅 3. 2026 Gold Price Forecasts — Institutional Consensus
Gold closed 2025 at record highs, and analysts project continued strength in 2026, with a wide range of forecast scenarios:
📈 Gold Price Forecasts for 2026
Forecast Source 2026 Target Notes
J.P. Morgan Global Research ~$5,055/oz (Q4) Strong demand & diversification drivers.
JP Morgan Private Bank / Argonaut ~$5,200–$5,300/oz Elevated institutional demand scenarios.
Goldman Sachs ~$4,900/oz Supported by central bank demand and rate cuts.
Bank of America ~$5,000/oz Broad institutional view.
UBS ~$4,500 (mid-year) Moderately bullish.
World Gold Council (Bear Scenario) ~$3,360–$3,990/oz Bearish if reflation reduces safe-haven demand.
Macro Consensus / Technical Models ~$4,000–$5,300/oz Consensus range based on surveys and models.
Longer-Term & High Estimates $6,000+ More speculative long forecast.
🧠 4. Strategy & Portfolio Implications
📌 Safe Haven Allocation
Given the robust 2025 performance and continued demand drivers, consider maintaining allocations to:
• Physical gold & ETFs
• Silver & industrial metals exposure
• Mining equities and royalty companies
📌 Growth & Innovation Exposure
Balance metals and defensive positioning with growth via:
• AI & semiconductors
• Biotechnology themes
• Select equities in cyclical markets
📌 Crypto Positioning
Given flat/red performance in 2025:
• Reassess crypto allocations relative to risk tolerance.
• Focus on long-term structural adoption catalysts if retaining exposure.
🏁 5. Conclusion
2025 reinforced the case for diversification across asset classes.
• Precious metals delivered standout returns — driven by safe haven demand, supply constraints, and monetary dynamics.
• AI technology and biotech remain secular growth themes, offering upside in equity portfolios.
• Crypto assets lagged traditional hedges, highlighting continued market segmentation in risk assets.
• 2026 gold price forecasts are broadly bullish, though with a wide range of scenarios — from conservative to highly aggressive institutional estimates.

Gold Holds Firm as Markets Reassess MomentumOANDA:XAUUSD is trading around 4,500 USD per ounce, easing slightly from recent highs after an extended rally. The current price action reflects a short-term technical consolidation, as traders lock in profits following the establishment of new record levels.
The recent surge in gold has been driven by a combination of key macroeconomic factors. Geopolitical tensions remain elevated, particularly in the Middle East, while developments surrounding energy sanctions and trade flows in the Americas have increased risk aversion. These conditions continue to channel capital into gold as a preferred safe-haven asset.
At the same time, expectations of looser monetary policy remain a critical pillar of support. Recent U.S. economic data point to slowing growth, moderating inflation, and a softer labor market, reinforcing the view that the Federal Reserve could begin an interest-rate cutting cycle next year. This environment reduces the opportunity cost of holding gold.
From a technical standpoint, gold has broken above multiple consolidation zones and is now holding above a strong high-price base, suggesting that selling pressure remains limited. As long as key support levels are respected, the current pullback is viewed as constructive rather than trend-changing.
In the near term, gold may continue to move sideways while the market awaits fresh catalysts. However, with persistent geopolitical risks and expectations of lower interest rates, the medium-term outlook remains constructive, leaving the door open for another upside extension once buying momentum returns.

Potential Top On XAGUSD, Possible Chance At FOMO Remedy!?OANDA:XAGUSD has seen an impressive rally in price all month of December since breaking out of the grip of the Resistance Level @ 54.45 that held it from October until late November, but the rally may be showing signs of exhaustion at new All Time Highs!
Starting this week we see OANDA:XAGUSD put in a new All Time High @ 83.921 and since then has put in a Low @ 74.874, just above the 23.6% Fibonacci Retracement level.
Now, if price fails to continue pushing higher and falls below the current Low at the 23.6% level, this Bullish momentum will have cooled down and we could then see OANDA:XAGUSD put in a deeper Pullback.
The favorable level I see is the 50% Fibonacci Retracement level @ 64.728.
Fundamentally, metals seem to be softening with Trump and Zelensky "closer to a peace deal" with the Ukraine/Russian conflict but with all the global and economic uncertainty, future rate cuts and struggle with the TVC:DXY , we should not count out that this mere decline is anything more then a simple Pullback.
www.tradingview.com

GOLD "makes history" - What will 2026 be like?The year 2025 concludes with an undeniable fact: OANDA:XAUUSD has entered the rare group of assets that are reshaping the global investment order.
Rising by over 60% in just one year, setting over 50 record highs, gold has not only outperformed stocks and bonds, but has also become the clearest symbol of the prolonged instability in the international economic and political system.
It's noteworthy that this upward momentum didn't stem from a single shock, but rather accumulated over a year-long series of events: geopolitical conflicts, trade wars, a weakening US dollar, expectations of a monetary policy reversal, and especially the sustained inflow of funds from central banks.
From that perspective, the question heading into 2026 is no longer "will gold correct?", but rather: will the market be in a position to reverse its long-term trend?
2025: When Instability Becomes the “New Normal”
Gold's upward trend began at the start of 2025, following two months of correction at the end of 2024. Geopolitical tensions returned to the center of the chessboard, particularly revolving around the tough trade policies of the new US administration, triggering safe-haven demand.
In February, the US officially imposing heavy tariffs on Mexico, Canada, and China marked the actual start of a new trade war cycle. China responded with retaliatory measures, while also continuing to increase its gold reserves, a signal that is more strategic than purely financial.
In the second quarter, expectations that tariffs would erode global growth caused the US dollar to weaken significantly. Gold held above $3,000 per ounce for the first time, despite technical conditions indicating it was in an overbought state.
The summer saw a relatively rare period of sideways movement, as the US and China reached a temporary tariff truce. However, tensions in the Middle East, particularly military actions related to Iran, kept demand for defensive measures from declining.
The turning point came in the fall. The US labor market weakened faster than expected, and sharp adjustments to official employment figures reinforced expectations that a monetary easing cycle was no longer a distant possibility. The US government shutdown due to the budget impasse further increased the macroeconomic risk premium. As a result, gold surged, creating successive new historical highs from the end of October.
The core motivation behind gold's shift beyond mere "safe haven":
According to the World Gold Council, 2025 marks a structural shift in how gold is used:
• Central banks view gold as a tool to reduce dependence on the dollar and the Western financial system.
• Institutional investors use gold as a long-term strategic asset, not just a short-term defense.
• The weakening dollar is systemic, reflecting budget deficits, public debt, and policy uncertainty in the US.
More importantly, the rise in gold is occurring even as the market has become "aware of the risks," indicating that demand is not purely speculative.
2026: 3 Scenarios, but Uneven in Probability
1. Base Scenario: Upward Fluctuation, No More Unidirectional Increase
In the neutral scenario, which is also considered by many organizations to have the highest probability, the price of gold is likely to fluctuate within a wide range but maintain a slight upward trend.
The Federal Reserve is expected to continue easing policy to support growth and the labor market, but it is unlikely to drastically cut interest rates if inflation remains pegged around 3%. In this context, the US Dollar is unlikely to recover strongly, providing support for gold.
However, some capital flows could shift to the euro or the British pound if monetary policy gaps narrow, making gold's upward momentum slower and more fragmented than in 2025.
2. Bullish scenario: $4,900–$5,000/ounce is no longer a far-fetched hypothesis
If the US economy weakens further, forcing the Fed to aggressively cut interest rates, bond yields fall rapidly, and the USD weakens sharply, gold will enter a new valuation phase.
In this context, any geopolitical escalation from the Middle East, US-China relations, to the Russia-Ukraine conflict could amplify the upward trend.
Goldman Sachs and Bank of America have both set targets of $4,900–$5,000/ounce, based on the assumption that gold continues to be accumulated at the national level, not just at the discretion of financial markets.
3. Bearish Scenario: Possible, but Low Probability
The worst-case scenario would only materialize if the US economy recovers better than expected, the labor market improves rapidly, geopolitical tensions significantly ease, and the Fed delays easing monetary policy.
Even in that case, the likelihood of a “deep, collapse-like correction” is still underestimated, because the demand structure for gold is different from previous cycles.
In short, 2026 is no longer a story of euphoria, but of structure.
After a year of historic breakthroughs, gold enters 2026 in a new role: not just as a safe-haven asset, but as a gauge of confidence in the global economic order.
What the market needs to watch is not short-term corrections, but whether the fundamental factors of monetary policy, geopolitics, and central bank behavior change.
Until those factors clearly reverse, a gold price crash scenario remains the exception, not the main trend.
Technical analysis and suggestions OANDA:XAUUSD
The gold chart shows that the medium- to long-term uptrend remains intact, and more importantly, the market structure has converged to create conditions for a new bull cycle after a prolonged consolidation phase.
After correcting from its peak of $4,380/ounce, the price of gold did not break the uptrend structure but formed a healthy technical correction. The $4,200–$4,250 region acted as a crucial confluence support, where moving averages and key Fibonacci levels converge. Buyers successfully defended this area, indicating that long-term capital has not yet withdrawn from the market.
Notably, the price is currently moving within a new ascending channel, with each subsequent low higher than the previous one. The price breaking back above the previous historical high of $4,380/ounce is not only technically significant but also confirms a psychological response: the market is ready to accept higher price levels.
The RSI remains above the neutral level and is trending upwards, reflecting reactivated upward momentum, although it has not yet reached an extreme overbought state. This allows for room for further gains without becoming too volatile.
In the base scenario, if the price holds above the $4,380 level, the next technical targets are:
• $4,700–$4,720 (0.786 Fibonacci extension),
• Further, $4,900–$5,000, corresponding to the upper boundary of the medium-term uptrend channel.
Regarding risk, a correction scenario is only truly concerning if the closing price clearly falls below $4,200, at which point the short-term uptrend would be broken and the price could retest the $4,000–$3,880 range. However, at the moment, this remains a low-probability scenario, unless there is a major shock in monetary policy or geopolitics.
In summary, gold is no longer in a state of "temporary fear-driven rise," but is entering a structured uptrend, supported by both technical factors and the macroeconomic context. In an environment where monetary policy, geopolitics, and confidence in fiat currency remain highly variable, gold continues its unwavering upward trend.
SELL XAUUSD PRICE 4546 - 4544⚡️
↠↠ Stop Loss 4550
→Take Profit 1 4538
↨
→Take Profit 2 4532
BUY XAUUSD PRICE 4486 - 4488⚡️
↠↠ Stop Loss 4482
→Take Profit 1 4494
↨
→Take Profit 2 4500

Gold - Upper BoundaryThe move from late October 2025 can be viewed as the start of a correction, and so far nothing has fundamentally changed - only the type of correction has been revised.
It now appears to be an expanded flat.
The upper boundary is a break above 4,571 (+5) - at that point, this scenario would be considered invalid.
Next, according to the scenario, we should see a fast downward move - wave C - either from the current level or from the high.
Potential targets if the move starts from the high:
• 3,940
• 3,769
• possibly lower
If this scenario plays out, a rebound is expected afterward, followed by continuation in the direction of the main trend.
---
Please subscribe and leave a comment.
You’ll get new information faster than anyone else.
---

Bullish momentum to extend?Gold (XAU/USD) is falling towards the pivot, which is a pullback support and could bounce to the 1st resistance.
Pivot: 4,379.38
1st Support: 4,211.75
1st Resistance: 4,684.35
Disclaimer:
The opinions given above constitute general market commentary and do not constitute the opinion or advice of IC Markets or any form of personal or investment advice.
Any opinions, news, research, analyses, prices, other information, or links to third-party sites contained on this website are provided on an "as-is" basis, are intended to be informative only, and are not advice, a recommendation, research, a record of our trading prices, an offer of, or solicitation for, a transaction in any financial instrument and thus should not be treated as such. The information provided does not involve any specific investment objectives, financial situation, or needs of any specific person who may receive it. Please be aware that past performance is not a reliable indicator of future performance and/or results. Past performance or forward-looking scenarios based upon the reasonable beliefs of the third-party provider are not a guarantee of future performance. Actual results may differ materially from those anticipated in forward-looking or past performance statements. IC Markets makes no representation or warranty and assumes no liability as to the accuracy or completeness of the information provided, nor any loss arising from any investment based on a recommendation, forecast, or any information supplied by any third party

Potential bearish drop?WTI Oil (XTI/USD) is reacting off the pivot and could drop to the 1st support.
Pivot: 58.10
1st Support: 53.34
1st Resistance: 62.14
Disclaimer:
The opinions given above constitute general market commentary and do not constitute the opinion or advice of IC Markets or any form of personal or investment advice.
Any opinions, news, research, analyses, prices, other information, or links to third-party sites contained on this website are provided on an "as-is" basis, are intended to be informative only, and are not advice, a recommendation, research, a record of our trading prices, an offer of, or solicitation for, a transaction in any financial instrument and thus should not be treated as such. The information provided does not involve any specific investment objectives, financial situation, or needs of any specific person who may receive it. Please be aware that past performance is not a reliable indicator of future performance and/or results. Past performance or forward-looking scenarios based upon the reasonable beliefs of the third-party provider are not a guarantee of future performance. Actual results may differ materially from those anticipated in forward-looking or past performance statements. IC Markets makes no representation or warranty and assumes no liability as to the accuracy or completeness of the information provided, nor any loss arising from any investment based on a recommendation, forecast, or any information supplied by any third party

XAUUSD – Bullish Continuation Setup (30M)Buy Zone: 4,520 – 4,530
Stop Loss:Below 4,500
Targets
TP1: 4,550
TP2: 4,600 – 4,610
Price is holding above ascending trendline and key demand. Bullish structure remains intact. A clean break and hold above resistance can trigger continuation toward the upper target zone.

Gold Is Compressing — The Real Move Comes After ThisGOLD – 1H | Key Points
Structure: Price is moving inside a rising channel, maintaining higher highs & higher lows → bullish structure intact.
Behavior: Current pullbacks are corrective, not distribution. Buyers keep defending the lower channel trendline.
Key Levels:
Support: ~4,460–4,480 (channel base)
Resistance: ~4,550–4,570 → breakout opens 4,600+
Market Logic: This is bullish compression, volatility contracts before expansion.
Bias: UP continuation after a shallow pullback.
Invalidation: Clean break below channel support.

Gold Is Compressing at the Highs — The Next ExpansionCURRENT MARKET ANALYSIS – GOLD (XAUUSD, H1)
1. Market Structure
Gold remains in a clear bullish structure on the H1 timeframe. Price is holding well above the key moving averages (EMA 34 & EMA 89), confirming that buyers still control the dominant trend.
The recent price action shows sideways compression near the highs, not a reversal. This behavior typically appears before a volatility expansion, especially after a strong impulsive leg.
2. Key Price Zones
Major Resistance: 4,525 – 4,530
Intermediate Support / Pivot: 4,490 – 4,495
Major Support: 4,425 – 4,430
Dynamic Support: EMA 34 & EMA 89 zone below price
Price is currently rotating between the 4,49x support and the 4,52x resistance, forming a tight range.
3. Price Behavior & Order Flow
Rejections from the resistance zone are corrective, not impulsive
Each pullback holds above previous demand → higher-lows intact
Liquidity is building both above the range highs and below the mid-range
This is a classic accumulation / re-accumulation phase within an uptrend.
4. Probable Scenarios
Primary Scenario (Trend Continuation):
Price holds above 4,49x
Range compression resolves upward
Break and acceptance above 4,525
Expansion toward 4,55x+
Alternative Scenario (Liquidity Sweep):
Short-term fake breakout or rejection
Sweep toward 4,46x–4,47x
Strong bullish reaction from demand
Continuation higher afterward
Only a clean break and acceptance below 4,425 would invalidate the bullish structure.
5. Trading Bias
Main Trend: UP
Intraday Focus: Buy pullbacks, avoid chasing highs
Risk Note: Expect volatility expansion — manage position size carefully
Conclusion
Gold is not topping it is loading energy.
The market is compressing near resistance, and the next breakout will define the next impulse leg. As long as price remains above key supports, the bias stays firmly bullish.

Gold Don't let it CRACK!Nothing goes straight up forever, so don't let it CRACK! This is just basic charting stuff that everyone should be able to understand here.
A CRACK here does not mean it's done going up. How it cracks matters. We can reassess when more info comes in on the chart.
If you enjoy the work:
👉 Drop a solid comment
Let’s push it to 6,000 and keep building a community grounded in raw truth, not hype.
