taking a trade on gold if it respects the bISI and the order blo1. Understand the Concepts:
BISI (Break of Structure, Internal Structure, and Institutional Order Flow):
Break of Structure (BOS): This refers to a change in market direction. For example, when a market makes a new high or low, signaling a change in trend.
Internal Structure: This involves analyzing market structure within a trend. For example, the market might make higher highs and higher lows in an uptrend or lower highs and lower lows in a downtrend.
Institutional Order Flow: This focuses on understanding the movement that big institutions are likely creating in the market. You look for patterns of accumulation or distribution where price is likely to reverse based on institutional buying and selling.
Order Block: An order block is a price area where institutions have placed large buy or sell orders, causing a significant market move. These are often seen as areas where price might reverse or continue after a pullback.
2. Setting Up the Trade:
Step 1: Identify the Break of Structure (BOS)
Check if the market has broken a significant structure point (either a high or low), indicating a possible trend reversal or continuation.
For gold, look for recent highs and lows that have been breached.
Step 2: Locate Internal Structure
In the context of an uptrend, gold might make higher highs and higher lows.
In the context of a downtrend, look for lower highs and lower lows.
Identify areas where the price has been consolidating or retracing within the trend, as these are important spots for potential breakouts.
Step 3: Check for Institutional Order Flow
Look for areas on the chart where there has been a significant move, followed by consolidation. This is often indicative of institutional order flow.
An order block could be seen as a consolidation zone, followed by a large price movement away from it. If price retraces back to this area, it might act as support (in an uptrend) or resistance (in a downtrend).
Step 4: Look for the Order Block
Identify key order blocks. These are typically found at major turning points in the market or after a strong price move.
If price retraces back to the order block area, and it aligns with the BISI criteria, it could provide a potential entry point.
3. Confirming the Trade:
Once you've identified a BOS, an internal structure in alignment with the trend, and a valid order block, you can look for a confirmation to enter the trade.
Candlestick patterns or volume analysis could provide additional confirmation, such as a bullish engulfing or a pin bar at the order block.
If you're trading a reversal, look for signs of exhaustion (such as divergence) at the order block area.
4. Trade Execution and Management:
Entry: Enter the trade when price respects the order block and confirms the break of structure.
Stop Loss: Place your stop loss slightly below (in case of an uptrend) or above (in case of a downtrend) the order block area, depending on your risk tolerance.
Take Profit: Set your take profit at a logical target, such as the next swing high/low, a key level of support/resistance, or a risk-to-reward ratio that suits your strategy.
Commodities

Gold Near ATH & PRZ — Is This the Top?As I expected , Gold( OANDA:XAUUSD ), after its pullback to the symmetrical triangle, has risen toward its target.
Now, the question arises: given that Gold is near its all-time highs, is it still sensible to take long positions, or should we consider short positions instead?
Gold is moving close to its All-Time High(ATH=$4,381) and the Potential Reversal Zone(PRZ) , also nearing the target of the Symmetrical Triangle Pattern.
From an Elliott Wave perspective, it seems that Gold is in the process of completing microwave 5 of the main wave 5. One indication of this is the presence of negative Regular Divergence (RD-) between the two corresponding peaks.
I expect that Gold will experience a downward correction and potentially drop to around $4,263, with significant support lines in place. Should those support lines be broken, we could anticipate even further declines.
What are your thoughts? Do you believe Gold will reach new all-time highs, or are we looking at a correction ahead?
First Target: $4,263
Second Target: Support lines
Stop Loss(SL): $4,433
Points may shift as the market evolves
💡 Please respect each other's opinions and express agreement or disagreement politely.
📌 Gold Analyze (XAUUSD), 4-hour time frame.
🛑 Always set a Stop Loss(SL) for every position you open.
✅ This is just my idea; I’d love to see your thoughts too!
🔥 If you find it helpful, please BOOST this post and share it with your friends.

Gold Continues to Search for New HighsHello, smart and prosperous friends — what’s your view on OANDA:XAUUSD ?
Today, gold continues to maintain its bullish momentum and is currently trading around USD 4,305, marking its highest level since October 21. The main driver remains expectations that the Federal Reserve will continue cutting interest rates, which puts pressure on the U.S. dollar and supports the precious metal.
In the near term, market attention is focused on the U.S. Non-Farm Payrolls (NFP) report, along with retail sales and PMI data scheduled for release today. These key indicators could directly influence monetary policy expectations and gold price volatility.
From a technical perspective, the bullish structure remains clearly intact. Strong demand zones below are holding firmly, while recent pullbacks appear to be purely technical in nature.
Notably, the USD 4,350–4,360 area is showing signs of a weak high, suggesting there may still be room for price to sweep liquidity to the upside. As long as gold holds above its structural support, the preferred scenario remains buying on pullbacks, rather than selling against the prevailing trend.
What’s your take on gold prices today? Share your thoughts 👇.

XAUUSD Bearish Setup | Supply Zone RejectionXAUUSD rejected from supply zone and trading below resistance. Bearish structure remains valid, with price likely to move toward the next demand zone if support breaks. Trade with confirmation and proper risk management.

XAUUSD: Rejection at Resistance - Support Zone at 4,270 in FocusHello everyone, here is my breakdown of the current XAUUSD setup.
Market Analysis
Gold (XAUUSD) is trading within a broader bullish structure, but the current price action suggests a short-term corrective move. After breaking above the descending Triangle Resistance Line, price entered a consolidation Range, where accumulation formed before a bullish Breakout. This breakout pushed XAUUSD higher toward the key 4,350 Resistance, which has acted as a strong reaction zone in the past.
Currently, at this resistance level, price showed clear hesitation and rejection, signaling that sellers are becoming active again. The market is now pulling back from the highs, moving toward the 4,270 Support Zone, which aligns with the previous breakout area and the rising Triangle Support Line. This zone is critical, as it represents the main demand area keeping the structure bullish.
My Scenario & Strategy
My scenario is short-term bearish as long as XAUUSD remains capped below the 4,350 Resistance. I expect a controlled pullback toward the 4,270 Support, where buyers may attempt to defend the trend.A clean breakdown below the support zone would confirm a deeper correction toward the Triangle Support Line.
However, if price holds above 4,270 and shows strong bullish reaction, the broader uptrend remains intact and another attempt toward the highs may follow. For now, the focus is on the pullback phase, with 4,270 as the key level to watch.
That's the setup I'm tracking. Thank you for your attention, and always manage your risk.

GLD mid-term TAGold is approaching a possible correction on mid-term trend, currently there's a double-top formation with negative divergence in accumulation, technically there's still juice to breakout the top but it will be quite difficult and it won't last long without the correction.
Following the long-term formation there's still plenty of resources to continue the uptrend but the correction surely will take place.

DeGRAM | GOLD will inevitably reach $4400 soon📊 Technical Analysis
● XAU/USD has broken above the rising trendline and former consolidation zone near 4,280–4,300, confirming bullish continuation from the ascending structure. The breakout candle sequence shows strong follow-through after multiple higher lows, signaling trend strength.
● Price now holds above the trendline support, with the next upside objective aligned with the descending long-term resistance near 4,370–4,400. Pullbacks toward 4,300 are viewed as corrective while structure remains intact.
💡 Fundamental Analysis
● Gold remains supported by expectations of softer US monetary conditions and persistent geopolitical uncertainty, sustaining demand for safe-haven assets.
✨ Summary
● Bullish breakout confirmed. Key support: 4,280–4,300. Targets: 4,370–4,400. Trend invalidation below rising support.
-------------------
Share your opinion in the comments and support the idea with a like. Thanks for your support!

Is $50 oil in the offing? Yes, definitely.Hi my dears
According to the current policies, we should see oil prices fall to the $50 range. Of course, technically, the important $55 level is being broken, which makes this possible.
What do you think?

Silver's Advantage over Gold Might Be Coming to an EndThe gold/silver ratio is now below 68. The balance may have turned too much in favor of silver and is currently testing the -2 standard deviation of the 2020-to-date regression trend. The heightened demand from China, rising energy investments, and opposite reactions to tariff fears are some of the main reasons for the imbalance. Sometimes the ratio goes to extremes but eventually comes back to long-term averages. As 2020 was a game changer in the economy, the 2020-to-date regression line can be accepted as the balance point.
When the rebalancing price action begins, a "buy gold, sell silver" pair trade opportunity might emerge.

XAUUSD: Market Analysis and Strategy for December 16thGold Technical Analysis:
Daily Resistance: 4382, Support: 4175
4-Hour Resistance: 4353, Support: 4245
1-Hour Resistance: 4318, Support: 4265
On the daily chart, gold is testing moving average support, which are in a bullish alignment. The Bollinger Bands are expanding upwards, indicating an upward channel. Support is around 4220. The MACD/KDJ indicators suggest a bullish outlook.
On the 1-hour chart, a "V-shaped" reversal pattern is observed. Resistance is seen around Friday's high of 4353. The Bollinger Bands are expanding upwards, and the moving average system is trending upwards. The main strategy is to trade with the trend, waiting for support levels to buy. Short-term support is around 4245/4240, while resistance is seen around Friday's high of 4330/4350 and the previous historical high of 4381. The market is awaiting today's US NFP employment data and unemployment rate data. Avoid high liquidity during news release periods. Don't be a gambler!
Wait for support levels to buy; please use small trades!
Trading Plan:
BUY: 4245~4240
More Analysis →

XAUUSD - Signal#XAUUSD - Signal
H4 - Formation of the 3rd wave + breakout of the trend line. Stop behind the high of the 2nd wave. It's best to reduce risks; a correction is being traded.
Entry: 4282.911
TP: 4198.134 - 4104.783 - 4018.346 - 3897.335
Stop: 4357.119

Be careful with Gold !!!The price, in completing the corrective wave, can drop to the bottom of the ascending channel and then experience a strong rise back to the top of the channel.

EURUSD: bullish breakout🛠 Technical Analysis: On the 4-hour timeframe, EURUSD is setting up for a bullish continuation following a breakout from a descending channel. The chart highlights a "Global bullish signal", where the SMA 50 has crossed above the SMA 100 and SMA 200, confirming a shift in momentum. Price action has stabilized around the 1.17400 resistance zone. The analysis anticipates a volatility spike, expecting the pair to "shoot up" towards the major resistance at 1.18000.
———————————————
❗️ Trade Parameters (BUY)
———————————————
➡️ Entry Point: approx. 1.17531
🎯 Take Profit: approx. 1.18000 (Resistance)
🔴 Stop Loss: Below the recent consolidation (approx. 1.17135)
⚠️ Disclaimer: This is a potential trade idea based on current analysis; market conditions and price direction are subject to change based on news factors and volatility.

Gold Is Compressing for a Break, Macro Forces Are Lining UpMARKET BRIEFING – XAU/USD (4H)
Market State:
– Gold is consolidating bullishly below the previous ATH at 4,380, maintaining higher lows. This price behavior aligns with a market that is absorbing supply, not distributing.
MACRO CONTEXT – WHY THE UPSIDE CASE IS STRONG
1. Fed Policy: Tightening Is No Longer the Driver
– The Fed has shifted from aggressive tightening to a data-dependent, hold-biased stance.
– Rate expectations are capped → real yields struggle to push higher, removing downside pressure on gold.
– Markets are already pricing future easing cycles, which structurally favors precious metals.
2. USD Weakness Is Structural, Not Temporary
– The U.S. Dollar has failed to extend upside despite elevated rates a classic late-cycle signal.
– Any USD bounce remains corrective while macro flows rotate toward hard assets and inflation hedges.
3. Global Risk & Geopolitics Remain Unresolved
– Ongoing geopolitical instability and fiscal uncertainty continue to support safe-haven demand.
– Central banks remain net buyers of gold, reinforcing long-term accumulation beneath price.
4. Liquidity Environment Favors Asset Inflation
– Global liquidity conditions are stabilizing after prolonged tightening.
– Gold historically performs best during liquidity inflection phases, especially when rates peak.
TECHNICALS + MACRO ALIGNMENT
Key Levels:
– Resistance / Decision Zone: 4,360 – 4,380
– Support Holding Structure: 4,300 – 4,320
– Structural Base: ~4,250
– Macro Expansion Target: 4,450 → 4,500
Price Action:
– Bullish consolidation under ATH = smart money absorption.
– Macro backdrop removes the conditions required for a sustained breakdown.
– Technical compression + macro tailwinds = high-probability expansion setup.
Next Move (High-Confidence Scenario):
– Acceptance above 4,380 triggers range expansion toward 4,450–4,500.
– As long as price holds above 4,300, pullbacks are continuation opportunities, not reversal signals.
Gold is not just technically strong — macro conditions are validating the breakout thesis.
This is not speculation; it is structure + policy + liquidity moving in the same direction.

GOLD On The Rise! BUY!
My dear friends,
Please, find my technical outlook for GOLD below:
The instrument tests an important psychological level 4283.9
Bias - Bullish
Technical Indicators: Supper Trend gives a precise Bullish signal, while Pivot Point HL predicts price changes and potential reversals in the market.
Target - 4298.8
Recommended Stop Loss - 4274.0
About Used Indicators:
Super-trend indicator is more useful in trending markets where there are clear uptrends and downtrends in price.
Disclosure: I am part of Trade Nation's Influencer program and receive a monthly fee for using their TradingView charts in my analysis.
———————————
WISH YOU ALL LUCK

XAUUSD🔓 SHORT SETUP ACTIVATED | CLEAN RISK–REWARD TRADE
Market has reached a strong resistance zone and price action is showing signs of weak momentum. This setup is based on structure, rejection, and confluence, not emotions.
📌 Trade Plan
🔓 Entry Level: 4336
❌ Stop Loss: 4315
🎯 Target: 4350
📊 Why this trade?
✔ Resistance + rejection
✔ Momentum slowdown
✔ Favorable R:R
✔ Discipline over prediction
Remember: Trading is about probabilities, not certainty. Manage risk, follow your plan, and let the market do the rest.
👍 If this idea aligns with your analysis, hit like,
💬 share your view in comments,
🔔 and follow for more structured trade ideas.
⚠️Disclaimer: This is not financial advice; it reflects only my personal market analysis. Please do your own research before trading.

XAUUSD Defends Support – Upside Move Toward 4,380 ExpectedHello traders! Here’s my technical outlook on XAUUSD based on the current market structure. Gold continues to trade within a well-established bullish trend, supported by a clear ascending Trend Line that has been respected after multiple pullbacks. After an earlier rejection from the upper Resistance Level, price experienced a corrective decline but successfully turned around near the trend line, confirming strong buyer interest at lower levels. Following this reaction, XAUUSD broke above the descending Resistance Line, signaling a shift in momentum back in favor of buyers. The market then entered a Range phase, where price consolidated between the Support Level around 4,260 and the Buyer Zone near 4,300, indicating accumulation and balance before the next impulse move. A confirmed breakout from the range occurred to the upside, with buyers aggressively pushing price above the Buyer Zone. Currently, gold is trading firmly above 4,300, showing sustained bullish strength and acceptance above previous resistance. The next key area of interest is the upper Seller Zone / Resistance Level around 4,380, which has acted as a strong reaction zone in the past. As long as price holds above the 4,260 Support Level and continues to respect the ascending trend line, the bullish scenario remains valid. My primary scenario is a continuation toward the 4,380 resistance, where a reaction or short-term rejection may occur. A clean breakout above this Seller Zone could open the door for further upside expansion, while rejection may lead to a healthy pullback toward the Buyer Zone or trend line support. For now, the structure clearly favors buyers, with 4,380 as the main upside target. Please share this idea with your friends and don’t forget to manage your risk 🚀

XAUUSD Intraday Plan | Can Bulls Sustain the Move?Friday we saw gold sharply retrace after tagging the 4352 area. Price is now attempting to push higher again, currently trading around 4344 and holding just above the 4334 level.
A sustained break above 4334 would keep bullish momentum intact and open the path toward 4362, with further upside into 4395 if momentum holds.
On the downside, if 4334 gives way, the First Reaction Zone becomes the first area to watch for a bounce. If selling pressure extends and 4270 fails, then focus shifts to the Support Zone as the next potential area where buyers could step back in.
📌Key levels to watch:
Resistance:
4362
4395
Support:
4334
4301
4270
4237
4185
🔎Fundamental focus:
This week is packed with high-impact U.S. data, including Retail Sales, PMI readings, CPI, and key labour market updates. Expect increased volatility and sharp intraday swings as markets reassess inflation and rate expectations. Risk management is key, especially around data releases.

SLV vs. IAU: Why Silver Is Crushing Gold ETFsMarket Performance: The Silver Surge
The iShares Silver Trust (SLV) is significantly outperforming its gold counterpart. Over the past year, SLV delivered a staggering 98.9% return. In contrast, the iShares Gold Trust (IAU) posted a respectable but lower 60.2% gain. Investors focused solely on safety often miss this growth engine. While gold acts as a stable store of value, silver behaves aggressively. This dynamic has resulted in SLV turning a $1,000 investment into $2,532 over five years. Gold generated $2,322 over the same period. The data confirms silver’s dominance in the current bull market.
High-Tech and Science: The Industrial Driver
Silver is not just a currency; it is a critical industrial component. Science dictates this market reality. Silver possesses the highest electrical and thermal conductivity of all metals. Consequently, the high-tech sector drives massive demand. Manufacturers require silver for 5G networks, advanced electronics, and medical devices. Unlike gold, which sits in vaults, industry consumes silver. This consumption creates a fundamental scarcity that drives price appreciation during economic expansions.
Green Tech and Patent Analysis
The global shift toward renewable energy directly benefits SLV. Patent filings for photovoltaic (solar) technologies have surged globally. Silver is the primary conductive element in solar panels. As the world transitions to net-zero emissions, solar demand creates a price floor for silver. Furthermore, electric vehicle (EV) patents increasingly rely on silver for contacts and circuitry. This structural trend ensures that SLV tracks the green energy boom, not just monetary policy.
Geopolitics and Geostrategy: Critical Minerals
Geopolitical tensions are reshaping the precious metals landscape. Nations now view silver as a strategic material rather than just a luxury good. Governments are securing supply chains for critical minerals to ensure technological sovereignty. This geostrategic hoarding reduces global supply elasticity. As major powers decouple their economies, control over silver mining and refining becomes a national security issue. Investors in SLV profit from this heightened competition for physical resources.
Macroeconomics: The Inflation Hedge
Both trusts capitalize on global debt concerns. Sovereign debt levels are rising uncontrollably across major economies. Investors traditionally use precious metals to hedge against currency debasement. However, silver offers a "high beta" play on inflation. When inflation expectations rise, silver typically rises faster than gold due to its smaller market size. Current macroeconomic conditions favor this volatility. The market anticipates continued currency devaluation, fueling inflows into hard assets like SLV.
Business Models and Fund Structure
The iShares business model focuses on accessibility. Both SLV and IAU allow investors to bypass the costs of storing physical bars. However, their cost structures differ. IAU charges a lean 0.25% expense ratio, appealing to cost-conscious holders. SLV charges 0.50%. Investors pay this premium for silver’s explosive growth potential. The fund structure is a grantor trust, meaning it holds physical bullion. This protects investors from counterparty risks associated with futures contracts or derivatives.
Risk Management and Volatility
High returns come with higher risk. SLV carries a beta of 0.18, indicating positive correlation with equity volatility. IAU holds a beta of -0.06, acting as a true diversifier. Consequently, SLV suffered a maximum drawdown of nearly 39% over five years. Gold dropped only 21.8% in the same period. Management of portfolio risk requires understanding this difference. Aggressive traders prefer SLV for its torque; conservative savers choose IAU for stability.
Conclusion: The Strategic Choice
The iShares Silver Trust offers superior leverage to the global industrial recovery. While IAU remains the safer, cheaper hedge, SLV is the growth leader. The combination of green technology demand and monetary debasement creates a perfect storm for silver. Investors willing to tolerate higher fees and deeper drawdowns have reaped larger rewards. As long as the precious metals bull market persists, silver’s dual nature ensures it will continue to outpace gold.

WTI/USD: Bullish Rally to 62.45?CFI:WTI is gearing up for a bullish rally on the 4-hour chart , with price rebounding from a key support zone near cumulative long liquidation levels, setting up a strong entry opportunity if buyers maintain control and push toward resistance amid recent consolidation. Entry from current levels could also be favorable with proper risk management.
Entry zone between 57.5-58.3 for a buy position. Target at 62.45 near resistance.🎯 Set a stop loss at 56.335 , offering a risk-reward ratio greater than 1:2 . 📊 Watch for confirmation with a bullish close above entry and rising volume, capitalizing on oil's volatility.🌟
Fundamentally , WTI crude has fallen to around $58.13 per barrel as of November 21, 2025, amid supply outpacing demand, but recent breakouts above $60.7 signal near-term positivity despite forecasts of further drops to $53.50-$45.00 due to OPEC+ hikes and record US output. 💡
📝 Trade Setup
🎯 Entry Zone (Long): 57.5 – 58.3
🎯 Target (TP1): 62.45
❌ Stop Loss: 56.335
⚖️ Risk-to-Reward: Greater than 1:2, offering a clean upside swing with defined invalidation.
What's your take on this setup? Drop your thoughts below! 👇

GOLD falls as signs of peace emerge between Russia and UkraineOANDA:XAUUSD opened the week in a noticeably weaker state. After touching the $4,350/ounce mark, the market quickly reversed course and declined as diplomatic signals related to Russia and Ukraine emerged, eroding the safe-haven role that had supported gold prices for weeks.
This time, the story didn't stem from economic data, but from politics. Progress in peace negotiations with direct participation from the US and Europe, and "leading" statements from President Trump, rapidly changed market sentiment. As geopolitical risks eased, defensive capital flows immediately faltered.
Trump publicly stated that talks with European leaders and Russian President Putin "are going well," and expressed confidence that a peace deal is more possible than ever. At the same time, Ukrainian President Zelensky signaled his willingness to abandon his goal of joining NATO in exchange for security guarantees from the West, a landmark concession in the negotiating logic.
The market reacted very pragmatically. When a prolonged conflict scenario was no longer the only option, the "risk premium" added to the price of gold had to be adjusted. Profit-taking intensified as investors realized that the safe-haven narrative was temporarily interrupted.
On the monetary side, gold also lacks new momentum. Last week, the Federal Reserve cut interest rates by 25 basis points, the third time this year, but at the same time signaled it would act more cautiously. The Fed is entering a "data-waiting" phase, and the market understands that the room for easing is no longer as wide as previously expected.
Now, attention is focused on the US non-farm payrolls and retail sales reports. These figures will determine whether the Fed has sufficient grounds to continue its interest rate cutting cycle next year. With interest rates not expected to fall rapidly, gold, a non-yielding asset, is likely to experience repositioning adjustments.
The current picture suggests that gold is not entering a long-term downtrend, but is losing one of its most important pillars: "market fear." In the short term, the market will continue to trade between monetary policy expectations and geopolitical developments, where every statement from the negotiating table can have an impact no less significant than an economic report.
The core message is clear: gold isn't weakening because it's losing value, but because the world, at least for now, temporarily believes that the biggest risks can be controlled. And in financial markets, that belief, however fragile, is always enough to create volatility.
Technical analysis and suggestions OANDA:XAUUSD
Gold prices are entering a healthy technical correction after failing to break above the resistance zone near the all-time high around 4,330 USD. On the daily timeframe, the uptrend structure remains intact, as higher lows are still being formed and price continues to fluctuate within a medium-term ascending channel.
The current pullback mainly reflects short-term profit-taking pressure as gold approached a psychologically and technically sensitive zone. The 4,245 – 4,216 USD area is acting as a key support, converging with the 0.236 Fibonacci retracement of the latest rally and short-term moving averages. The fact that price is correcting without breaking this zone suggests that large capital is still patiently holding positions.
For a new bullish cycle to form, gold needs to hold firmly above the above-mentioned support zone and achieve a clear daily close above 4,330 USD. At that point, the market would return to a “price discovery” phase, opening room for a move toward new highs.
On the risk side, if the 4,216 USD level is decisively broken, the correction could extend toward 4,130 – 3,970 USD (Fibonacci 0.236–0.382). This would represent a trend rebalancing correction, not sufficient to reverse the medium-term trend unless the higher-low structure is clearly violated.
In terms of indicators, RSI remains above the neutral zone, indicating that the uptrend is still under control. However, short-term momentum is cooling, which aligns with the current consolidation and corrective environment.
Gold is correcting within an uptrend, not reversing. This phase requires patience and discipline—the market rewards positions that align with structure, not emotion.
That concludes the article. Wishing readers a productive and happy working day!
SELL XAUUSD PRICE 4317 - 4315⚡️
↠↠ Stop Loss 4321
→Take Profit 1 4309
↨
→Take Profit 2 4303
BUY XAUUSD PRICE 4245 - 4247⚡️
↠↠ Stop Loss 4241
→Take Profit 1 4253
↨
→Take Profit 2 4259

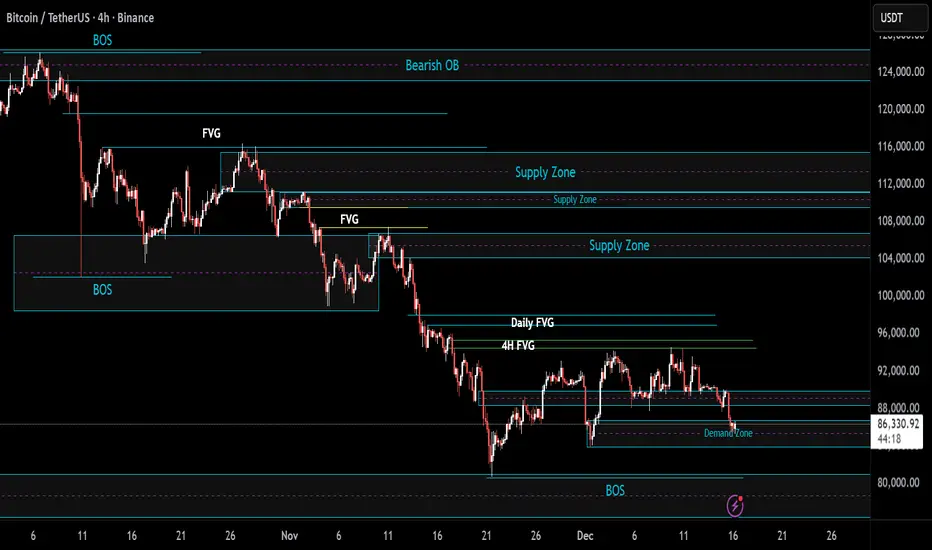
BTC/USDT | Bears in control? (READ THE CAPTION)Good day folks, hope you're doing okay.
As you can see and I previously mentioned, BTC dropped to the demand zone and now it's being traded at 86,560 level.
However, it is yet to break out of the demand zone, if it fails to do so, a drop to the low of the demand zone at 83,860 is possible. If it goes up, it'll be met by the FVG at 88,350.
4H ascending triangle pattern, be cautious when shorting.#XAUUSD OANDA:XAUUSD TVC:GOLD
The medium- to long-term bullish outlook remains unchanged, influenced by the continuous increase in gold holdings by central banks around the world. Gold prices are currently testing the short-term resistance level of 4345 again, and many people may short gold at this level once more. However, from a longer time frame perspective, the trend may have formed an ascending triangle structure. Once it breaks through 4345, the gold price may further test the previous high of 4370-4380, or even reach a new high. Therefore, avoid blind trading in the short term. A prudent trading strategy would still be to consider going long on gold after it retraces to the short-term support level of 4330-4320. Of course, if the price of gold rises sharply to near the previous high, you can also try shorting with a small position.
In summary, the current market requires a flexible approach, with buying on dips being the primary strategy and selling on rallies only as a secondary measure. The focus this week is tomorrow's NFP data.
