Last XPT Options Insights & What They Mean for Precious MetalsPlatinum Options showed unusual activity last week — and it’s worth your attention.
Why focus on platinum?
It’s a traditional institutional instrument, with minimal retail presence.
Check your terminal: compare spreads in PL vs. gold or silver — you’ll see the difference.
Low liquidity → less noise → clearer signals from funds and smart money.
And here’s the key:
Platinum often leads the way.
Its moves and positioning frequently foreshadow broader precious metals trends.
🔍 What Are We Seeing Now?
Large structured plays emerged in platinum, targeting a range between 1,750 and 2,200.
Most portfolios are hedged, which tells us:
“We’re bullish long-term — but expect pullbacks before the main move.”
This isn’t speculation.
It’s strategic positioning with risk management built in.
📌 In short:
They believe in higher prices — just not in a straight line.
💡 Silver: Similar Sentiment
The same bias appears across the asset- Bullish call spreads actively traded
Targets:
Silver: $65–85
Horizon: from 16 days to March 2026
🧠 Final Takeaway:
Platinum has already spoken. Precious metals bias is bullish, but a price decline is expected.
Commodities

Silver Potential Bullish ContinuationAfter a considerable retracement, Silver price still seems to exhibit signs of overall potential Bullish momentum as the price action may form a credible Higher Low with multiple confluences through key Fibonacci Levels, Higher timeframe Harmonic Projections and Support levels which presents us with a potential long opportunity.
Trade Plan:
Timeframe : 1D
Entry : 61.204
Stop Loss : 55.64
TP 1 : 66.768
TP 2 : 72.315

BTC/USD – H2 Analysis ...BTC/USD – H2 Analysis (According to my chart)
Market Structure
Price is below the Ichimoku cloud, indicating bearish control.
Lower highs and lower lows → downtrend continuation.
Recent pullback into the cloud looks like a sell-on-rally setup.
---
📉 Sell Scenario
Sell Zone: 87,500 – 88,300
🎯 Targets
Target 1: 83,000
Target 2: 81,000
---
❌ Invalidation
A strong H2 close above 89,500 will invalidate this bearish setup.
---
📌 Summary
Trend: Bearish
Bias: SELL
Expectation: Price to move down toward the marked demand zone near 81k

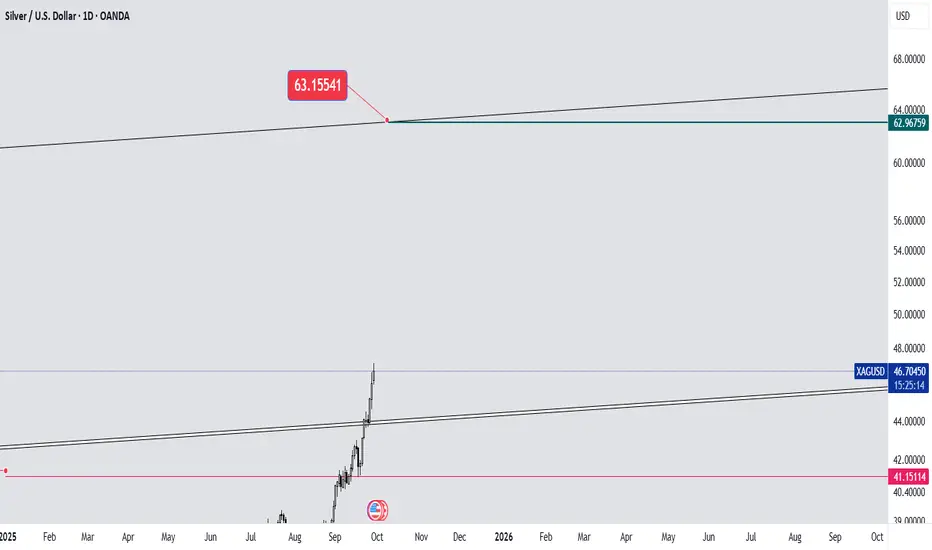
What has caused silver to grow faster than gold?Considering the fluctuations of silver and the price movement model and the silver chart, it is reporting a price movement towards a price target in the range of $87 per ounce!
What seems to be the main question is why the price of silver is moving faster than gold and why does silver need to fill its price growth gap with gold at this time??!!
The link below is the path to past silver analysis:

What is seen in the silver chart!!!The prospect of $62 per ounce of silver is very much on the horizon, but will this price growth be as fast as the price of silver has ever seen? You can read the factors that contribute to the realization of this prospect after reviewing international articles, but I do not think it will be too early to reach this silver rate!
USD/JPY – H3 Analysis....USD/JPY – H3 Analysis (According to My chart)
Market Structure
Price is moving inside a descending channel.
Multiple rejections from the upper channel + resistance zone.
Price is below/inside the Ichimoku cloud, showing weak bullish momentum.
Overall bias remains bearish continuation.
---
📉 Sell Scenario
Sell Zone: 155.50 – 156.10
🎯 Targets
Target 1: 153.00
Target 2: 152.20
---
❌ Invalidation
A strong H3 close above 156.80 will invalidate the sell setup.
---
📌 Summary
Trend: Bearish
Bias: SELL
Expectation: Price to move down toward lower demand zone near 153 area

GOLD DAILY CHART ROUTE MAPPlease see our Daily chart route map that we are tracking.
Price is currently playing between the longer daily chart range 4259 and 4444, with the channel half-line acting as primary support.
We have a body close above 4259 leaving a long range gap open above at 4444 and will need ema5 lock to further confirm and strengthen this.
This is the beauty of our Goldturn channels, which we draw in our unique way, using averages rather than price. This enables us to identify fake-outs and breakouts clearly, as minimal noise in the way our channels are drawn.
We will use our smaller timeframe analysis on the 1H and 4H chart to buy dips from the weighted Goldturns for 30 to 40 pips clean. Ranging markets are perfectly suited for this type of trading, instead of trying to hold longer positions and getting chopped up in the swings up and down in the range.
We will keep the above in mind when taking buys from dips. Our updated levels and weighted levels will allow us to track the movement down and then catch bounces up using our smaller timeframe ideas.
Our long term bias is Bullish and therefore we look forward to drops from rejections, which allows us to continue to use our smaller timeframes to buy dips using our levels and setups.
Buying dips allows us to safely manage any swings rather then chasing the bull from the top.
Thank you all for your likes, comments and follows, we really appreciate it!
Mr Gold
GoldViewFX

Gold Price Analysis - Key Supply & Demand Zones in FocusGold is trading inside a rising channel and currently consolidating below the 4335-40 resistance zone which aligns with the channel top and recent weak highs. Price structure shows mixed momentum indicating indecision after the strong impulsive rally.
As long as gold holds above 4,300–4,295 the bias remains range-to-slightly bullish, but a clear break above 4340-50 is needed to open the upside toward 4380+. Failure to break higher may lead to a pullback toward 426550 with a deeper correction possible toward 4225–4185 (strong demand zone).
📊 Technical Summary
Gold remains bounded within an ascending channel with key horizontal levels playing out:
- Strong Resistance: 4335–4340 (recent highs + channel top)
- Near Support: 4300–4295 (minor demand)
- Deeper Support Zones: 4265–4250 → 4225–4185
Note
Please risk management in trading is a Key so use your money accordingly. If you like the idea then please like and boost. Thank you and Good Luck!

XAGUSD_Silver_BuySilver still short-term buying to complete the uptrend
The important number can be considered 65,500 for the target 67,400

XAUUSD H1 | Bearish Reaction Off Key Pullback ResistanceMomentum: Bearish
Price is currently within the ichimoku cloud.
Sell entry: 4,296.63
- Strong pullback resistance
- 50% Fib retracement
- 78.6% Fib projection
- Fair value gap
Stop Loss: 4,318.39
- Multi-swing high resistance
Take Profit: 4,271.63
- Swing low support
High Risk Investment Warning
Stratos Markets Limited (tradu.com/uk ), Stratos Europe Ltd (tradu.com/eu ):
CFDs are complex instruments and come with a high risk of losing money rapidly due to leverage. 70% of retail investor accounts lose money when trading CFDs with this provider. You should consider whether you understand how CFDs work and whether you can afford to take the high risk of losing your money.
Stratos Global LLC (tradu.com/en ): Losses can exceed deposits.
Please be advised that the information presented on TradingView is provided to Tradu (‘Company’, ‘we’) by a third-party provider (‘TFA Global Pte Ltd’). Please be reminded that you are solely responsible for the trading decisions on your account. Any information and/or content is intended entirely for research, educational and informational purposes only and does not constitute investment or consultation advice or investment strategy. The information is not tailored to the investment needs of any specific person and therefore does not involve a consideration of any of the investment objectives, financial situation or needs of any viewer that may receive it. Past performance is not a reliable indicator of future results. Actual results may differ materially from those anticipated in forward-looking or past performance statements. We assume no liability as to the accuracy or completeness of any of the information and/or content provided herein and the Company cannot be held responsible for any omission, mistake nor for any loss or damage including without limitation to any loss of profit which may arise from reliance on any information supplied by TFA Global Pte Ltd.

XAG Analysis
Here is my view for today on XAG.
As per the previous analysis the purple line is important resistance as you see we have had a few reactions on 4h timeframe. need to see how its gonna pass this resistance area and with confirmation decide whether to enter or wait.
Check the yesterday's analysis and How much did yo guys made with our last analysis? ;)
Stay tuned for our next updates.

Gold (XAUUSD) — Structured Long After PullbackGold (XAUUSD) — Structured Long After Pullback
Gold continues to trade within a stable bullish structure despite local pullbacks and intraday volatility. The current situation is not an impulsive “buy the breakout” scenario, but a controlled and structurally justified long formed after a corrective phase.
Market context
After a strong bullish impulse, price entered a corrective leg. During this phase, the market removed weak downside liquidity and transitioned into a balanced consolidation zone. This behavior typically precedes continuation moves when the broader structure remains intact.
Why this setup is considered structured
This idea is based on market structure rather than momentum chasing. Price is currently positioned in a zone where risk boundaries can be clearly defined and invalidation levels are visible. The setup assumes continuation only while the structure holds.
What the indicator highlights
The indicator interprets the current price behavior as a structured long scenario with predefined trade components.
Entry is aligned with the active structure.
Stop Loss is placed at the point where the structure would be invalidated.
Take Profit is projected toward the next expansion area based on historical price behavior.
The goal is not to predict price, but to engage only when the market provides a measurable and controlled risk-to-outcome profile.
Statistical context
On-chart performance metrics provide historical context for similar trade configurations, including win rate, profit factor, drawdown, and total trades. These statistics are used as analytical support, not as a performance guarantee.
Execution logic
This idea represents a continuation-oriented long scenario. It remains valid only while the underlying structure is respected. If invalidation occurs, the scenario is considered canceled rather than adjusted.
Important notice: This publication represents market analysis and educational insight only. It is not financial advice and does not guarantee profitability. Past performance does not guarantee future results. Always apply proper risk management.

Gold: Bulls taking a breather? Watch for a pullback.This looks like a bull trap. If price can't break through this red box, I'm expecting a pullback to 4,300 to grab some liquidity.
- Resistance: 4,330 - 4,340 (Red Box)
- Support Target: 4,303.74

SILVER SHORT FROM RESISTANCE
SILVER SIGNAL
Trade Direction: short
Entry Level: 6,544.8
Target Level: 6,229.1
Stop Loss: 6,754.8
RISK PROFILE
Risk level: medium
Suggested risk: 1%
Timeframe: 1h
Disclosure: I am part of Trade Nation's Influencer program and receive a monthly fee for using their TradingView charts in my analysis.
✅LIKE AND COMMENT MY IDEAS✅

XAU/USD | Get Ready for $4400 Target and Beyond! (READ)By analyzing the #Gold chart on the 4 hour timeframe, we can see that price moved exactly as expected. Gold first made a small pullback and dropped to the $4290 demand zone. As soon as price reached this key area, strong buying pressure came in and gold successfully hit the first target at $4343.
So far, this analysis has delivered more than 500 pips in profit. I expect gold to continue moving higher. Even though price is currently inside a supply zone, the strong momentum suggests a possible breakout. The next upside targets are $4351, $4359, and $4382.
the last TA on TVC:GOLD :
Please support me with your likes and comments to motivate me to share more analysis with you and share your opinion about the possible trend of this chart with me !
Best Regards , Arman Shaban

Buy on dips as the ascending triangle pattern remains intact#XAUUSD TVC:GOLD OANDA:XAUUSD
Despite yesterday's data releases, the overall long-term trend remains unchanged. Gold prices are currently standing above the daily MA5 and MA10 again, indicating a short-term market bias towards upward movement. Therefore, our trading strategy will continue to focus on buying on dips. While bullish, we will avoid chasing rallies. The 4345-4355 level remains a key short-term resistance level. Short-term support levels to watch are 4320-4305. If gold prices pull back to these levels during the European session, consider going long on gold

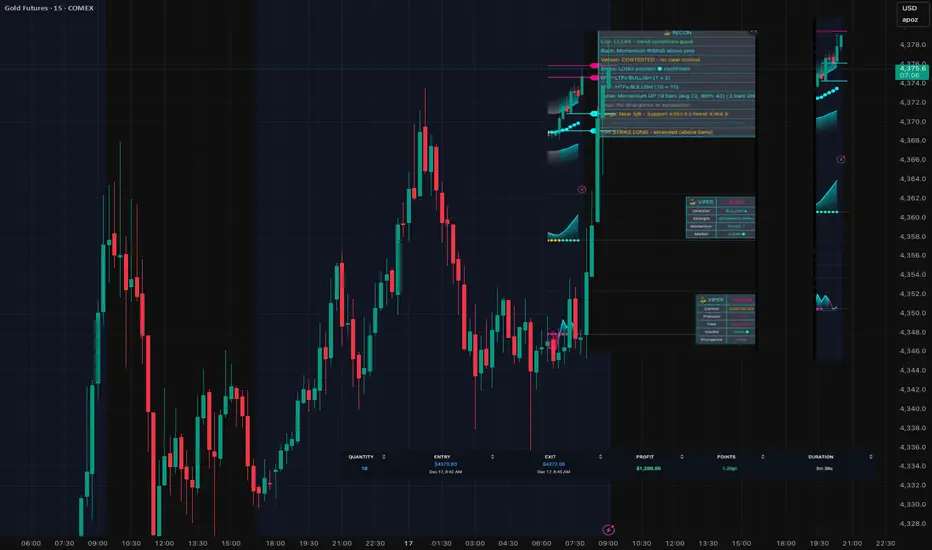
SignalViper Suite — Quick Scalp on Gold FuturesSignalViper Suite — Quick Scalp on Gold Futures (GC)
3-minute trade.
$1,200 profit.
Here's the setup:
RECON showed full alignment:
• Coil: CLEAR — no chop
• Strike: LONG confirmed
• Rush: Momentum RISING
• MTF: All timeframes bullish
• Fangs: Near key S/R levels
The missing piece? Venom was showing CONTESTED — buyers and sellers fighting for control.
I waited.
Next bar, Venom flipped to BUYERS.
That was my trigger. Entry: 4370.80 Exit: 4372.00 Duration: 3 minutes
Result: +1.20 pts on my Apex Trader Fund account. No guessing. No FOMO. Just waited for all 8 indicators to align, then executed. That's what confluence looks like.
GOLD: Short Trading Opportunity
GOLD
- Classic bearish formation
- Our team expects fall
SUGGESTED TRADE:
Swing Trade
Sell GOLD
Entry Level - 4344.79
Sl - 4352.4
Tp - 4328.6
Our Risk - 1%
Start protection of your profits from lower levels
Disclosure: I am part of Trade Nation's Influencer program and receive a monthly fee for using their TradingView charts in my analysis.
❤️ Please, support our work with like & comment! ❤️

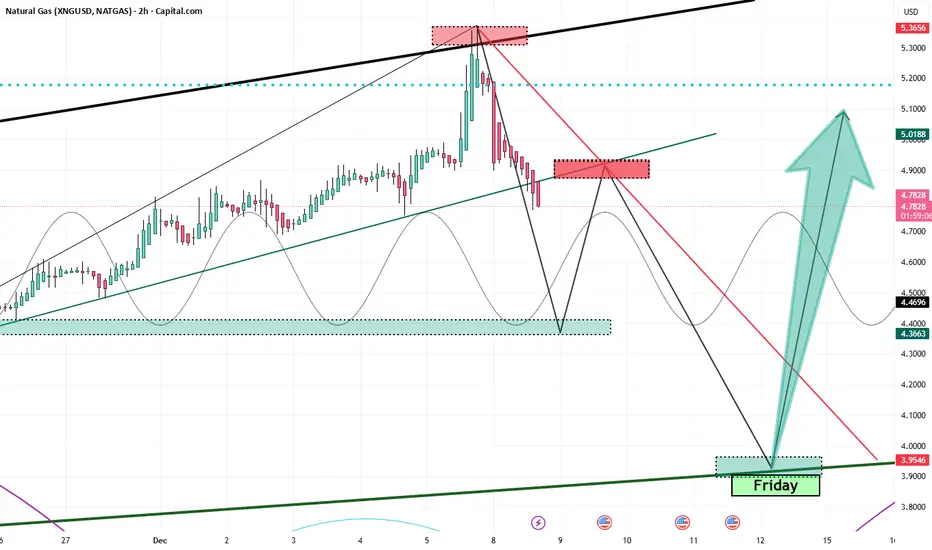
Wild Friday and the Weekly HammerFrom a technical-geometric standpoint, Natural Gas is approaching a high-confidence inflection zone. The weekly hammer forming into Friday’s close (12.12.2025) signals potential exhaustion of the recent downside leg and early signs of demand stepping back in.
Descending from 5.33 as expected, the move has unfolded cleanly, and the red candle opening on Monday—exactly in line with the anticipated flow—reinforces the directional bias of the current retracement phase
The end-goal for this corrective leg is anchored at 3.90, which stands out as the dominant liquidity objective. The structure shows a high—if not near-certain—probability of a retracement into that zone, consistent with the broader technical roadmap already outlined.
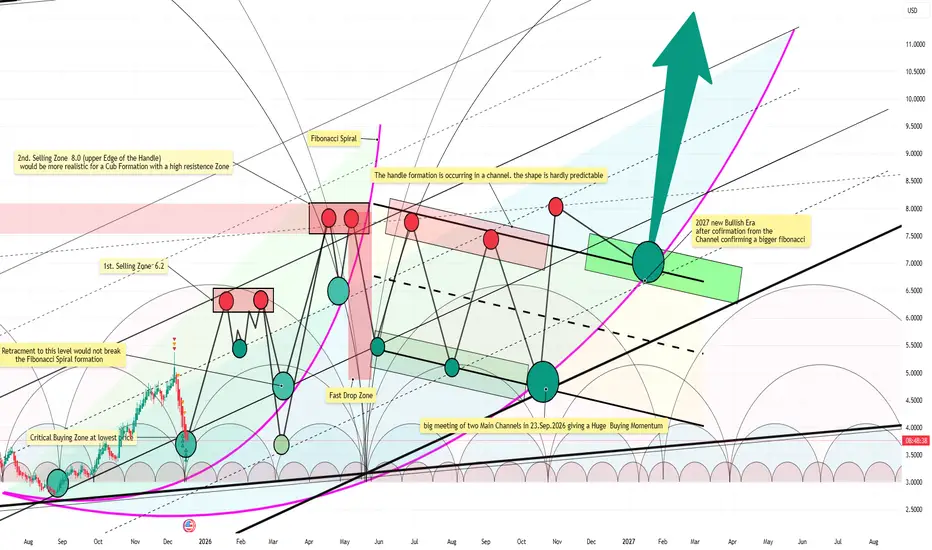
THE SETUP: 2026 CUP and Handel Formation (most realistic)This observation has crossed a threshold.
It is no longer merely "trading ideas" or speculative commentary.
We are witnessing the most structurally significant formation of the cycle a multi-stage Handle and Channel Convergence setting the stage for a historic move.
The alignment of a historic Cup & Handle replication, within a 10-year Fibonacci framework, at the meeting point of macro channels, creates a scenario that demands a higher level of consideration. It presents a probability that is now too significant to ignore.
Phase 1: The Final Exhaustion Drop
Price is rejected from the massive 8.0 resistance wall. This isn't just a normal pullback.
Why it drops fast: This sell-off represents the final liquidation wave of the previous bear cycle. Weak hands capitulate, and late sellers scramble for the exit, creating a sharp, high-volume descent into the formation. This rapid drop is necessary to flush out the last remnants of selling pressure.
Phase 2: The Energy Channel (The "No-Return" Zone)
The price enters the Handle channel, a defined equilibrium zone where the final sell orders are absorbed.
This is where the major trend channels converge. Once price consolidates here and breaks north, there is no logical support left to retest—it becomes a one-way trajectory. The "no-return point."
Phase 3: The Launchpad
This entire structure acts as a rocket launch base, compressing energy for the next macro leg up confirming a bogger Fibonacci. The completion of this base targets a powerful ignition in January 2027.
This is not trading advice or signal at all
This is the identification of a mathematical and structural precedent that now stands, clear and present, on the chart. The responsibility for any action taken—or not taken—rests solely with the individual.
The market is a mechanism.
This is how its gears are aligning.
XAU/USD Facing Decision Time – Volatility AheadThe Gold chart shows that the price is trading near a strong resistance zone after completing several impulsive waves inside an upward channel. The structure suggests Gold is likely finishing a Wave (3) or Wave (5) near the top, where selling pressure usually appears. The recent sideways-to-down movement looks like a developing Wave (4) correction, which could lead to a deeper pullback before the next big move. If the price fails to break and hold above the resistance zone, Gold may continue lower toward the lower channel support. However, if buyers push the price higher and break above the resistance cleanly, one more upside leg could form before a larger correction. Overall, the chart signals short-term weakness inside a bigger bullish structure, so caution is needed near the highs.
Stay tuned!
@Money_Dictators
Thank you :)

Soybeans: Buy the dip!Soybeans are oversold enough after a correction, it seems like everyone was too hyped with the prospect of China buying US beans and some weak longs capitulated in this retrace.
This is my technical prognosis from here to June 2026 or sooner.
RR is very interesting.
Best of luck!
Cheers,
Ivan Labrie.

The Gold–Silver Ratio: The Market Signal Most Traders IgnoreMany traders treat Gold (XAUUSD) and Silver (XAGUSD) as the same trade with different volatility.
That’s a mistake.
Gold and Silver respond to different macro forces, and understanding when capital rotates from one to the other gives a serious edge — both for trading and physical investing.
1️⃣ Gold vs Silver — Core Difference
Gold = Monetary metal
Store of value
Inflation hedge
Central bank asset
Safe haven during stress
Silver = Hybrid metal
Part monetary
Part industrial
High beta version of gold
More sensitive to growth cycles
This single difference explains why silver moves faster and further than gold — in both directions.
2️⃣ When to Trade GOLD (XAUUSD)
Gold performs best when fear and monetary uncertainty dominate.
Bullish Gold Environment:
Falling or expected rate cuts (Fed pivot)
Rising inflation or sticky CPI
USD weakness
Geopolitical risk (wars, sanctions, OPEC supply risks)
Equity market stress or drawdowns
Trader mindset:
Gold moves first, cleaner, more technically respected.
Best use:
Swing trades
Trend continuation
Capital protection during risk-off phases
Physical gold bars:
Best accumulated when:
Real rates peak
Fed is restrictive but close to easing
Media interest is low (no gold hype)
3️⃣ When to Trade SILVER (XAGUSD)
Silver thrives when liquidity + growth expectations return.
Bullish Silver Environment:
Fed easing or liquidity injections
Improving PMI / industrial demand
Tech expansion (AI, EVs, solar panels)
Rising copper and industrial metals
Risk-on equity sentiment (SP500 strength)
Silver benefits from:
Industrial usage (electronics, AI chips, solar)
Smaller market → easier to push
Speculative flows
Trader mindset:
Silver is late but explosive.
Best use:
Momentum trades
Breakout strategies
Relative strength vs Gold
Physical silver bars:
Best accumulated when:
Gold/Silver Ratio is extremely high
Economy is weak but stabilizing
Nobody wants silver (yet)
4️⃣ Why Silver Often Outperforms Gold
Even though gold is more precious:
Silver supply is tighter relative to demand
Industrial demand is growing structurally (AI, green energy)
Silver market is much smaller → higher volatility
Speculators prefer silver during risk-on cycles
📌 Key metric:
Gold/Silver Ratio
High ratio → Silver undervalued
Falling ratio → Silver outperforming Gold
5️⃣ Gold vs Silver Rotation Framework
Simple rule:
Risk-off → Buy Gold
Early recovery → Gold first
Liquidity expansion → Silver explodes
Late-cycle euphoria → Reduce Silver first
Gold leads.
Silver accelerates.
6️⃣ Macro Context That Matters
Fed: Rates & liquidity decide direction
USD: Inverse correlation for both metals
SP500: Risk appetite indicator
Oil (OPEC): Inflation transmission → Gold support
Earnings cycles: Growth optimism favors Silver
Final Takeaway (Trader Language)
Trade Gold for safety, structure, and macro clarity.
Trade Silver for speed, volatility, and expansion phases.
Buy physical gold when fear is high.
Buy physical silver when nobody cares — before liquidity returns.
Gold protects wealth.
Silver multiplies it — at the right time.
Relevant Hashtags
#Gold #Silver #XAUUSD #XAGUSD #MacroTrading #TradingStrategy #Fed #SP500 #Commodities #Inflation
