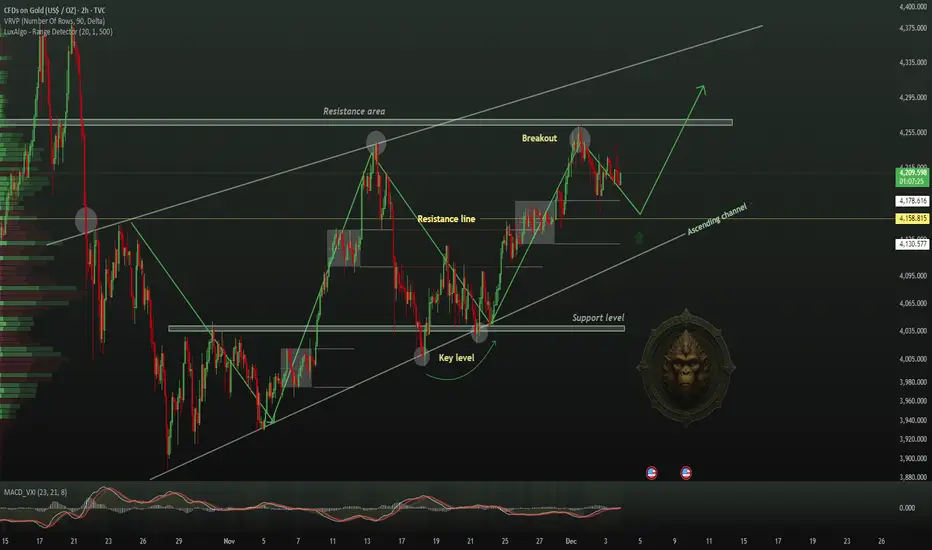
GOLD BUY | Idea Trading AnalysisGOLD is moving in an ascending channel and creating symmetrical triangle and is moving in a descending AND is moving in an UPWARD channel.
We expect a decline in the channel after testing the current level.
Hello Traders, here is the full analysis.
I think we can soon see more fall from this range! GOOD LUCK! Great BUY opportunity GOLD
I still did my best and this is the most likely count for me at the moment.
-------------------
Traders, if you liked this idea or if you have your own opinion about it, write in the comments. I will be glad
Commodities
USOIL H4 | Heading Towards Pullback ResistanceMomentum: Bearish
The price is rising towards the sell entry, which acts as a pullback resistance, and also trading below the Ichimoku cloud, which is a good sign of bearish momentum.
Sell entry: 57.31
Pullback resistance
Slightly above the 38.2% Fibonacci retracement
Stop loss: 58.16
Overlap resistance
Slightly below the 61.8% Fibonacci retracement
Take profit: 55.17
Pullback support
High Risk Investment Warning
Stratos Markets Limited (tradu.com ), Stratos Europe Ltd (tradu.com ):
CFDs are complex instruments and come with a high risk of losing money rapidly due to leverage. 70% of retail investor accounts lose money when trading CFDs with this provider. You should consider whether you understand how CFDs work and whether you can afford to take the high risk of losing your money.
Stratos Global LLC (tradu.com ): Losses can exceed deposits.
Please be advised that the information presented on TradingView is provided to Tradu (‘Company’, ‘we’) by a third-party provider (‘TFA Global Pte Ltd’). Please be reminded that you are solely responsible for the trading decisions on your account. Any information and/or content is intended entirely for research, educational and informational purposes only and does not constitute investment or consultation advice or investment strategy. The information is not tailored to the investment needs of any specific person and therefore does not involve a consideration of any of the investment objectives, financial situation or needs of any viewer that may receive it. Past performance is not a reliable indicator of future results. Actual results may differ materially from those anticipated in forward-looking or past performance statements. We assume no liability as to the accuracy or completeness of any of the information and/or content provided herein and the Company cannot be held responsible for any omission, mistake nor for any loss or damage including without limitation to any loss of profit which may arise from reliance on any information supplied by TFA Global Pte Ltd.

GOLD ANALYSIS 12/18/20251. Fundamental Analysis:
a) Economic:
• USD: After the previous weakening phase, the USD is showing a short-term technical rebound. However, upside momentum remains limited as the market has already priced in most FED expectations.
• U.S. Equities: Moving sideways, with defensive capital flows and a lack of breakout momentum → no strong selling pressure on gold.
• FED: Has entered an easing cycle; the medium–long-term trend continues to support gold. In the short term, the market remains cautious, waiting for new data.
• TRUMP: No new shock policies; political factors are temporarily neutral for gold.
• Gold ETF (SPDR): Yesterday saw a net inflow of 0.86 tons, indicating that large capital is still quietly accumulating rather than exiting gold.
b) Politics:
• Geopolitical tensions have not escalated further, but latent risks remain → gold continues to hold its role as a defensive asset.
c) Market Sentiment:
• Approaching Christmas and New Year, markets are quiet with thin liquidity, increasing the risk of noise and stop-loss hunting.
• Overall sentiment: capital preservation is preferred over aggressive trading; small positions or staying on the sidelines are favored.
2. Technical Analysis:
• The primary trend remains gradually bullish within an ascending price channel.
• Price is holding well above the rising trendline, trading above key MAs, with the higher-low structure intact.
• Supply zone: Around 4350 – 4355; price has reacted multiple times here, making it a strong resistance area.
• Demand zone: Around 4260 – 4263; a previous accumulation area and an important structural low.
• RSI remains in the neutral–high zone, not yet overbought → room for further upside if capital flows in.
⇒ Technical Scenarios:
• A decisive break above the supply zone → opens the possibility of testing 4380 – ATH.
• Failure to break → price may pull back technically to the trendline / demand zone before continuing higher.
RESISTANCE: 4,351 – 4,380 – 4,400
SUPPORT: 4,330 – 4,309 – 4,288
3. Previous Market Session (17/12/25):
• Price gradually moved higher within a narrow range, without any strong breakout.
• Declining volume → confirms the year-end environment and cautious trading behavior.
• No signs of major distribution; bias remains toward high-level accumulation.
• The 4,309 level previously identified held price very well.
4. Today’s Strategy (18/12/25):
🪙 SELL XAUUSD | 4382 – 4380
SL: 4386
TP1: 4374
TP2: 4368
🪙 BUY XAUUSD | 4301 – 4303
SL: 4297
TP1: 4309
TP2: 4315

XAUUSD Distribution Phase – Watch for BreakdownXAUUSD is consolidating near a key supply zone. Rejections at resistance suggest sellers are active. A breakdown may trigger bearish continuation toward lower demand.
risk management is important

Trump's surprise announcement fuels demand for safe havensOANDA:XAUUSD entered a strong and decisive upward trend as two major risks – weakening US economic conditions and escalating geopolitical tensions – converged simultaneously.
In the Asian session on December 18th, spot gold prices remained above $4,330/ounce, following a sharp rise from the previous session. The impetus didn't come from a single factor, but rather a combination of worse-than-expected US labor market signals and a surprisingly tough statement from President Donald Trump regarding Venezuela.
The US non-farm payrolls report released earlier this week presented a mixed picture, but one that was enough to prompt market adjustments to expectations. While 64,000 new jobs were created in November, exceeding forecasts, the unemployment rate surged to 4.6%, its highest level since 2021. This is no longer just technical noise. Unemployment exceeding both market forecasts and the Fed's end-of-year scenarios has raised concerns that the lag in monetary tightening is beginning to erode the labor market.
Against this backdrop, expectations of another Fed easing cycle have returned. Gold, a non-yielding asset, has benefited immediately. The market is still pricing in at least two interest rate cuts in 2026, despite attempts by Fed officials, including Governor Christopher Waller, to cool expectations with the message "no need to rush." This stance offers policy stability, but is not enough to reverse the defensive sentiment that is forming in financial markets.
The real trigger came from geopolitics. Trump's declaration of a "complete blockade" of sanctioned oil tankers entering and leaving Venezuela quickly triggered safe-haven demand. While the extent of its implementation on the ground was unclear, the market perceived it as a policy escalation, bordering on a military-style coercive action. Legal debates immediately erupted in Washington, but for the market, that was secondary: the risk had already been priced in.
Against the backdrop of a slowing US economy, a new turning point in monetary policy, and increasingly unpredictable geopolitics, gold is fulfilling its historical role: absorbing uncertainty. The current rally isn't driven by euphoria, but rather by a systematic defensive reaction. And as long as these variables remain unclear, gold will continue to be a destination for investment whenever confidence in stability is challenged.
Technical Analysis and Suggestions OANDA:XAUUSD
Gold prices are at a crucial turning point in their cycle. After touching and repeatedly testing the historical peak around $4,380 per ounce, the market is showing a clear reality: long-term buying pressure remains, but the short-term upward momentum is slowing down.
On the daily chart, the dominant uptrend remains intact with a structure of higher lows following higher lows, price moving within a medium-term uptrend channel and above key moving averages. However, the repeated failure of the price to definitively close above 4,380 suggests that this area is not only a technical resistance but also a psychological profit-taking zone for large investors.
Using Fibonacci extension from the most recent major uptrend:
• The 1.0 level around $4,380 is the confirmation point for breaking the previous high.
• If gold closes the day clearly above $4,380, the next targets open up at:
o 0.786 around $4,715
o 1.0 extension around $4,940/ounce
These are the areas where the market will shift from technical trading to macroeconomic expectation trading, where interest rate narratives, geopolitics, and confidence in fiat currency play a leading role.
Conversely, the risk of a short-term correction is present. The RSI remains above the neutral zone but has not generated new momentum, reflecting a period of consolidation rather than distribution. If gold fails to break above $4,380 and loses the $4,300-$4,280 support zone, a technical correction scenario could push the price back to:
• $4,245-$4,216 (Fibo 0.236, dynamic support zone)
• Further down to $4,130-$4,100, where the uptrend line and defensive buying converge.
Importantly: this is still considered a correction within an uptrend, not yet a signal of a structural reversal.
At this stage, gold has no shortage of reasons to rise, but the market is demanding greater patience and discipline. Chasing prices at historical highs is a risky strategy; waiting for confirmation or a correction remains a more sensible approach given geopolitical volatility and rapidly changing interest rate expectations.
SELL XAUUSD PRICE 4382 - 4380⚡️
↠↠ Stop Loss 4386
→Take Profit 1 4374
↨
→Take Profit 2 4368
BUY XAUUSD PRICE 4311 - 4313⚡️
↠↠ Stop Loss 4307
→Take Profit 1 4319
↨
→Take Profit 2 4325

Daily Hammer ?daily hammer is forming its shape by closing the day close to this level we are in now and tomorrow is the safest retracment we can buy in the 2nd green day candle. it fail to form by crossing the 4.0

Heading towards pullback resistance?WTI Oil (XTI/USD) is rising towards the pivot, which acts as a pullback resistance and could reverse to the 1st support.
Pivot: 57.45
1st Support: 55.20
1st Resistance: 58.51
Disclaimer:
The opinions given above constitute general market commentary and do not constitute the opinion or advice of IC Markets or any form of personal or investment advice.
Any opinions, news, research, analyses, prices, other information, or links to third-party sites contained on this website are provided on an "as-is" basis, are intended to be informative only, and are not advice, a recommendation, research, a record of our trading prices, an offer of, or solicitation for, a transaction in any financial instrument and thus should not be treated as such. The information provided does not involve any specific investment objectives, financial situation, or needs of any specific person who may receive it. Please be aware that past performance is not a reliable indicator of future performance and/or results. Past performance or forward-looking scenarios based upon the reasonable beliefs of the third-party provider are not a guarantee of future performance. Actual results may differ materially from those anticipated in forward-looking or past performance statements. IC Markets makes no representation or warranty and assumes no liability as to the accuracy or completeness of the information provided, nor any loss arising from any investment based on a recommendation, forecast, or any information supplied by any third party

Gold 1H – Fed Signals Fuel Liquidity Games Around 4350–4300🟡 XAUUSD – Intraday Smart Money Plan | by Ryan_TitanTrader (18/12)
📈 Market Context
Gold is trading inside a controlled liquidity range as markets react to fresh speculation around the Fed Chair’s stance on rate timing and inflation persistence.
Recent headlines suggest the Fed remains data-dependent despite easing inflation narratives, keeping USD flows choppy and positioning fragile. This backdrop typically favors engineered stop-hunts rather than clean trend continuation, especially around well-defined premium and discount zones.
Smart Money is likely to probe both sides of liquidity before committing to directional expansion.
🔎 Technical Framework – Smart Money Structure (1H)
Current Phase: Rising structure, pausing near premium after BOS
Key Idea: Expect liquidity interaction at 4350–4353 (premium) or 4302–4300 (discount) before displacement
Structural Notes:
• Higher-timeframe BOS keeps bullish context intact
• Recent range shows distribution near highs, not confirmed reversal
• Equal highs near 4350 and sell-side liquidity resting below 4300 are exposed
Liquidity Zones & Triggers:
• 🔴 SELL SCALP 4350 – 4353 | SL 4360
• 🟢 BUY GOLD 4302 – 4300 | SL 4290
Institutional Flow Expectation:
sweep → MSS / CHoCH → BOS → displacement → FVG / OB retest → expansion
🎯 Execution Rules (matching your exact zones)
🔴 SELL SCALP 4350 – 4353 | SL 4360
Rules:
✔ Liquidity sweep above recent equal highs into premium
✔ Bearish MSS / CHoCH on M5–M15
✔ Clear downside BOS with impulsive displacement
✔ Entry via bearish FVG refill or refined supply OB
Targets:
1. 4325
2. 4310
3. 4302 – extension if momentum builds
🟢 BUY GOLD 4302 – 4300 | SL 4290
Rules:
✔ Liquidity grab below sell-side lows / rising trend support
✔ Bullish MSS / CHoCH confirms demand control
✔ Upside BOS with strong bullish displacement
✔ Entry via bullish FVG fill or demand OB retest
Targets:
1. 4320
2. 4350
3. 4380 – extension if USD softens on Fed commentary
⚠️ Risk Notes
• Fed-related headlines can trigger fake breaks — wait for structure
• Avoid entries without clear MSS + BOS alignment
• Expect higher volatility during U.S. session hours
• Reduce risk near unscheduled Fed headlines or speakers
📍 Summary
Today’s gold setup revolves around Fed-driven liquidity engineering:
• A sweep above 4353 may invite a pullback toward 4302–4310
or
• A liquidity grab near 4300 could reload bullish flow toward 4350+
Let structure confirm — Smart Money reacts, retail anticipates. ⚡️
📌 Follow @Ryan_TitanTrader for daily Smart Money gold breakdowns.

AUUSD → Buyers Defend Structure, Upside Continuation in FocusHello everyone,
Gold is continuing to trade with a constructive tone, and the current structure suggests the bullish trend remains intact. From a macro perspective, the U.S. dollar has softened slightly while Treasury yields have stabilized , reducing downside pressure on non-yielding assets like gold. In an environment where investors remain cautious but not risk-off, gold continues to benefit from its role as both a hedge and a momentum asset .
From a technical standpoint on the H1 chart, price action is clearly supportive of further upside . Gold broke out of a bullish flag pattern after a strong impulsive move , then successfully respected the rising trendline on the pullback . This behavior signals healthy consolidation rather than weakness , with buyers stepping in at higher levels and maintaining control of the broader move.
As long as price holds above the trendline support, the bullish structure remains valid . A continuation above recent highs would open the door toward the 4,385 area, with extension potential toward 4,458 if momentum accelerates. Only a decisive break below the trendline would call for reassessing this bullish outlook .
In summary, XAUUSD is showing a well-organized uptrend supported by both structure and sentiment . Patience and discipline remain key, as the market appears to be positioning for the next leg higher rather than signaling exhaustion .
Wishing you clear judgment, disciplined risk management, and sustainable trading performance.

Crude Oil – Sell around 58.60, target 56.00-55.00Crude Oil Market Analysis:
Given the recent sharp decline on the daily chart for crude oil, our strategy remains unchanged: sell on rallies. We've maintained a bearish outlook on crude oil for several months, during which it has remained relatively stagnant, trading within a narrow range. Today, we'll focus on contract settlement; wait for a rebound to around 58.60 to sell.
Fundamental Analysis:
Today's release of key CPI and unemployment claims data could significantly impact the market.
Trading Recommendation:
Crude Oil – Sell around 58.60, target 56.00-55.00

Gold Is Holding Firm Into Year-End — A Santa Rally Is Setting UpGold on H4 continues to trade in a strong bullish structure, consolidating just below the key resistance zone around the previous high. Price is holding comfortably above the rising EMA base, with higher lows intact, confirming that buyers remain in control despite short-term pullbacks. This sideways-to-higher behavior beneath resistance signals absorption rather than distribution, as selling pressure fails to force acceptance below the support zone. Structurally, this is a classic bullish consolidation, where the market pauses to build liquidity before the next directional move.
From a macro perspective, the setup is supported by typical year-end dynamics. As liquidity thins into the Christmas period, markets often shift into range compression followed by sharp directional expansions. At the same time, expectations around U.S. monetary policy remain tilted toward easing in 2025, keeping real yields capped and limiting sustained USD strength. Combined with ongoing geopolitical and macro uncertainty, this environment continues to favor Gold as a defensive asset.
As long as price holds above the support zone and maintains acceptance below resistance, the bullish bias remains intact. A clean breakout and hold above resistance would likely open the path toward a new ATH, while failure to break simply extends consolidation rather than signaling a top. For now, this is a patience phase OANDA:XAUUSD is not stalling, it is positioning.

Gold Is Trapped Between Control ZonesGold on H1 remains locked inside a clearly defined range, with price oscillating between a well-defended support zone around 4,260 and a heavy resistance band near 4,350–4,360. The broader structure is still constructive, as higher lows continue to form above the rising EMA base, confirming that buyers have not lost control. Repeated failures to accept above resistance show that sellers are active at the highs, compressing price rather than reversing the trend a classic balance phase where liquidity is building on both sides. From a macro perspective, this consolidation aligns with a cautious market stance ahead of key U.S. data and ongoing uncertainty around Fed policy, where neither USD strength nor risk-off flows are decisive enough to force a breakout. As long as real yields remain capped and expectations around rate cuts stay supportive, downside moves in Gold are more likely corrective than trend-breaking. A clean acceptance above the resistance zone would signal macro and technical alignment for expansion toward new highs, while rejection simply prolongs consolidation and reinforces patience. In this environment, chasing moves inside the range offers low edge the opportunity emerges only when price exits the box with clear intent.

Traders Who Follow Their Plan 90% the Time Look VERY DifferentBehind the scenes with prop traders, something interesting showed up in the numbers.
Nothing changed in their strategy. Same setups. Same market.
What changed was this:
-Plan adherence went from about 50% of trades to around 90%
-Rule breaks dropped by about 70%
-Account survival jumped roughly 40% (they stayed funded much longer)
In other words, they didn’t “find a better edge.”
They just actually followed the plan they already had most of the time.
This is why so many traders feel stuck: they keep searching for a new strategy, when the real leak is not doing what they said they would do.
Be honest with yourself for a second:
If you look at your last 20 trades… how many were truly from your plan, and how many were “I’ll just try this”?
Drop your honest guess below as a % (for example: “40% plan / 60% random”).
No judgment, just curious how people see themselves vs what the data usually shows.
Trade Smarter Live Better / Mindbloome Exchange

Gold Enters Controlled Consolidation Within a Bullish StructureGold is no longer advancing in an accelerated manner, but is instead entering a phase of controlled consolidation . This is a natural response following a clear impulsive move, as the market needs time to rebalance supply and demand. Despite a cautious overall sentiment amid mixed macro conditions, capital flows continue to maintain exposure to gold.
On the H1 timeframe , the technical structure continues to support the bullish bias. Price is rotating within a narrow range, with higher lows being preserved , indicating that selling pressure is not aggressive and is largely driven by short-term profit-taking. This suggests that buyers remain in control of the primary move .
Current price action reflects a supply absorption phase . If the upper resistance zone is absorbed and price achieves a clear and decisive close above it , the bullish trend will be reaffirmed, opening the path toward the 4,385 area . Conversely, further sideways movement should not be viewed as a negative signal; a well-formed consolidation base often precedes a more sustainable advance. Only a decisive break below support would require reassessing the bullish scenario.

Gold Is Compressing Under ATH — Macro Is Still on Its SideHello Guys
Gold on H1 remains in a bullish consolidation just below the previous high around 4,380, with price rotating cleanly inside a well-defined range. This structure reflects strength, not exhaustion: pullbacks are shallow, higher lows continue to form, and sellers have failed to generate acceptance below the support zone. Price behavior suggests absorption, where supply is being gradually consumed while the market builds energy for expansion rather than reversing.
From a macro perspective, this consolidation aligns with a supportive backdrop for Gold. Expectations around U.S. monetary policy remain tilted toward easing rather than renewed tightening, keeping real yields capped and limiting USD upside. At the same time, persistent geopolitical and macro uncertainty continues to underpin demand for safe-haven assets. These conditions reduce the probability of a deep corrective sell-off and favor sideways-to-higher price action instead.
As long as Gold holds above the support zone and continues to accept value below ATH, the broader bias remains bullish. A clean acceptance above 4,380 would signal alignment between technical structure and macro conditions, opening the door for a push toward a new ATH. Until that breakout occurs, this remains a patience phase consolidation is the setup, not the signal.
What do you think about OANDA:XAUUSD ?

Gold Is Quiet — And That’s Exactly When Breakouts Are BuiltGold is not breaking out yet — it is building pressure.
After the impulsive move, price is now compressing inside a clear accumulation zone, showing repeated defenses from buyers while sellers fail to push price meaningfully lower. This sideways structure signals absorption rather than weakness. As long as Gold holds above the 4,260–4,270 key zone, the broader bullish structure remains intact and the market is preparing for expansion. A clean break and hold above this range would open the path toward breaking the old ATH. Until that happens, this is a patience phase not a chase phase.

GOLD (XAUUSD): Bullish Accumulation Ahead of Another Wave
Gold is stuck within a tiny horizontal range,
testing a resistance cluster based on a current All-Time High.
I think that a bullish accumulation is currently taking place.
A signal that I am looking for to buy Gold is a breakout
and a daily candle close above 4384 - ATH level.
It will be a strong signal that will push the prices higher.
❤️Please, support my work with like, thank you!❤️
I am part of Trade Nation's Influencer program and receive a monthly fee for using their TradingView charts in my analysis.

SILVER (XAGUSD): Another BoS
Silver did it again.
The price updated the ATH yesterday, breaking and closing above
a major horizontal resistance.
It opens a potential for more growth.
Next resistance will be 68.0
❤️Please, support my work with like, thank you!❤️
I am part of Trade Nation's Influencer program and receive a monthly fee for using their TradingView charts in my analysis.

Gold Stays Bullish — Today Is About Timing, Not DirectionXAU/USD — Market Briefing (H1)
Market State
Gold is holding a bullish continuation structure after completing the ABC correction. Price remains above key moving averages, confirming buyers are still in control. The current price action shows impulsive recovery waves, indicating momentum is rebuilding rather than fading.
Structure Bias
– Trend: Bullish (intraday)
– Price holding above dynamic MA support
– Pullbacks remain corrective, not structural breakdowns
Key Levels
– Resistance / POC: 4,353 – 4,380
– Mid Support (MA): ~4,300
– Demand / Buy Zone: 4,263 – 4,266
Today’s Scenarios
Primary Scenario — Bullish Continuation
– Price continues higher toward the POC / resistance zone
– Short-term pullbacks may occur to absorb supply
– Upside expansion remains the preferred path
Alternative Scenario — Technical Pullback
– Rejection at resistance
– Price pulls back into dynamic MA support
– Structure remains bullish unless MA support fails
Intraday Trading Plan (Dec 17)
Setup 1 — Sell Reaction (Counter-Trend)
– Sell Zone: 4,353 – 4,356
– TP: 4,350 – 4,345
– SL: 4,360
Setup 2 — Buy Continuation
– Buy Zone: 4,263 – 4,266
– TP: 4,269 – 4,274
– SL: 4,259
Gold remains bullish intraday. Focus on buying pullbacks, manage risk carefully near resistance, and avoid chasing price. Structure favors continuation as long as key supports hold.

XAUUSD – Buyers Remain in ControlHello everyone, it’s great to see you again.
Today, the gold market continues to test the new support area around USD 4,300 per ounce and is attracting mild bullish momentum as the U.S. labor market remains relatively stable but shows early signs of slowing. Bearish sentiment toward the U.S. dollar, driven by the Federal Reserve’s accommodative monetary policy, combined with ongoing risk-off sentiment, is providing positive support for the precious metal.
At the time of writing, gold is up around USD 20 from the session low. In the short term, OANDA:XAUUSD maintains a mild bullish trend, with key support levels located at USD 4,270 and USD 4,300.
I remain optimistic in this analysis, with the first upside target at the USD 4,350 resistance level, followed by a potential push toward the record zone around USD 4,375.
And you - what’s your view on gold at this stage?

Is Natural Gas Bull Market Back? Natural gas saw an epic bounce today as 3 major weekly moving averages were defended.
Price action rallied sharply higher off the weekly 20, 50 & 200 MA.
This could be a massive bullish back test before we bounce back to new highs.
Resource stocks showed impressive strength during a day when markets were under pressure.
We have been nibbling on resource stock like we have said in our videos.
Inventories are tomorrow which could set the tone for the next bull rally.

Long Term Silver Bull Going ShortThis post is a follow up to my "Grand Silver Supercycle" chart posted on 2/2/2023. I recommend referencing that chart to understand my commentary here. In that chart, I called for silver to double in price by the end of 2025 and to reach $95 by 2027. Since then, silver has overshot my near term price targets. I'm here to argue that silver has gone up too far too quickly and is due for a sharp pullback to the $50-$55 range.
Why am I calling this the near term top?
Silver has very neatly followed Elliot Wave Theory throughout its history. In 2023, I predicted Wave 3 of the current cycle, which began with the low in the summer of 2022, to have a 1.618 extension of Wave 1. Instead, silver just reached the 2.618 extension, which back in 2023, I thought was too bold of a prediction. While it is possible for a 4.618 extension to 102.5, these extensions are very rare. The bias is towards a pullback here.
There is also a convergence between the Elliot Wave extension, a fib retracement level, and logarithmic trendline. This indicates that any attempts to breakout higher will face strong resistance.
Finally, I need to talk about gold. The monthly RSI has been over 90 for 3 months, closing in on 4 months. Gold has only held an RSI above 90 for 4 consecutive months at one point prior in its charted history. Gold is still silver's big brother and will determine the direction the two move.

Gold (XAUUSD) May Repeat Recent Bullish Pattern of 12 Dec 2025Gold OANDA:XAUUSD May Repeat Recent Bullish Pattern 🔄
What Happened Before (Dec 12, 2025 - 5:41 AM PKT):
Gold formed a very specific pattern that caught my attention. After consolidating in a tight range, it exploded upward with strong momentum, rallying approximately 770 pips from 4,276 to 4,353
The price action showed clear accumulation before the breakout, with bulls stepping in decisively.
What's Happening Now:
Previous:
Here's where it gets interesting - Gold is forming an almost identical pattern at the current price level of 4,341.
The similarities are striking:
- Similar consolidation structure
- Comparable price compression
- Volume patterns showing accumulation
- Technical indicators aligning in the same way
My Expectation:
Based on this pattern repetition, I'm watching for a potential bullish move from 4,339 to 4,416 - roughly 770+ pips of upside.
Invalidation: A break below the consolidation zone would negate this setup
---
*Remember: Past patterns don't guarantee future results. Always use proper risk management and trade with a plan.*
