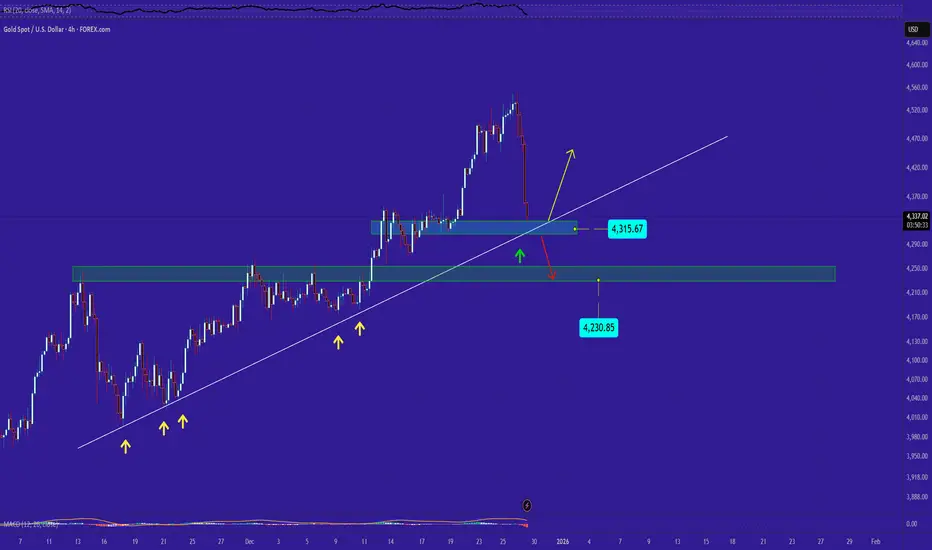
GOLD's SituationFor this drop, we can consider two support levels: one dynamic and one static. I’m hoping the dynamic support line can stop the decline. If not, and the dynamic support is broken, the price may fall down to around 4230.
Commodities
XAUUSD 1H (OANDA): Bull TrendXAUUSD 1H (OANDA): Bull Trend, But Price Is Trapped Under a Weak High – Expect a Sweep or a Deeper Rotation
Gold remains in a strong 1H uptrend overall, but the latest price action is flashing a key short-term warning: the market is consolidating under a marked weak high after a sharp push up. On your chart, the top box shows repeated reactions, multiple CHoCH prints inside the range, and a clear liquidity structure (equal highs/equal lows) that often precedes either:
a liquidity sweep above the weak high to trap breakout buyers, then a selloff, or
a clean breakout with acceptance that continues the bullish trend.
This is a classic “decision zone” where you should trade the edges, not the middle.
Market Structure and Price Behavior
Macro bias (1H): still bullish (the staircase advance with BOS legs is intact).
Current phase: distribution-like consolidation near the highs.
Key observation: the market is “advertising” the weak high. Weak highs are frequently swept before the real move happens.
If price fails to hold the current top-range support, the next move is likely a rotation into the nearest demand bands marked on the chart.
Key Resistance and Support Levels (From the Chart)
Resistance
5,090–5,105: current supply lid / top-range pressure area.
Weak High zone: the marked weak high above the range (primary liquidity target).
5,120: next major upside magnet if a breakout is accepted.
Support
5,060–5,040: immediate pullback support (reaction zone after the sell spike).
5,000–4,980: psychological + structural support (key intraday defense).
4,920–4,900: first highlighted demand band (strong reaction zone if breakdown confirms).
4,820–4,800: second demand band (deeper pullback target).
4,660–4,620: broader base support (trend would weaken significantly if price returns here).
Fibonacci Roadmap (Best Dip-Buy Zones)
Anchor Fibonacci from the latest impulse swing low (around the last major push before the top consolidation) to the recent high:
0.382 typically aligns near the first pullback pocket (often around the 5,040–5,000 region here).
0.5 aligns with the next demand band (commonly around 4,920–4,900).
0.618 often overlaps deeper demand (around 4,820–4,800).
This creates a clean hierarchy:
Hold above 5,000 = shallow correction, trend continuation remains favored.
Lose 5,000 = rotation risk increases toward 4,920 and potentially 4,820.
EMA and RSI Filters (Quick Confirmation Rules)
EMA (use EMA20 and EMA50 on 1H)
Bullish continuation: price holds above EMA20 and EMA20 stays above EMA50.
Distribution warning: repeated 1H closes below EMA20 while trapped under resistance often leads to a flush.
RSI (14)
Bull control: RSI holds above 50 during consolidation.
Breakout strength: RSI pushes above 60 with a 1H close above resistance.
Breakdown risk: RSI slips below 45 while price loses the range floor.
Trading Plan (Clear Entry, SL, TP)
Scenario 1: Buy Breakout Only With Acceptance (Continuation Setup)
Trigger
1H candle closes above the range top (above the current supply lid) and the next candle does not instantly reject.
Entry
Buy on a retest of the broken level (range top becomes support).
Stop loss
SL below the retest swing low (or below the range top if you want a tighter invalidation).
Take profit
TP1: retest of the weak high zone
TP2: extension toward 5,120 if momentum remains strong (trail with EMA20)
Best practice
Avoid buying a single wick above the range. Acceptance matters more than the spike.
Scenario 2: Liquidity Sweep Above Weak High Then Sell (High-Probability Reversal Pattern)
Trigger
Price spikes above the weak high but closes back inside the range with a strong rejection candle.
Entry
Sell after the rejection close, ideally on a lower-timeframe pullback toward the sweep zone.
Stop loss
SL above the sweep high.
Take profit
TP1: 5,060–5,040
TP2: 5,000–4,980
TP3: 4,920–4,900 if 5,000 breaks with confirmation
This aligns closely with the projected path drawn on your chart.
Scenario 3: Sell Breakdown of Range Support (Rotation Into Demand)
Trigger
1H close below the range floor (the lower boundary of the top box) and retest fails.
Entry
Sell the retest rejection.
Stop loss
SL back inside the range.
Take profit
TP1: 5,000–4,980
TP2: 4,920–4,900 demand band
TP3: 4,820–4,800 if selling pressure expands
Scenario 4: Buy the Dip at Demand (Safer Trend-Continuation Approach)
Trigger
Price reaches a marked demand band and prints rejection (strong lower wick, engulfing, or impulsive reclaim).
Entry zones
First buy zone: 5,000–4,980
Second buy zone: 4,920–4,900
Deep buy zone: 4,820–4,800
Stop loss
Place SL below the demand band low (avoid placing it too tight; gold often hunts stops around round numbers).
Take profit
TP1: back to 5,040–5,060
TP2: range top / weak high zone
Execution Notes (Avoid the Chop)
Do not trade the middle of the range. The range is designed to trap both sides.
The best decisions happen at:
the range top / weak high (sweep or breakout)
the range floor (breakdown confirmation)
the demand bands (structured dip buys)
Summary
XAUUSD 1H is still bullish structurally, but the current consolidation under a weak high increases the probability of a liquidity sweep and a rotation lower before continuation. The highest-quality setups are:
buy only after breakout acceptance,
sell a confirmed weak-high sweep,
or wait to buy the dip at 5,000–4,980 and the demand bands at 4,920–4,900 / 4,820–4,800.

DeGRAM | GOLD will retest the support line📊 Technical Analysis
● XAU/USD is holding above the rising support line inside an ascending channel, with buyers defending pullbacks after a strong impulsive breakout.
● Price has consolidated below minor resistance near 5,530 and is attempting continuation toward the upper channel boundary around 5,595–5,650, confirming bullish short-term structure.
💡 Fundamental Analysis
● Ongoing geopolitical uncertainty and expectations of eventual monetary easing continue to support demand for gold on intraday dips, favoring upside continuation.
✨ Summary
● Gold remains supported within a rising channel.
● Short-term upside toward 5,595–5,650 is favored while price holds above 5,500.
-------------------
Share your opinion in the comments and support the idea with a like. Thanks for your support!

XAGUSD Bullish Breakout: Trend Continuation Toward 124.00This is a 30-minute XAGUSD (Silver vs USD) chart showing a bullish breakout within a well-defined uptrend.
Overall trend: Price is moving inside a rising channel, respecting an ascending trendline that has acted as dynamic support.
Ichimoku Cloud:
Price is above the cloud, confirming bullish market structure.
The cloud is rising and expanding, signaling strong underlying momentum and trend stability.
Key resistance & breakout:
A horizontal resistance zone capped price multiple times.
Silver has now broken and held above this level, confirming a bullish breakout.
Price action: Post-breakout consolidation shows higher lows, indicating acceptance above resistance rather than a false break.
Support confluence: The breakout level aligns closely with the rising trendline and the top of the Ichimoku cloud, strengthening the bullish bias.
Target projection: An upside target is marked near 124.00, consistent with trend continuation and prior structure extension.
Overall, the chart favors trend continuation to the upside, as long as price remains above the breakout zone and ascending trendline.

“XAUUSD Bullish Continuation: Strong UptrendThis is a 30-minute XAUUSD (Gold vs USD) chart showing a strong bullish continuation.
Overall trend: Clear uptrend supported by a rising diagonal trendline. Price has respected this trend multiple times.
Momentum: A sharp impulsive rally followed by a healthy consolidation near the highs, suggesting buyers are still in control.
Ichimoku Cloud:
Price is trading well above the cloud, confirming bullish market structure.
The cloud itself is thick and rising, indicating strong trend support and reduced downside risk.
Support zone: A highlighted demand area around the mid-5,200s acted as a base before the explosive move higher.
Current price action: Price is consolidating around 5,533, forming higher lows — a classic bullish pause rather than reversal.
Target projection: An upside target is marked near 5,722, aligning with prior resistance / extension of the trend.
Overall, this looks like a bullish continuation setup, favoring further upside as long as price remains above the cloud and trendline.

$SMR - Flagship Energy StockNuscale Power Corp — designer of advanced small modular reactor (SMR) nuclear technology.
NYSE:SMR is the only U.S. company with a fully certified SMR design from the Nuclear Regulatory Commission. It's also already generating revenue and has a billion $ cash reserve.
US Department of Energy commits $2.7 billion to uranium enrichment and $800 million to accelerate SMR deployment.
Chart is strong, forming a clear inverse H&S pattern and ready to break through the $22 resistance. Once it is broken up, the price is ready for a flight.
I am buying it here and will add more after $22 breakout.

XAUUSD: dip-buy setup🛠 Technical Analysis: On the M15 timeframe, Gold is consolidating after a strong impulse move and is currently trading inside a short-term rising channel. Price has repeatedly reacted from the highlighted resistance zone around the 5,580–5,600 area, showing that supply is defending the top of the structure. The current pullback looks like a controlled correction, with the key demand area marked near 5,450 acting as the main support for a continuation move. The chart also suggests a potential liquidity sweep below 5,450 before the bullish leg resumes, so patience for confirmation is important. As long as price holds above the support zone and quickly reclaims the channel, the upside continuation toward the next expansion target remains valid. A clean breakdown and sustained hold below 5,450 would weaken the bullish structure and open room toward the lower support zones (5,300 and 5,100). Overall bias stays bullish, but execution is focused on buying the dip from the marked support and targeting a rebound into the upper resistance area.
———————————————
❗️ Trade Parameters (BUY)
———————————————
➡️ Entry Point: Buy on a pullback into the 5,450 support zone (allowing a brief sweep below 5,450)
🎯 Take Profit: 5,638.40
🔴 Stop Loss: 5,406.47
⚠️ Disclaimer: This is a potential trade idea based on current analysis; market conditions and price direction are subject to change based on news factors and volatility.

GBPUSD: breakout setup toward 1.3940🛠 Technical Analysis: On the H1 chart, GBPUSD remains in a strong bullish structure after the “global bullish signal,” with price continuing to print higher highs and higher lows. The pair is now consolidating just below the key resistance band around 1.3843–1.3850, suggesting a potential squeeze before the next directional move. An ascending support trendline is holding the pullbacks, keeping the short-term momentum constructive. Price is trading above the SMA 50, while SMA 100 and SMA 200 stay well below, confirming trend strength. A clean breakout and hold above the resistance zone would likely trigger continuation toward the next upside objective near 1.3939. If the breakout fails, a retest of the trendline and the nearest support zone around 1.3680 becomes the first level to watch for buyers to defend.
———————————————
❗️ Trade Parameters (BUY)
———————————————
➡️ Entry Point: Buy on a confirmed breakout and hold above 1.38431–1.38500
🎯 Take Profit: 1.39391
🔴 Stop Loss: 1.37788
⚠️ Disclaimer: This is a potential trade idea based on current analysis; market conditions and price direction are subject to change based on news factors and volatility.

GBP/USD | Moving forward (READ THE CAPTION)As you can see in the hourly chart of GBPUSD, it is now being traded in the highest price ever since October 2021! currently being traded at 1.38130, showing no indication of a bearish turn.
It has gone through today's NDOG several times but it returned to it every time.
Should it touch the NDOG again, if it fails to hold above it, it may fall down further to 1.37640 again.
Bullish Targets: 1.38340, 1.38490, 1.38640 and 1.38750.
Bearish Targets: 1.38100, 1.37950 and 1.37800.

Gold Short Trade - IntradayThis intraday trade should be quick and short, as soon as Bulls starts to give up.
1. Price reached the orange CL
2. Price left the L-MLH
3. Pullback to L-MLH expected and fullfilled.
4. Price weakens after Test/Retest of L-MLH
Short with no doubt, just following the rules.
Subscribe for my Newsletter §8-)

Xau to infinity and Hi, I’m Maicol, an Italian trader specialized in Gold since 2019.
I need your support.
Leave a like and follow me.
It’s a small gesture for you, but very important for my work.
🌞 GOOD MORNING EVERYONE 🌞
Gold post-FOMC keeps pushing higher.
At this point, we don’t know when or if it will drop.
We stay aligned.
We try to follow the long from good areas.
With solid risk management.
And logical stop losses.
This is important.
For now, I remain bullish.
5600 is very close.
Reminder: today we have jobless claims.
Tomorrow we close the monthly candle.
Always pay attention to monthly opens.
Especially the first and last week of the month.
As usual, we’ll see each other live today at 14:00
to follow the market together.
See you later.
🔔 Turn on notifications
so you don’t miss anything.
📬 For any doubts or questions,
write to me. I’ll reply.
🔍 NEXT APPOINTMENTS 🔍
As usual, live at 14:00
to follow the market in real time.
🔍 REMINDER 🔍
I avoid trading during the Asian and London sessions.
I focus on news at 14:30
and New York open at 15:30.
Have a great day.
-GOOD TRADING
-MANAGE RISK
-BE PATIENT

USD/JPY | retesting! (READ THE CAPTION)As you can see in the 4h chart of USDJPY, it dropped further down to 152.090, hitting all 4 bearish targets from the last USDJPY analysis, to anyone who used it, cheers. 🍻
USDJPY is currently being traded at 153.48, bouncing back up after hitting the high of the Bullish OB.
USDJPY has tested the Bearish Breaker twice now and I expect it to retest it one more time.
The bullish targets are: 153.600, 153.750, 153.90, 154.05 and 154.200.
If it fails at retesting the bearish breaker the next targets would be as follows: 153.400, 153.250, 153.100 and 152.950

WTIUSD: Bearish Drop to 62.7?CFI:WTI is eyeing a bearish reversal on the 4-hour chart , with price testing the upper boundary of an upward trendline after forming higher highs and a breakout candle near resistance, converging with a potential entry zone that could trigger downside momentum if sellers defend against further upside. This setup suggests a pullback opportunity amid the ongoing rally, targeting lower support levels with risk-reward exceeding 1:3 .
Entry between 65.0–65.24 for a short position. Target at 62.7 . Set a stop loss at a daily close above 65.8 , yielding a risk-reward ratio of more than 1:2 . Monitor for confirmation via a bearish candle close below entry with rising volume, leveraging oil's sensitivity to geopolitical developments.🌟
Fundamentally , crude oil faces significant upside pressure from escalating tensions in the Middle East, particularly the heightened risk of direct conflict between Iran and the United States , which could disrupt supply chains, trigger Strait of Hormuz concerns, and lead to sharp price spikes in the short term. 💡
📝 Trade Setup
🎯 Entry (Short):
65.0 – 65.24
🎯 Target:
• 62.70
❌ Stop Loss:
• Daily close above 65.80
⚖️ Risk-to-Reward:
• > 1:3
⚠️ Important: This is a very high-risk trade due to extreme oil volatility and headline-driven moves.
💡 Your view?
Do sellers step in near 65 for a healthy pullback to 62.70, or do geopolitics keep pushing oil higher despite technical exhaustion? 👇

AUD/USD | Higher and higher (READ THE CAPTION)By examining the weekly chart of AUDUSD we can see that it has been bullish for quiet sometime and in the last 2 weeeks it has soared the sky! It has swept a liquidity pool that has been untouched since September 2024! It is currently being traded at 0.70310 and it is not that far-fetched for it to reach the next Buyside Liquidity Pool above the 0.71580 level.
For the time being, the targets for AUDUSD: 0.70580, 0.70750, 0.70900 and 0.71050

AUDUSD Buy Setup | 0.69800 Support + Bullish Gold Prices!Hey Traders,
In today’s trading session, we are closely monitoring AUDUSD for a potential buying opportunity around the 0.69800 zone. AUDUSD remains in a well-established bullish trend and is currently undergoing a healthy corrective pullback, approaching a key trendline confluence and the 0.69800 support-turned-resistance area, which may act as a strong demand zone for trend continuation.
From a fundamental perspective, the Australian Dollar often benefits from its positive correlation with Gold. With Gold prices maintaining a constructive bullish tone, this relationship could provide additional upside support for AUDUSD, reinforcing the bullish technical setup and favoring a continuation toward higher levels.
As always, wait for confirmation and manage risk responsibly.
Trade safe,
Joe.

Three Trades to Watch: 30 January 2026The final week of January has delivered the volatility traders were promised. We are witnessing a historic decoupling in precious metals and a rise in META and TSLA following better than expected earnings reports.
Here is the technical and fundamental alpha you need to capture the momentum.
1. Gold ( CRYPTOCAP:XAUT ): The Unstoppable Breakout
While Bitcoin consolidates, Gold has chosen violence. The asset has shattered multi-year resistance levels to enter true price discovery mode. The "Digital Gold" narrative may be pausing, but the original safe haven is breaking out, driven by renewed central bank accumulation and persistent inflation fears for the 2026 fiscal year.
The Central Bank Put:
The breakout isn't just retail speculation; it is structural. Global central banks, particularly in the East, have accelerated gold accumulation to diversify reserves away from fiat treasuries. This creates a "price floor" that didn't exist in previous cycles. Furthermore, real rates have decoupled from gold prices—historically, high rates crushed gold. In 2026, gold is rallying despite rates, signalling a total loss of faith in sovereign debt sustainability. It is also significantly outperforming Bitcoin (BTC) during its current phase of consolidation, cementing its role as the preferred safe-haven asset for this cycle.
Trader’s Takeaway : Do not short a parabolic breakout in price discovery. Watch for a retest of the breakout level to build long exposure. The trend is your friend until the daily structure breaks.
2. Meta ( NASDAQ:META ): The Efficiency Engine Roars
Meta’s Q4 earnings release on Wednesday silenced the bears. Defying fears of a "Capex Trap", Meta reported better-than-expected revenue growth and demonstrated that its massive AI spend is finally converting to ad-revenue efficiency.
AI Monetisation
The bear case was that Zuckerberg was burning cash on AI with no return. The Q4 report dismantled this. The "Family of Apps" operating income surged, driven by AI-powered ad targeting that has restored conversion rates to pre-IOS14 levels. Crucially, the Reality Labs loss narrowed slightly, showing that the "Year of Efficiency" wasn't a one-off gimmick—it's the new operating standard.
Technical Analysis: The Gap and Go
Pattern : The post-earnings action formed a classic "Runaway Gap." Unlike exhaustion gaps, this occurs midway through a trend, signalling a continuation of the move.
Volume Profile : We saw a massive volume node at the earnings open. This suggests institutions stepped in to defend the price, creating a "line in the sand" for bulls.
Moving Averages : The price has reclaimed the 50-day EMA with conviction. As long as the price stays above the gap fill, the momentum remains bullish.
The Funding Edge : The difference in holding costs is staggering. Analysis of funding rates over the last 32 hours shows that while Hyperliquid’s annualized rate spiked as high as 18%—averaging nearly 8%—BitMEX funding rates remained flat at 0.00%.
3. Tesla ( NASDAQ:TSLA ): The Growth Story Resets
Tesla delivered a surprise earnings beat in Q4 2025, reporting adjusted EPS of $0.50 (vs. ~$0.45 expected), which helped steady the stock despite a 3% year-over-year revenue decline.
Margin Stabilisation
The fear was a race to the bottom on EV pricing. However, Tesla revealed that auto gross margins (ex-credits) have bottomed and are ticking up. This "margin trough" is the signal institutional allocators were waiting for. Additionally, Energy Storage revenue grew triple-digits YoY, finally becoming a material contributor to the bottom line, diversifying the risk away from pure auto sales.
The Funding Rate Arbitrage Opportunity on BitMEX:
The rush into Tesla longs caused financing costs to explode on retail-heavy exchanges. Data from earnings day reveals that Hyperliquid funding rates for TSLA skyrocketed to over 100% APR at peak volatility. In stark contrast, BitMEX funding held firm at 0.00%.

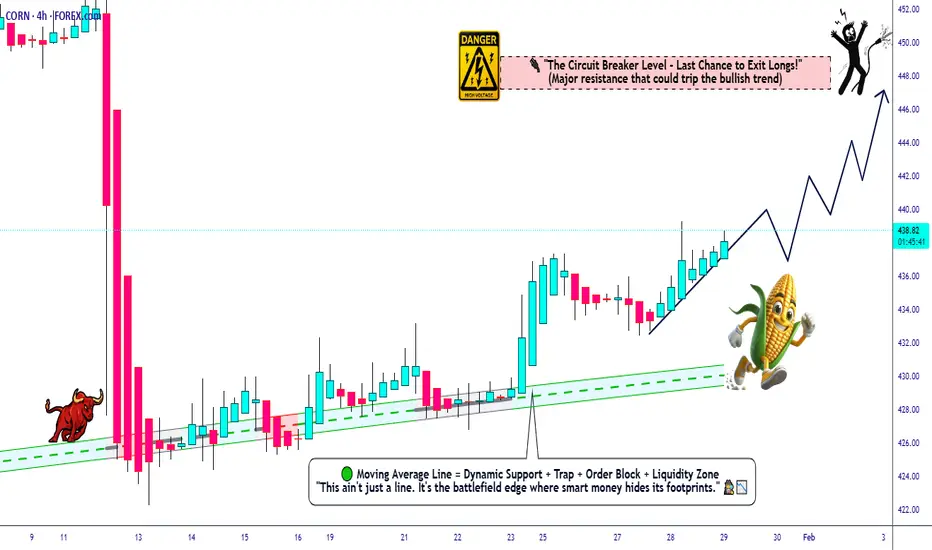
CORN → Bullish Bias Above Key Moving Averages🌽⚡ CORN CFD | High Voltage Breakout Strategy 📊 (Day/Swing Setup)
🎯 TRADE PLAN OVERVIEW
Asset: CORN Futures/CFD (ZC) - Agricultural Commodities Market
Bias: 🐂 BULLISH MOMENTUM ACTIVATED - Multiple MA rejections + pullback structure locked in
Strategy Type: Thief's Multi-Layer Limit Entry System 🥷💰
📍 ENTRY ZONES - THIEF'S STEALTH LADDER METHOD
💎 YOU CAN ENTER AT ANY PRICE LEVEL - But the Thief plays it SMART with layered limits:
Layer 1: 432.00 🎯 (First steal)
Layer 2: 434.00 🎯 (Second steal)
Layer 3: 436.00 🎯 (Third steal)
Layer 4: 438.00 🎯 (Final steal)
This is the THIEF'S STRATEGY METHOD OF ENTRY - Dollar Cost Average like a pro, accumulate on dips, maximize the ride! 🌊💸
⚡ TAKE PROFIT TARGET
TP @ 447.00 🚀🔥
Why this level? HIGH VOLTAGE ELECTRIC SHOCK WALL acting as brutal resistance ⚡🧱 + Overbought zone + Bull trap territory + Correction magnet! Escape with your profits before the shock hits! 💰✨
⚠️ IMPORTANT NOTE: Dear Ladies & Gentlemen (Thief OG's) - I am NOT recommending you set only my TP. It's YOUR choice! You can make money, then take YOUR money at YOUR own risk! Scale out, trail it, or ride - YOU decide! 🎲🔥
🛑 STOP LOSS
Thief's SL @ 430.00 ❌🚨
Clean invalidation below structure support. This is the "game over" line if price breaks below.
⚠️ IMPORTANT NOTE: Dear Ladies & Gentlemen (Thief OG's) - I am NOT recommending you set only my SL. It's YOUR choice! You can make money, then take YOUR money at YOUR own risk! Adjust according to YOUR account size and risk appetite! 🧭💪
🔗 CORRELATED PAIRS TO WATCH 👀
These instruments move together - watch them for confluence signals! 🧬📈
Agricultural Sector:
AMEX:WEAT (Wheat Futures) 🌾 - Direct grain sector correlation | When wheat pumps, corn often follows
AMEX:SOYB (Soybeans) 🫘 - Rotation flows between crops | Farmers switch planting based on prices
AMEX:DBA (Agriculture ETF) 🚜 - Broad sector sentiment barometer | Overall ag market health check
Macro Drivers:
DXY (US Dollar Index) 💵 - INVERSE correlation | Weak dollar = stronger commodity prices (exports cheaper)
NYSE:CL (Crude Oil) 🛢️ - Energy costs impact farming/production | Lower oil = cheaper fertilizer & transport
AMEX:NG (Natural Gas) 🔥 - Fertilizer production costs | Lower gas = better farmer margins
🔑 Key Correlation Play: When DXY drops + Energy stabilizes = 🚀 BULLISH rocket fuel for ag commodities!
📰 FUNDAMENTAL & ECONOMIC FACTORS (Real-Time Analysis)
🌍 Current Market Drivers:
✅ Weather Conditions - U.S. Corn Belt weather patterns critical (drought/flooding = supply shock potential) 🌦️
✅ USD Weakness - Recent dollar softness making U.S. grain exports more competitive on global market 💵📉
✅ China Demand - World's largest grain importer - watch Chinese purchase data closely 🇨🇳
✅ Ethanol Production - ~40% of U.S. corn → ethanol fuel | Crude oil prices directly impact demand ⛽
✅ Fertilizer Costs - Natural gas prices affect production costs (lower = bullish margins) 🌱
✅ Global Food Security - Geopolitical tensions driving strategic grain stockpiling 🌍
📅 Upcoming Economic Events to Monitor:
🔥 USDA Monthly Crop Reports - Supply/demand estimates (MASSIVE market mover!)
🔥 Weekly Export Sales Data - Released every Thursday (shows global demand strength)
🔥 WASDE Report (World Agricultural Supply & Demand) - Major volatility trigger
🔥 Fed Interest Rate Decisions - Impacts dollar strength & commodity capital flows
🔥 EIA Ethanol Production Reports - Shows corn-to-fuel conversion demand
🔥 NOAA Weather Forecasts - Critical for growing season outlook
📊 Current Macro Setup: Moderating inflation + potential Fed pivot + weak dollar environment = favorable conditions for commodity rally! 🎯
THIEF TRADER STYLE - WISHES & MOTIVATION 💎
"The market doesn't reward the greedy, it rewards the strategic. Layer in, scale out, live to trade another day." 🧠💰
📈 TRADE SMART, TRADE SAFE, TRADE LIKE A THIEF!
Drop a 🚀 if you're riding this CORN rocket with me!
Drop a 💎 if you're layering in like a PRO!
Drop a ⚡ if you're ready for that high voltage resistance battle!
Let's get this GRAIN! 🌽🔥
GOLD - Correction after the rally. Focus on support!FX:XAUUSD , after hitting a new all-time high of 5597, is entering a correction phase due to profit-taking triggered by local news. Overall, the structure is bullish, and the market will be able to return to growth after the pullback.
Fundamental situation
Trump's threats against Iran and Tehran's response. The active conflict between Russia and Ukraine generally supports interest in hedge assets.
Fed : Rates remain unchanged, investigation against Powell and pressure on the Fed undermine confidence in the regulator's independence. The market still expects two Fed rate cuts in 2026.
Near-term indicators: US jobless claims data (today). Any further weakening of the dollar or escalation of geopolitical tensions will resume gold's growth.
Gold's correction is a natural pause after a sharp rise. The combination of geopolitical risks, pressure on the Fed, and a weak dollar supports the uptrend. Pullbacks to $5475 - 5391 can be seen as a buying opportunity.
Resistance levels: 5515, 5595, 5597
Support levels: 5475, 5453, 5391
After strong growth, the market may form a correction of 50-70% relative to the momentum formed within the trading session. All attention is on the support zones: 5475, 5453, 5391. A long squeeze will provide an opportunity for growth.
Sincerely, R. Linda!

GOLD: Rally Hits Our Key Target ZoneGold futures gained fresh upward momentum today, climbing to yet another new high. The price is now trading well inside our red Short Target Zone, which ranges from $5,416 to $6,362.
We will take Profits here on ALL Gold longs and maybe even open a short.
We do have a bit of room left inside the target zone, but as soon as the upwards momentum comes to a halt, we anticipate the completion of the larger green wave , which should trigger a significant reversal to the downside. Accordingly, we are preparing for a major decline phase—starting with a break below the support levels at $4,197 and $3,901.
Traders looking to capitalize on this move can consider short entries within our red Target Zone. For risk management, a stop can be placed 1% above the upper edge of the zone.

XAUUSD and WTI analysis todayHello traders, this is a complete multiple timeframe analysis of this pair. We see could find significant trading opportunities as per analysis upon price action confirmation we may take this trade. Smash the like button if you find value in this analysis and drop a comment if you have any questions or let me know which pair to cover in my next analysis.

XAUUSD H1: Strong Momentum, Structure Near a Decision PointHello, I’m Amelia.
Taking a closer look at the XAUUSD H1 chart, I continue to see a clear and well-controlled uptrend. Price is moving cleanly within an ascending channel, maintaining a consistent sequence of higher highs and higher lows. The most recent strong bullish leg confirms that buyers are firmly in control. However, price is now trading some distance away from its short-term support, and in conditions like this, the market usually requires a technical pullback to rebalance supply and demand before continuing in the primary direction.
From a macro perspective, gold is still benefiting from a prolonged environment of uncertainty and a defensive market mindset. Expectations of a cautious monetary policy stance, combined with the absence of a clear and aggressive easing cycle, mean there is not yet sufficient pressure to trigger a meaningful bearish reversal in gold. This backdrop explains why upside moves are often accompanied by short-term volatility and corrective phases, rather than a straight, uninterrupted rally.
The zone I am watching most closely is the 5,380–5,420 area, where internal channel support aligns with the 0.5–0.618 Fibonacci retracement of the latest impulsive move. In momentum-driven uptrends, I frequently see a familiar pattern: a sharp advance that fuels breakout sentiment, followed by a pullback to test structural support. If price revisits this area and shows a clear buying reaction, the bullish structure remains clean and technically sound.
In a constructive scenario, I would expect price to rotate higher toward the 5,550–5,580 resistance zone. A successful retest and hold above this region would reinforce the case for trend continuation within the ascending channel. At this stage, I continue to treat any short-term weakness as a technical pullback within a dominant uptrend, rather than a reversal signal.
Wishing you disciplined and successful trading.

Double Top Pattern – A Classic Bearish Reversal Structure📚 Double Top Pattern – A Classic Bearish Reversal Structure
The Double Top is one of the most widely recognized and reliable bearish reversal patterns in technical analysis. It typically forms after a well-established uptrend and reflects a gradual loss of bullish momentum as market control transitions from buyers to sellers. Understanding the structure, confirmation rules, and market logic behind the Double Top helps traders avoid false signals and improve overall trade accuracy.
🔍 Structural Components of the Double Top
The Double Top consists of three primary phases:
Phase One – First Top
- Price rallies strongly in line with the prevailing uptrend and forms the first peak, indicating dominant bullish momentum.
- A subsequent pullback creates a temporary low, which later serves as the neckline of the pattern.
Phase Two – Second Top
- Price attempts another upward push but fails to break above the first top.
- This failure signals weakening buying pressure and early signs of distribution by larger market participants.
Phase Three – Neckline Breakdow n
- The pattern is confirmed only when price breaks below the neckline.
- This breakdown marks a shift in market control from buyers to sellers and confirms the potential trend reversal.
⚠️ Important note:
Without a clear neckline break, a Double Top is not considered valid.
📉 Market Meaning Behind the Pattern
From a price behavior perspective, the Double Top indicates:
- Diminishing bullish momentum after the second top
- Buyers losing the ability to push price higher
- Sellers gradually stepping in
- A confirmed neckline break signaling a trend reversal
When formed after a clear uptrend, the Double Top is considered a high-probability bearish reversal pattern.
✅ Conditions for a High-Quality Double Top
To improve reliability, the following conditions should ideally be present:
✔️ A clearly defined prior uptrend
✔️ Both tops are approximately equal in height
✔️ Volume is higher on the first top and lower on the second
✔️ Strong bearish candles or volume expansion during the neckline break
🛠️ How to Trade the Double Top
🔴 Sell Entry
The safest approach is to:
Wait for a confirmed neckline break
Enter a SELL on the retest of the neckline
This method reduces the risk of false breakdowns and improves the risk-to-reward profile.
❌ Stop Loss
Place the stop loss above the second top (or above both tops)
The stop should remain outside the structure to avoid liquidity sweeps
🎯 Take Profit
To estimate the target:
Measure the distance from the top to the neckline
Project that same distance downward from the neckline break
⚠️ Common Mistakes to Avoid
❌ Selling simply because a second top forms
❌ Ignoring neckline confirmation
❌ Trading without volume or candle validation
❌ Using the pattern in isolation without confluence
📌 Pro Tip for Higher Accuracy
For higher-probability setups, combine the Double Top with:
- RSI divergence
- Fair Value Gaps (FVG)
- Trendlines
- Liquidity zones
A multi-confirmation approach significantly improves trade quality and consistency.
