Natural Gas – Trend Shift in Progress?After being bearish bearish for a while, Natural Gas has broken out of the descending red trendline, signaling a clear shift in momentum from bearish to bullish.
What stands out here is how price reacted after the breakout. Instead of selling off again, it held above the recent support zone and started building higher structure.
As long as this new bullish structure holds, the bias remains to the upside, with room for continuation toward higher levels. Any pullbacks that stay above support are, for me, opportunities to watch.
⚠️ Disclaimer: This is not financial advice. Always do your own research and manage risk properly.
📚 Stick to your trading plan regarding entries, risk, and management.
Good luck! 🍀
All Strategies Are Good; If Managed Properly!
~Richard Nasr
Commodity

Silver & the $100 MagnetFrom a long-term perspective, Silver remains clearly bullish, holding well above the blue rising trendline.
Zooming in, the short-term structure is just as clean. XAGUSD is trading inside a rising red channel, respecting both its upper and lower bounds with precision.
As long as this red channel continues to hold, my focus stays on trend-following long setups. The natural target remains the upper bound of the channel, which aligns perfectly with the $100 level, a round number that has been acting like a magnet for price.
What do you think? Does Silver tap $100 again before any deeper correction? 🤔
⚠️ Disclaimer: This is not financial advice. Always do your own research and manage risk properly.
📚 Stick to your trading plan regarding entries, risk, and management.
Good luck! 🍀
All Strategies Are Good; If Managed Properly!
~Richard Nasr

USOIL H4 | Bearish Drop OffThe price could make a short-term pullback to our sell entry level at 60.18, which is a pullback resistance.
Our stop loss is set at 61.99, which is a swing high resistance.
Our take profit is set at 56.93, which is an overlap support.
High Risk Investment Warning
Stratos Markets Limited (

USOIL H1 | Falling Towards 61.8% Fib LevelBased on the H1 chart analysis, we could see the price fall to our buy level at 59.70, which is a pullback support that aligns with the 61.8% Fibonacci retracement.
Our stop loss iset at 58.73, which is an overlap support that aligns with the 50% Fibonacci retracement.
Our take profit is set at 61.32, which is a pullback resistance.
High Risk Investment Warning
Stratos Markets Limited (

Gold - Control vs Patience… Who Wins Next?Gold hasn’t done anything crazy lately, and that’s exactly the point.
Zooming out, the structure is still bullish. Every dip so far has been met with buyers, and the market keeps printing higher highs and higher lows.
Right now, price is sitting inside what I like to call a decision zone. This is where the market usually pauses, shakes out impatient traders, and shows its real intention.
As long as we’re holding above this green zone, bulls are still in control. This looks more like a pause or reload than a reversal.
That said, if price loses this area and starts accepting below it, then the story changes... and a deeper correction would be on the table.
What do you think? Will Gold reload and continue higher, or is this where control shifts? 🤔
⚠️ Disclaimer: This is not financial advice. Always do your own research and manage risk properly.
📚 Stick to your trading plan regarding entries, risk, and management.
Good luck! 🍀
All Strategies Are Good; If Managed Properly!
~Richard Nasr

COPPER - The Metal No One Is Talking About… YetCopper just did something important, it broke above its previous all-time high. That alone puts it back on the radar from a macro perspective.
Structurally, the trend is clearly bullish. Price is respecting the rising trendline, and what we are seeing now is a normal post-breakout reaction, not weakness.
The plan from here is simple: 👇
i will be watching the intersection of the rising trendline and the prior structure zone. That confluence is where risk becomes defined and where trend-following longs make the most sense.
As long as price holds above structure and respects the trendline, the bullish thesis remains intact.
📊 Always follow your trading plan regarding entry, risk management, and trade management.
Good luck! 🍀
All Strategies Are Good; If Managed Properly!
~Richard Nasr

GOLD (XAU) Outlook - Prediction (12 NOV)GOLD (XAU) Outlook - Prediction
📊 Market Sentiment
Market sentiment for GOLD remains strongly bullish, primarily driven by central bank accumulation. Since 2023, global central banks led by China have been purchasing gold aggressively, creating a durable demand base. With the FED preparing to initiate QE while inflation remains elevated, I think risk assets like GOLD could outperform as the USD (DXY) weakens. This macro setup continues to support a long term bullish narrative.
📈 Technical Analysis
Price has been retracing since October 20, which I think was a healthy correction following a strong expansion. As mentioned in my previous GOLD outlook, price appeared to be retesting the Weekly Value Gap and accumulating within that zone. In my opinion, this accumulation phase seems to have ended, and the market looks ready to continue higher.
📌 Game Plan - Prediction
Price has broken out of the accumulation zone and started expanding upward. I plan to enter after a retest near the key zone around $4060. It may dip toward $4027, which I consider a discount zone. I intend to scale in between $4060 and $3950, with invalidation if the daily candle closes below $3900.
💬 Follow my Substack profile for detailed insights and extended analysis.
⚠️ Disclaimer: For educational purposes only. This is not financial advice.

CRUDE OIL (CL) PREDICTIONCRUDE OIL (CL) PREDICTION
📊 Market Sentiment
Crude oil prices had been trending lower following signs of de-escalation in the Israel–Palestine conflict, easing tensions with Iran, and emerging peace signals from the Russia–Ukraine front.
However, recent statements from Trump and the possibility of a U.S. military action against Venezuela have shifted sentiment back to the upside.
Venezuela holds approximately 18% of the world’s proven oil reserves and ranks as the 12th largest oil producer globally. Any potential conflict involving the U.S. could significantly disrupt supply expectations, acting as a strong bullish catalyst for oil prices.
📈 Technical Analysis
CL swept monthly liquidity around the $55 level and has since shifted into a bullish structure on the daily timeframe.
In my view, this move indicates that price has gathered sufficient energy for either continuation higher or a controlled retracement before the next bullish leg.
📌 Prediction – Game Plan
I entered a long position at 56.24$.
🎯 TP1: 57.70$
I will take partial profits here and move the remaining position to breakeven.
🎯 TP2: 58.90$
🛑 Stop Loss: Daily close below 55.40$
💬 For deeper sentiment and strategy insights, subscribe to my Substack free access available.
This analysis is for educational purposes only and does not constitute financial advice. Always conduct your own research before trading or investing.

$100 Silver 2029-2031 - Long Term InvestmentMacro Cup & Handle + 21 Fib Time Zone + Fractal
The scenario means we go down a little bit more. We then consolidate for a couple of years before we have a parabolic year or two.

If You Love Bitcoin and Own Silver, You Need to See This ChartLet me introduce you to "The Most Extreme BTC/Silver RSI Since 2011"
Silver is on course for its strongest annual performance since 1979, supported by a broad rally across precious metals. This uptrend has been fuelled by sustained central bank buying and steady inflows into exchange-traded funds, which have lifted overall investor sentiment. Silver has also gained from robust industrial demand, reinforcing its price momentum. The metal remains vital to global supply chains, with wide applications in electronics, solar power systems and specialised medical coatings.
The BTC / Silver ratio gives us one of the clearest lenses to understand when capital is shifting between hard assets and digital assets.
A few months ago:
1 #Bitcoin ≈ 3,500 oz of Silver
Today:
1 Bitcoin ≈ 1,100 oz of #Silver
That’s a ~68% decline in the #BTC/Silver ratio since May 2025.
In the 2017 bull market, Bitcoin reached ~1,100 oz of Silver.
That was the first time in history.
What was resistance back then is now potential structural support
Markets don’t forget these levels.
On the weekly BTC/Silver chart:
RSI ≈ 20
This is the lowest RSI reading since Bitcoin’s creation (2011)
Historically:
RSI has reached above 80 multiple times
But it has never been this oversold versus Silver
Let’s be precise:
❌ There is no 100% confirmation that Bitcoin has bottomed versus Silver
❌ This is not a “sell everything, buy Bitcoin now” call
But…
✅ If you are a Bitcoin believer
✅ And you accumulated Silver over the past few years
✅ This is one of the best risk-reward zones to start rotating profits from Silver into Bitcoin
Should You Sell 100% of Your Silver Right Now?
Absolutely not.
You don’t exit positions emotionally — you exit systematically.
👉 You can wait for TA / FA confirmations
👉 You can scale in instead of going all-in
👉 You can let the market confirm the rotation
This is important — because timing matters.
If you look carefully at the BTC/Silver chart:
🔺 Best time to convert Bitcoin → Silver
Level 3️⃣
🔻 Best time to convert Silver → Bitcoin
Levels 1️⃣ and 2️⃣
These zones historically rewarded early rotation
👉 What If Silver Continues to Outperform?
If Silver keeps outperforming Bitcoin, the chart already shows where profit-taking zones are:
"700 oz Silver per CRYPTOCAP:BTC → very realistic in 2026"
370 oz Silver NASDAQ:XAG per BTC → not a primary target right now
The 370 oz level would likely require:
Bitcoin falling below ~$80,000
A broader risk-off or crypto-specific drawdown
Not impossible — just lower probability for now.
This is not about choosing sides:
❌ Silver vs Bitcoin
❌ Old money vs new money
This is about capital rotation.
Big Money Enters 👉 Takes profit 👉 Rotates 👉 Repeats
If you love Bitcoin and have already made good money with Silver,
This is one of the "FIRST " cleanest transition zones we’ve seen in years — with discipline, patience, and confirmation from TA.

HindOil Expo at Crucial Make-or-Break SupportThis is the weekly timeframe chart of HindOil Expo.
The stock is showing a strong Law of Polarity support zone in the ₹130–140 range and is currently attempting a reversal from this level.
If this support zone sustains, the stock may move towards higher price levels, with the channel’s upper boundary acting as the immediate short-term target around ₹180.
Thank you.

Gold - Pullback or Reload Before the Next Push?📈 Gold remains overall bullish , trading within a well-defined ascending structure.
Price is now approaching a high-confluence area, where the demand zone aligns perfectly with the lower red trendline. This intersection is critical, as it represents a classic trend-following buy zone within a healthy uptrend.
⚔️As long as this zone holds, we will be looking for bullish reactions and continuation setups, aiming for a move back toward the upper side of the channel and the previous highs.
A clean rejection from this level would confirm buyers are still in control.
A decisive breakdown below it would invalidate this bullish scenario.
Is Gold setting up for another trend continuation, or will it surprise the crowd? 🤔👇
⚠️ Disclaimer: This is not financial advice. Always do your own research and manage risk properly.
📚 Stick to your trading plan regarding entries, risk, and management.
Good luck! 🍀
All Strategies Are Good; If Managed Properly!
~Richard Nasr

Silver Extends Gains as Wave Structure Points HigherSilver broke higher last week sharply and decisively, while gold has not followed to the upside as strongly. However, with the gold–silver ratio falling, silver remains the stronger performer at this stage. Because of this relative strength, the move could be wave (3) of an ongoing five-wave bullish impulse, especially given the strong extension higher and the fact that gold is also approaching an all-time high.
Silver may continue to grind higher, and there appears to be room toward the 261.8% Fibonacci extension and the 68–70 zone to complete a lower-degree impulse within wave (3). Currently it can be trading in subwave 3 with room for more gains, just be aware of subwave 4 pullback before a bullish resumption within subwave 5 of (3).

Gold - Bullish Structure Still Intact… Eyes on the Next Higher!!📈Gold remains overall bullish, consistently forming higher lows along its rising trendline. Every time price tapped the lower boundary of the structure, buyers stepped in aggressively, and we may be approaching that point again.
⚔️Price is currently hovering near a blue support zone, which aligns perfectly with the rising trendline. As long as this confluence holds, we will be looking for trend-following longs, targeting the upper resistance zone highlighted in beige.
🏹If buyers defend this area once again, Gold could be preparing its next impulsive leg upward.
Do you expect Gold to print another higher low here? Share your thoughts below 👇
⚠️ Disclaimer: This is not financial advice. Always do your own research and manage risk properly.
📚 Stick to your trading plan regarding entries, risk, and management.
Good luck! 🍀
All Strategies Are Good; If Managed Properly!
~Richard Nasr

SILVER - The ATH Retest Opportunity!!!🚀Silver has officially broken above its all-time high - a major milestone for the metal. But nothing moves in a straight line, and healthy trends always correct before continuing higher.
📉Price is now on its way to retest the previous ATH zone in red, which aligns perfectly with the rising trendline. This creates a powerful confluence area where buyers have historically stepped back in with strength.
⚔️As Silver taps into this intersection, we will be looking for trend-following longs, expecting the bulls to defend the zone and push toward new highs.
🏹The structure is bullish. The trendline is intact. The level is clean.
Now we wait for the reaction… will the bulls reload here? 🤔
⚠️ Disclaimer: This is not financial advice. Always do your own research and manage risk properly.
📚 Stick to your trading plan regarding entries, risk, and management.
Good luck! 🍀
All Strategies Are Good; If Managed Properly!
~Richard Nasr

XAUUSD - The Golden Retest Zone!📈Gold remains overall bullish , respecting its rising structure and printing higher lows along the way. Each corrective dip has been met with strong buying pressure, keeping the broader trend intact.
📉As price pulls back, it is now approaching a key blue structure zone that aligns perfectly with the lower blue trendline. This intersection forms a high-confluence area where we will be looking for trend-following longs.
⚔️As long as Gold holds this zone, the bullish scenario remains dominant, with the next potential push targeting the previous ATH highlighted on the chart.
🏹A clean reaction here could be the catalyst for the next leg of the uptrend.
Will the bulls defend the golden zone again? 🤔
⚠️ Disclaimer: This is not financial advice. Always do your own research and manage risk properly.
📚 Stick to your trading plan regarding entries, risk, and management.
Good luck! 🍀
All Strategies Are Good; If Managed Properly!
~Richard Nasr

XAUUSD: Bearish Correction Targets $3822 amidst Uptrend.Scenario: Bearish Corrective Move within a larger Uptrend.
Current Price (Approx.): $4,218.81
Chart Context: Price has already retraced from the recent high of $4,381.73 and is currently hovering near the 0.236 Fibonacci Retracement ($4,249.74) and above the 0.4 Fibonacci Retracement ($4,158.02).
Key Levels
Key Resistance Zone (Potential Reversal): $4,338 (Close to the recent high/start of the pullback).
Primary Target (Take Profit): $3,822 (Coincides with the 1.0 Fibonacci Retracement level of the structure shown, indicating a full retracement of the move from $3,822.46 to $4,381.73).

XAUUSD — Long-Term Bullish Structure Toward 4708.76Market Structure
Gold remains in a strong long-term bullish trend, supported by higher-timeframe momentum and repeated accumulation phases. The current price action is consolidating above major structural supports, keeping the long-term upside target 4708.76 valid.
Key Support Zones
Key Support Zone 1 — 3839
This is the primary structural floor. As long as price holds above 3839, the bullish trend remains intact and the path toward the higher target stays open.
A clean bounce from this zone would reinforce the bullish continuation.
If 3839 Breaks — Key Support Zone 2 — 2775
A decisive breakdown below 3839 would signal a deeper correction toward the secondary support at 2775.
This zone represents a major historical demand area, where large-scale buying interest is expected to reappear. A hold above 2775 would maintain the long-term bullish macro outlook.
Main Target
4708.76
This is the projected long-term extension target based on the broader impulse wave. As long as gold stays above 3839, the probability of reaching this upper target remains high.

CL1! — Bullish Above 58 with Target at 62.22Crude oil maintains a constructive bullish structure as long as price holds above the 58.00 key support zone. This level remains the foundation of the current upward bias.
The next meaningful obstacle for buyers sits at the 60.69 resistance, which aligns with a major Fibonacci cluster and has shown strong rejection in previous attempts. A clean breakout and sustained close above 60.69 would confirm renewed bullish momentum.
Above that resistance, the path opens toward 61.71 followed by the main upside target at 62.22, which represents the completion of the current Fibonacci expansion.
As long as price trades above 58, the bullish scenario remains valid. A failure at 60.69 may trigger a temporary pullback, but the broader structure favors continuation toward 62.22 once the level is cleared.

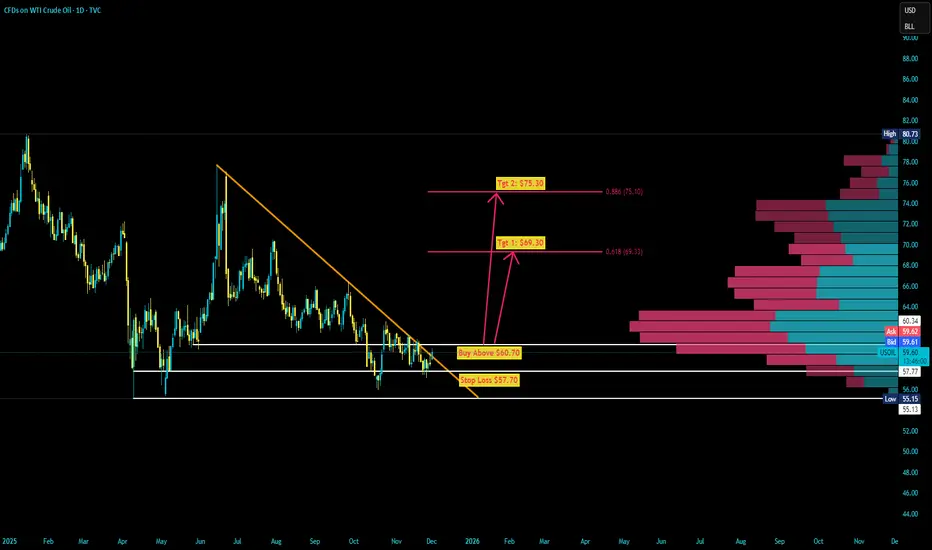
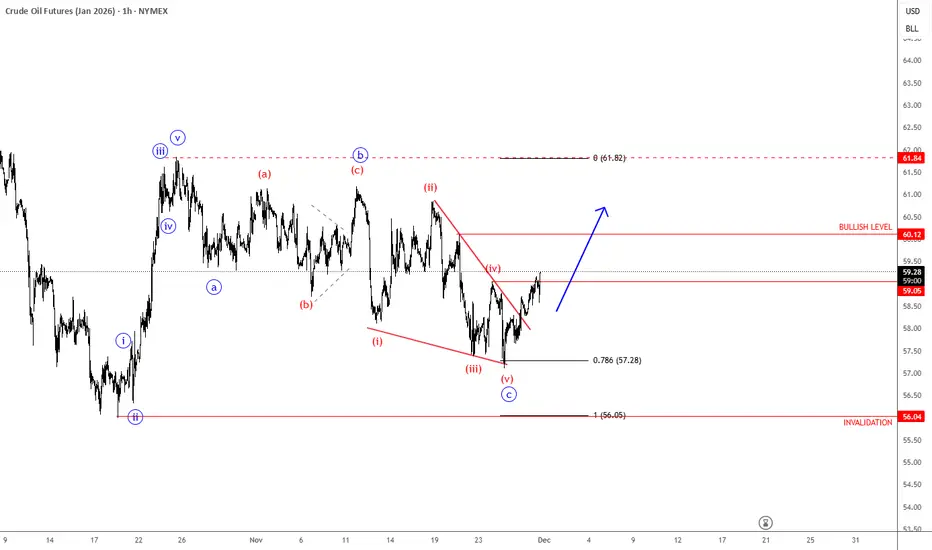
Crude Oil Has Finally Finished An Intraday Corrective SetbackCrude oil made a very strong rebound back in mid-October with an impulsive move of more than 11%, while the current retracement from 62 is very slow, which still suggests a counter-trend movement despite the weakness now retesting the 78.6% support levels. We can still see three waves down, and ideally subwave c is coming into a potential support zone, so a rebound can still happen while the market trades above 55.96 invalidation.
Looks like Crude oil is finally on the way back to October highs, as we see a sharp and impulsive rebound from the 78,6% Fibonacci retracement after a completed wedge pattern. So be aware of more intraday gians, especially if breaks back above 60 level, just watch out for pullbacks.
Gold Reload Zone… Bulls Waiting Patiently!📈Gold remains overall bullish, respecting both its rising structure and the major support zones beneath current price. After breaking above the light-blue resistance area, XAUUSD is now pushing higher, but a pullback remains very likely before the next impulse.
⚔️On the upcoming retest of the blue structure zone and the rising trendline, we will be looking for trend-following longs. This area has acted as support multiple times and now aligns with the bullish context, making it a high-probability buy zone.
🏹As long as Gold remains above the red demand area and respects the rising structure, the next wave upward toward the 4,385 resistance remains the most likely scenario. Only a clean break below the red zone would weaken the bullish outlook.
For now, patience is key… wait for the retest, then look for longs from structure. 🤔
⚠️ Disclaimer: This is not financial advice. Always do your own research and manage risk properly.
📚 Stick to your trading plan regarding entries, risk, and management.
Good luck! 🍀
All Strategies Are Good; If Managed Properly!
~Richard Nasr

XAUUSD - Bulls Still Stepping In at Demand… Watching the Retest!Gold remains overall bullish, holding firmly above the major support zone around $4,000–$4,050. This entire red area has been acting as a strong demand zone for weeks, with price bouncing from it multiple times, a clear sign that buyers are defending this level aggressively.
📈XAUUSD is also respecting the rising trendline , forming a clean higher-low structure. As long as Gold remains above both the trendline and the support zone, the bullish outlook stays intact. I will be looking for long setups on the next retest of this confluence area.
🏹If buyers step in again, the next move could push toward the previous highs near $4,385. But if price breaks below the support zone and the trendline, the bullish structure would weaken and open the door for a deeper correction.
For now, this zone is the key. Will Gold bounce again… or finally break through support? 🤔
⚠️ Disclaimer: This is not financial advice. Always do your own research and manage risk properly.
📚 Stick to your trading plan regarding entries, risk, and management.
Good luck! 🍀
All Strategies Are Good; If Managed Properly!
~Richard Nasr
