BTC 1H diagonal compression into Monday: brace for volatatilityI’m tracking a validated descending channel (2 magenta lines) from the Oct highs and two rising supports (2 green lines) from the Nov/Dec base. Price is now pinned near the convergence around 90.6k.
Why the “double lines” matter
The outer lines define the macro boundaries (where reactions repeatedly happened).
The inner lines act like a “decision lane” (where price keeps getting rejected/held).
Together this often produces compression to expansion (volatility tends to increase once the market chooses a side).
What I’m watching (behavior > prediction):
Bullish resolution: 1H close above the upper magenta + next candles hold above (no instant reclaim back under).
Then I treat magenta as support on retest. Upside targets become the next horizontal supply zones (92–94k).
Bearish resolution: 1H close below the lower green + retest fails (closes stay below).
Then I treat green as resistance; downside opens toward 89k first, then deeper supports (mid/low 80s).
Chop warning: wicks through lines with no follow-through = liquidity runs, not confirmation. I don’t trade the wick. I trade the close + hold.
Here's how the lines helped me succesfully time a short recently:
Planned two days earlier, during previous chop at this level, and patiently waited for a retest:
Rule for the weekend / Monday open
I’m not betting on the timestamp of line intersections. I’m bracing for range expansion and waiting for acceptance/rejection on 1H closes.
Not financial advice. This is a volatility warning + structure map, not a signal.
Compression

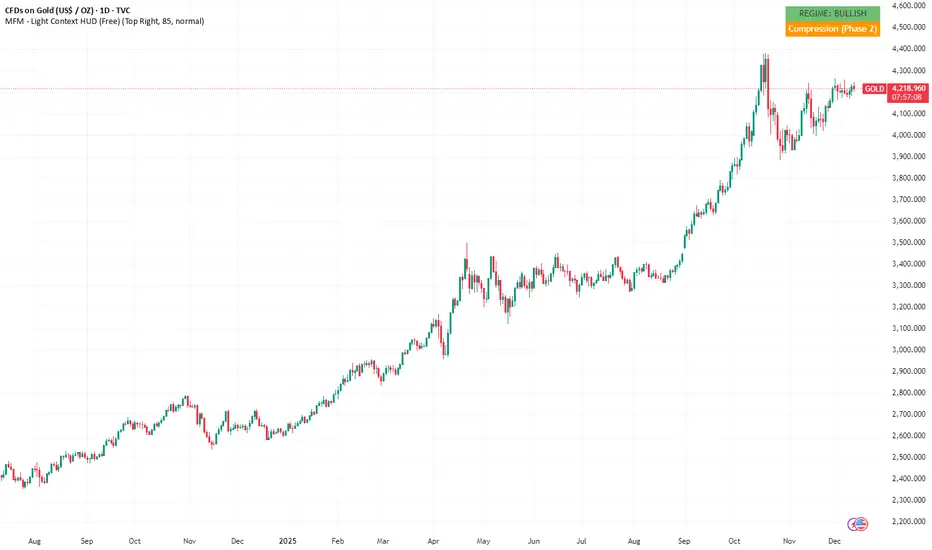
Gold: Compression Phase Inside a Bullish Regime (MFM HUD)Educational context only. Not financial advice.
What the HUD shows
Regime : Bullish (higher-timeframe momentum supportive)
Phase : Phase 2: Compression
No signals or forecasts
Gold has pushed higher in recent months. The HUD now shows a shift into compression,
meaning momentum has cooled and the internal rhythm has leveled off. You often see this first in the phase structure before it shows up in price.
What phase 2 usually tells you
Phase 2 is a neutral, reorganizing state. Typical behavior includes:
tighter ranges
slowing momentum
less directional pressure
reorganizing momentum rather than accelerating or reversing
It doesn’t lean bullish or bearish. It just reflects a market that’s taking a breather.
Regime vs. Phase
A bullish regime sets the broader environment. Phase 2 shows that short-term momentum isn’t pushing strongly right now.
Together, this often results in slower, less expressive movement even if the larger trend remains intact.
Why this matters
Structural shifts tend to appear earlier in regime/phase behavior than in candles alone.
The HUD simply makes that visible: no signals, no predictions, just context.
What this chart illustrates
A strong trend behind us
A shift into structural compression
A neutral internal state inside a supportive macro backdrop
This is purely contextual information and does not imply future direction.
Disclaimer
This post is for educational and analytical purposes only.
It does not provide trading signals, financial advice, or predictions.
All observations describe structural market conditions only.
© 2025 Inratios. Market Framework Model (MFM) protected via BOIP i-Depot #155670.
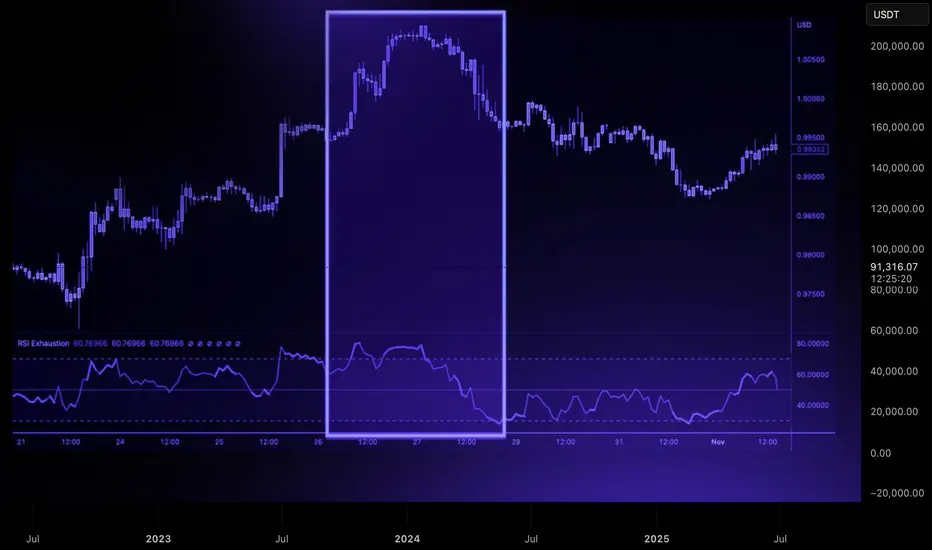
Trend Exhaustion: How to Spot a Reversal Before It HappensReversals rarely start with dramatic candles. They begin quietly, through subtle shifts in momentum and structure that most traders overlook.
A strong trend doesn’t collapse all at once. It loses strength in stages, and those stages are visible long before price turns in the opposite direction.
The first sign of exhaustion is weakening impulse strength. In a healthy trend, impulsive moves are clean and decisive, and retracements are controlled. When each new push produces smaller higher highs or lower lows, it signals reduced participation.
Buyers or sellers are still present, but the force driving the trend is fading.
The second clue lies in how price interacts with liquidity. Strong trends break key levels with conviction. Exhausted trends start reaching above highs or below lows only to reject immediately.
These sweeps show that the market is clearing liquidity without gaining follow-through, often trapping late entries and signaling that larger players are offloading positions.
A third indication appears when structure begins to fracture. An uptrend losing its higher-low sequence or a downtrend failing to maintain lower highs is a shift in narrative. A single break is not confirmation, but when it aligns with slowing impulses and liquidity failures, momentum is clearly changing.
Volatility then begins to compress. Candle ranges shrink, movement becomes less directional, and price enters a tightening pattern.
This compression often precedes expansion in the opposite direction. When a decisive candle breaks out of this cluster, the reversal typically accelerates.
Trend exhaustion is about recognizing when the conditions that supported continuation no longer exist.
By reading momentum, liquidity, and structure together, you can anticipate shifts earlier, manage risk more effectively, and position yourself on the right side of the next move.
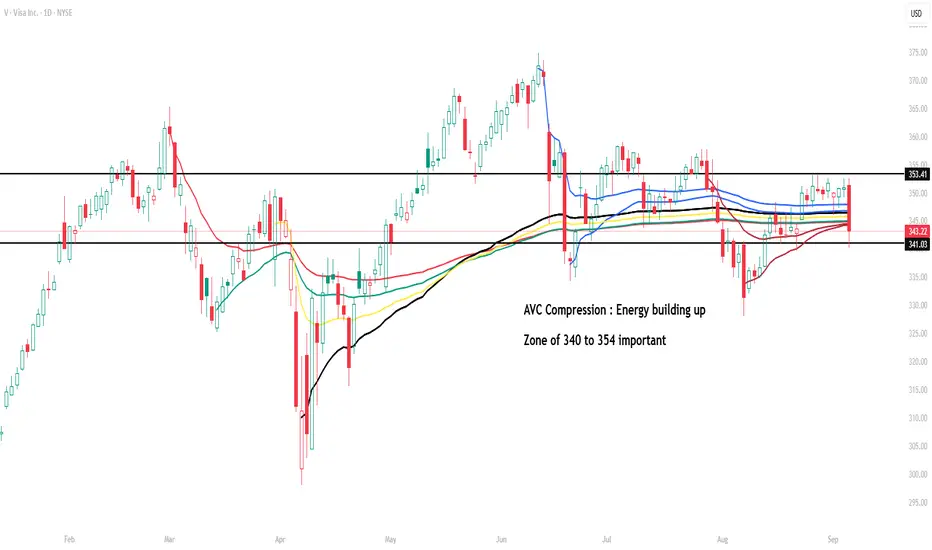
Visa (V) – AVC Compression Around Key Zone 340–354Visa is trading in a compressed zone with multiple Anchored VWAP converging, creating what I call an AVC (Anchored Volume Compression) setup.
This indicates energy is building up, and a decisive move outside the 340–354 range could set the next directional leg.
Support: 340
Resistance: 353–354
Watch for a breakout or breakdown from this congestion area to gauge momentum.
#AAVE #AAVEUSD #AAVEUSDT #Analysis #Eddy#AAVE #AAVEUSD #AAVEUSDT #Analysis #Eddy
As can be seen in the chart, the price has moved towards the supply area with a compression and has formed the 3-drive and can fall from the indicated supply area towards the daily demand zone.
I have identified the important supply and demand zones of the daily timeframe for you.
This analysis is based on a combination of different styles, including the volume style with the ict style.
Based on your strategy and style, get the necessary confirmations for this analysis to enter the trade.
Don't forget about risk and capital management.
The responsibility for the transaction is yours and I have no responsibility for your failure to comply with your risk and capital management.
💬 Note: Stop losses behind the supply and demand zones are usually hunted by market makers. Be careful of stop hunts and do not enter a trade without getting confirmation and without having a proper trading setup.
Be successful and profitable.

DDOG's Shakeout & Squeeze: The Setup for an Explosive Reversal?The price of DDOG appears poised for a dip slightly below the upward trendline and Fibonacci support zone (126-116) before finding strong support. This could act as a liquidity grab, shaking out weaker positions before an explosive move higher. Compression on the weekly timeframe would be an ideal signal, with tight price action and decreasing volatility indicating accumulation. A bullish reversal confirmation, such as a strong engulfing candle, pin bar, or a breakout above short-term resistance, would provide a high-probability entry. Monitoring RSI for a hold above oversold levels and a curl upward, along with volume expansion on the breakout, will add further conviction to the trade.
Disclaimer:
This analysis is for educational purposes only and should not be considered financial advice. Trading and investing involve risk, and independent research or consultation with a professional is recommended before making any financial decisions.

XAUUSD Short Opportunity: Bearish Momentum AheadGold (XAUUSD) has recently shown signs of a potential downturn. After reaching a significant resistance level, we are seeing bearish patterns indicating a possible shorting opportunity.
With the current market setup, a short position on XAUUSD appears promising. However, it's crucial to stay updated with market news and economic indicators that could affect gold prices.

Planning for Next Earnings Season: DFSNYSE:DFS has a platform trend since the highs and lows are very consistent, suggesting controlled buying over time. It had a compression pattern before the pop out of the box white candle and a small gap up candle as the first attempt to break out to the upside. The stock may drop back into the platform range but if it holds, it's a good indication that earnings have improved. This is an example of a good pattern to watch for a pre-earnings run setup with potential to swing trade to earnings. Discover reports July 17th.

BEAMUSDTHello friends
on the condition of maintaining the support area of $0.0662; The probability that we will get out of this compact state from the top is strengthened.
Finally, we must consider; From this compressed state, whether we exit from the top or from the bottom, the movement process will be fast.
Also, according to sentiment data; Interest in this cryptocurrency has increased
What do you think?

Technical Analysis Reveals Explosive Gain PotentialWatch out, crypto-enthusiasts! Our latest technical analysis reveals that KAVA could be on the verge of a meteoric rise. The study of the graph demonstrates a remarkable compression zone, often precursor to increased volatility and imminent directional movement.
The recent consolidation in the support area, combined with a decline in volumes, suggests a discreet accumulation by informed actors. Such a price squeeze is a classic prelude to a powerful boost. The key indicator here is the underlying resistance. A breakthrough beyond this border could catalyze an impressive rally, with a target projection indicating a potential increase of 145.74%, as denoted by the sky blue rectangle.
This setup is not only a signal for traders, but a call to anyone looking to capitalize on the dynamic opportunities offered by cryptos like KAVA. For sophisticated technical analysis, insightful forecasts and real-time trading advice, be sure to follow me. Together, let’s discover the gems of the crypto market

HBAR vs ETHJust a fractal to show the potential of HBAR in the future.
History rhymes. I think we're still in good acc range on most coins.
LIKE AND FOLLOW FOR MORE!

ETC: Building Momentum to Break Descending Channel 🚀ETC's Journey Toward Breaking the Descending Channel:
Prolonged Descending Channel: Since October, ETC has been confined within a descending channel, reflecting a prolonged period of downward movement.
Building Bullish Momentum: The current market dynamics reveal a notable compression occurring under the upper boundary of the descending channel, suggesting a gathering of bullish momentum.
Key Observations:
Channel Exit Anticipation: Traders and investors are keenly observing ETC as it approaches the upper boundary of the descending channel, anticipating a potential breakout.
Bullish Sentiment: The compression under the upper boundary implies a shift in sentiment, with bulls gaining strength and preparing for a possible upward move.
Potential Implications:
Bullish Breakout Scenario: If ETC successfully breaks out above the upper boundary of the descending channel, it could mark the end of the extended bearish phase and signal a new bullish trend.
Target Levels: Traders will be eyeing key resistance levels beyond the channel exit for potential targets as ETC strives to establish a new upward trajectory.
Trading Strategy:
Confirmation and Entry: Wait for a confirmed breakout above the upper channel boundary before considering entry, ensuring it aligns with supporting volume and price action.
Risk Management: Employ risk management tools, such as stop-loss orders, to mitigate potential downside risks and protect trading capital.
Conclusion:
As Ethereum Classic approaches the upper boundary of its longstanding descending channel, the compression suggests a shift in market sentiment. Traders are on the lookout for a potential breakout, which could signal the beginning of a new bullish phase for ETC.
Wishing you successful trades as we monitor ETC's journey toward potential channel exit!
❗️Get my 3 crypto trading indicators for FREE! Link below🔑

EURUSD compression to temporary correctionEURUSD compression to correction
After few weeks of H4 & D1 downwards compression since July, EU might have the possibility to corrects upwards in the coming weeks.
Trade Safely

ETH-USDT EducationalAnalysis of supply area failure and price rise in the range of price compression.
Pay attention to the chart
***Best Of Luck***

Ocean Protocol: Strong compression that could become explosive!Ocean Protocol (OCEAN) seems to be in a very strong compression and could therefore soon blow up! Despite a small fake out from the top, the other breakouts are just wicks that are very well recovered, as can be seen on the last two low wicks. A breakout from above could at the very least take us towards $0.42, and a breakout from below could see the asset fall towards $0.23-$0.24. We favour an upward movement, but proceed with caution!

FTMUSDTHello dear friends
The price range of $0.2929 is very attractive for Phantom, it has reacted interestingly when approaching this range in the past. Of course, it should be noted that the reaction did not create a higher ceiling.
If the downward trend line is broken upwards, provided that the loss limit zone is maintained, there is a possibility of forming an upward trend.

ETHUSDT.P Trading IdeaHi everyone!
ETH is still in a range I showed in my previous trading idea.
Currently I would expect a small down-trend after reaction from a 0.5 of a wick, because we can see the H1 sweep of a previous HH, plus enough of liquidity built at the bottom side.

SO daily compression with upper wicks wave 5 downtrendSO daily compression with upper wicks wave 5 downtrend

AUDNZD: Weak Order BlockWhen price is delivered to a demand zone with compression, it suggests the zone will not hold.
I will be selling past this block either now or when we clear the 'x' point.
Updates to follow.

EURNOK potential consolidation with break out scenario.With EURNOK hitting historical levels, the current correction might lose some steam and get compressed before we see another breakout to the upside.
Which might offers some nice setups on both sides of the coin.

EURUSD CP/PCP @ TF DPrice is developing a Compression pattern. Potential reversal (Sell) Zone. It also may move up and crease Bumper Zone at higher Sell Zone

AVAXUSDTHello Dear friends
We have bullish signals on higher time frames; Like the possibility of completing the bearish wedge pattern at the end of the downtrend, provided that the price range of $11.18 is maintained
But on the 30-minute time frame, we have a tight movement that can be from both the top and the bottom, and the probability of its exit is high. Provided that the range of $15.93 is maintained, there is a high possibility of forming a downward trend in lower time frames, similar to the drawn scenario.
We would be happy to hear your comments

NVDA, AMD Bottom FormationsNVDA continues to work on its bottom. The Reversal Candlestick in October signaled the end of this stock's correction. The stock has plenty of growth for the future.
The red line is the bottom completion level for this chart, a strong resistance level. There's strong point gain potential when the current sideways action breaks out upward.
Volume-based indicators are showing slow but steady hidden accumulation.
If the current sideways action breaks down, support from the buy zone is quite close.
---
AMD is waffling around the U-Shaped Bottom's completion level, which is usually a quick short-term bottom.
Once it can sustain within the prior trading range, it can start to develop a range that can then compress and break out. So, it has a couple of areas to work on.
Meanwhile, it has sufficient past swing-style runs to be considered for a swing trading watchlist when the short-term bottom completes.
If it breaks down to retest the bottom lows, beware of the support at the buy zone.
