Continuation Levels USDCAD 05/01/2018After the recent downtrend, I prefer to look for reversal opportunity,
If the price will break the confirmation zone, it's a sign that the price
Tends to reach the supply above, therefore I'll look for P"A setup for
Buy position, the target will be the supply above.
Confirmation

BTCUSD - End of Correction? Bull Trap? Opportunity!Is this the end of the correction or is this a bull trap? We don't know yet. Nevertheless, it's worth a shot.
Bitcoin is showing new strength by breaking 15000$ resistance level with highly increased volume. This is also the bullish confirmation of a symmetric triangle pattern.
Depending on future movement this could be a short-term trade or the opportunity to build a long-term trade. Because of this I entered at 15000 with 10% of the maximum amount I'm willing to bet on Bitcoin in the long run.
I only consider opening trades that show a risk:reward ratio higher than 2:1.
Time to do some math:
Target: 19000$
Entered at: 15000$
Stop: 13299$
Risk:Reward Ratio: 2.35:1
Good Luck.
Disclaimer: I'm a relatively unexperienced trader, so don't consider this investment advice. I'm mostly here on tradingview to improve my trading skills. So don't hesitate to give some feedback.

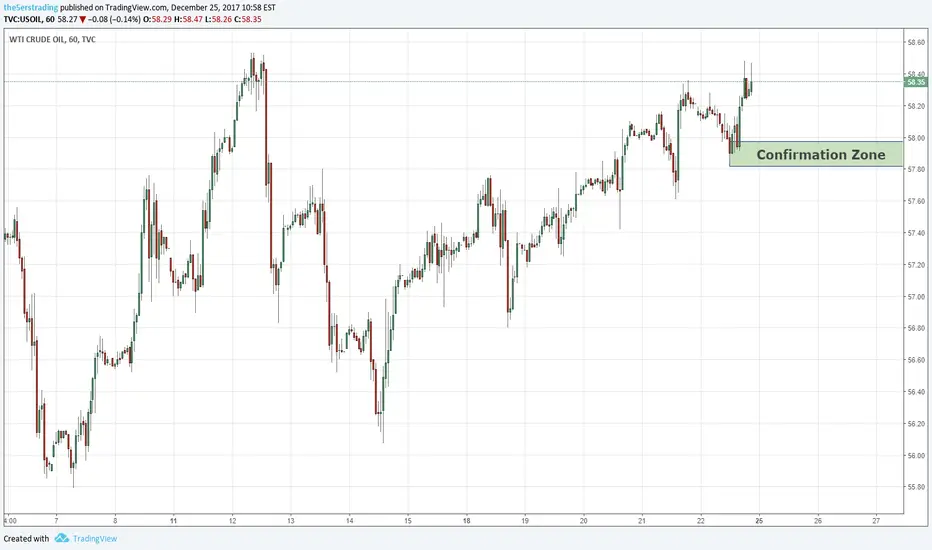
Confirmation Level USOIL 25/12/2017After the recent uptrend, I'll prefer to wait for reversal opportunity,
Also because the price reach supply level from the left, I'll wait to see
If the price will breakout the confirmation zone, it indicates the price
Tends to reach 56.40 zones, therefore if the price will break the level,
I'll look for P"A setup to sell.
Wait for break as confirmationIf green was true bottom, then we should be waiting for a break of downtrend resistance line as confirmation.
If not then expect to continue downward movement until intersection point that will decide the trend.
If downward break, then purple as next support.

GBPUSD Triangle PatternAfter multiple touches on the flip line and forming of triangle, there are 2 possible scenarios for this pair: it could break the flip line downward reaching the 0.382 fibonacci level and bouncing on the support line or breakout could occur upward (in this case we consider valid the 0.5 Fibonacci level). In both these cases we chose as target the higher horizontal line!! Great chance to profit entering a trade with RRR 5+ and tight SL! Always wait for confirmations!

>>AUDUSD<< >>December Week 2<< Short SetupW.W Wave rider
Short @0.75920
Sl @0.76550
Tp1 @0.75100
Tp2 @0.74650
Happy about every feedback or Idea :)
W.W

Entry Levels I Am Watching For A ₿itcoin Entry or ExitThis is a short term play I am watching for good entry, I will either add to the long I have been riding the last 24 hours or close it and pull open a short once either of the levels listed below cross.
₿itcoin BITFINEX:BTCUSD is very Bullish but as a day trader I ride multiple positions daily based on its movements. Riding a Bullish position has been one of the easiest things to do lately. That being said I am watching to either add to my long or close it and open a SHORT TERM short at these Bitfinex BITFINEX:BTCUSD levels:
For Long:
SOLID break out above $13,983 , WITH $13,897 being where my alarm to watch momentum indicators is set. I have moved my current stop loss to $12,681 which puts me well in profit, I will adjust the stop as the support moves up.
For Short:
This is where it gets complicated, I DO NOT RECOMMEND OPENING ANY KIND OF SHORT POSITION IN THIS MARKET , but what I am looking for is a break BELOW the ORANGE curved line . (parabolic support) That is my running support on this local move that will determine my position, at that point I close my long well in profit and watch for the next support breaks (plural) shown in RED. (also watch the BB for any movement on the bottom) If the momentum and strength indicators show weakness on MULTIPLE time frames then I consider opening one. My stop on the trade would be just above the Parabolic support and I will allow it to hit with very minimal loss on the short. This is the most sound advice anyone can give you on a short.
Keep an eye on this candles close pattern below on the Bitfinex 4 hour which closes in 20 minutes as of this writing, the formation will tell me everything on the direction of our future price movement.
Anything in between these levels for the next few hours is a NO TRADE ZONE unless you are already holding a position. I am big on waiting for confirmation on positions so I highly recommend you do the same. At this point I am very Bullish on BITFINEX:BTCUSD for the year, but this is a short term watch as a day trader.

GBP/JPY POSSIBLE 1HR 'BEARISH' FLAG DAILY RR4D
1'2' 3 2 IS AT BOTTOM FOR WICK FILL ON 1HR.
4HR CRR4D
DAILY SITTING ON 50ema
WEEKLY SITTING ON LAST GR4D CANDLE WICK TOP.

AUDJPY - Bearish EngulfingAUDJPY has formed a significant bearish engulfing on the daily time frame. This short setup is confirmed by a very strong Bollinger Band outbreak, a significant bearish engulfing at a support level, an RSI divergence, and a bearish confirmation candle.

USDJPY SETTING UPUSDJPY
is set up to prove it true direction this week. Look for a break of it's current zone and strong movement. Higher High will need to be made to confirm the continuation of the uptrend. A Lower low with retest will signal the reversal. with NFP news on friday, i wouldn't be surprised if market consolidates until then -_- BUT hoping for the best. ALWAYS wait for confirmations!!

Convergences and DivergencesUpper chart shows the US$Index, the lower one the EURUSD. Many divergences took place (extreme on one not confirmed on the other one). That's why 91.92 on the $Index is currently important. There is a potential bullish divergence with EURUSD having made a lower low recently, not confirmed yet on the Index. The breach of 91.92 would give a more durable tone to the current $ downtrend.

Possible FLAG Pattern on Monthly w/ additional Harmonic - LONGPossible FLAG Pattern on the Monthly with additional Harmonic
It seems we have a confirmed breakout of structure on the Monthly as well as a FLAG pattern that seems to have been formed.
Additionally, it seems there could be a pullback during the next couple of months, if a Bearish Cypher Harmonic Pattern is to be confirmed.
Two directions are possible in this chart, marked with RED and WHITE arrows, however both are ultimately BULLISH.
TDI Shows upwards move with the RSI line providing above midline, bouncing off the midband on a narrow band channel.
Ketchup EMA is now about to cross the Water EMA which is also an entry signal.
All in all, Gold is set to increase in value, in my opinion, similarly to the increase we are experiencing in the cryptocurrency area, as the US Dollar is being purposely devalued (in order to help the US Manufacturing Industry, amongst other factors)...
See here for more details: www.worldstopexports.com
As the value of the US Dollar reduces, the value of Metals increases.
I have now entered a LONG on this position and will set this trade to long-term for maximum profit.
----------------------------------------------------------------------------------------------------------------------------------------------------------
DISCLAIMER: This chart is for sharing and educational purposes only and is not intended to be a signal service or similar.
This chart analysis is only provided as my own opinion, based on my own analysis and comes with absolutely no warranty that this analysis is correct, whatsoever. Do not trade this chart if you do not have your own strategy. Trade only with your own strategy at your own risk. Plan your trade and trade your plan... and IF in doubt, stay out.
.....::::: If you like this chart, please click on the THUMBS UP! :::::.....
----------------------------------------------------------------------------------------------------------------------------------------------------------

CADCHF Daily Chart AnalysisLooks like CADCHF currency pair has been touched the major resistance level, as per the daily chart we need to wait for next Daily candle to be open below 0.77450 Price for bearish confirmation. Next week Monday there is a news on CAD - RMPI News, it looks like negative for CAD currency, so let's wait... If you have any concerns / issues in this chart, kindly provide your comments. Thank You.

Big Pharma MERCK & CO in SERIOUS TROUBLE !FUNDAMENTALS:
Merck & Co seem to be in serious trouble after a 'Big Pharma Bombshell' where Federal Judge Beth Labson Freeman of San Jose finds Merck lied in patent trial to both a business partner (Gilead Sciences Inc) and lied to the court itself, overturns $200 Million verdict ! (Re: hepatitis C Drug).
Source:
LA Times Article here:
www.latimes.com
Court Document here:
assets.documentcloud.org
Judge Stated "Merck's misconduct includes... misusing Pharmasset's confidential information..., and lying under oath at deposition and trial" - Federal Judge Beth Labson Freeman.
One example of this was "The edvidence examined by Freeman strongly suggests that Merck flagrantly manipulated the patent process to gain unfair advantage." - Michael Hiltzik, LA Times.
AND
"Adding to the temerity of the big drugmaker, it originally sued Gilead for $2 billion before having to settle for $200 million. Now, pending appeal, it won’t get even that much for its patent claims, and its reputation for integrity will carry a value of less than zero." - Michael Hiltzik, LA Times.
TECHNICALS: (Daily and Weekly Charts)
A Gartley pattern has been confirmed and completed as well as breakout from major structure, providing the start of what seems to be an Elliott wave 2 structure in it's infant stages, after completion of a correction and a failed Wave 5 at the top of the chart, where major resistance is located. This initiated Elliott wave count suggests a long-term bearish trend for the pharma company down to significantly low price that would normally be expected.
Ketchup, Mustard, Water and Mayo EMAs have all been breached by the price action as well as TDI showing hints of continued downward movement.
Monthly chart also suggests we are at the start of a Bearish Intermediate Wave 1 which does not look good for the pharmaceutical company.
However, that being said, this is a FANTASTIC opportunity to SHORT the absolute crap out of this stock, in my opinion I see quite significant Profit from Shorting this stock on a 3 ~ 6 month term, possibly even longer if the wave count is confirmed as described on my chart. I'm shorting this stock on the breakout of structure, where most likely this will occur on market open with a GAP. In my opinion this will be a huge profit maker as I'm expecting this bearish price action to continue for significantly long period of time.
----------------------------------------------------------------------------------------------------------------------------------------------------------
DISCLAIMER: This chart is for sharing and educational purposes only and is not intended to be a signal service or similar.
This chart analysis is only provided as my own opinion, based on my own analysis and comes with absolutely no warranty that this analysis is correct, whatsoever. Do not trade this chart if you do not have your own strategy. Trade only with your own strategy at your own risk. Plan your trade and trade your plan... and IF in doubt, stay out.
.....::::: If you like this chart, please click on the THUMBS UP ! :::::.....
----------------------------------------------------------------------------------------------------------------------------------------------------------

EURGBPLooking more bullish than bearish although more confirmation is definitely needed before entering this one.

Price at median line,time for a short entry,after confirmationPrice at median line,time for a short entry,but wait for a confirmation in changing the uptrend in downtrend or something similar,according with your strategy


DDD breaks through symmetrical triangle. Bullish confirmationConfirmation of breakout of symmetrical triangle as shown. Also has surpassed latest swing high. Bullish


BitCrystals/Bitcoin very interesting formation buy opportunityWhat I see here is quite interesting triple bottom formation. First two are quite common while the third attempt looks a little bit dramatic with big doji candle on daily chart. All three attempts are stopped buy round number 0.00010000 which are very respected in crypto community and most of the time are treated as very strong signal to buy. I would wait for better entry level for good risk reward ratio, perfect entry level would be very close to the 0.000100000 mark. Entry at the current level is not the bad idea either. Let's see what this pair will decide.

EURCAD long idea1 flag/phaseline has formed already
possible 2nd flag/phaseline is forming for confirmation
price is currently indecisive
further bullish moves expected if 2nd pattern forms

EURGBP 180 LONGPrice has seemed to breakthrough the trend and is heading up. Pin-point entry might be very soon as MA's have just crossed on the 60min chart (14ma, 50ema). I believe price will touch and bounce straight of the outer trendline for a clean SHORT in future.

AUDUSD Sideways But Sell After Confirmation @0.76411AUDUSD might break at the higher time frame resistance, but has limited potential to continue going up and breakout at 0.7725 unless the result of US elections or hawkish RBA pushes it up. Risky to sell right away as well without any further confirmation. Waiting for candlestick confirmation past 0.76411, as well as fundamentals and ADX confirmations before going short.
1W:
1D:
