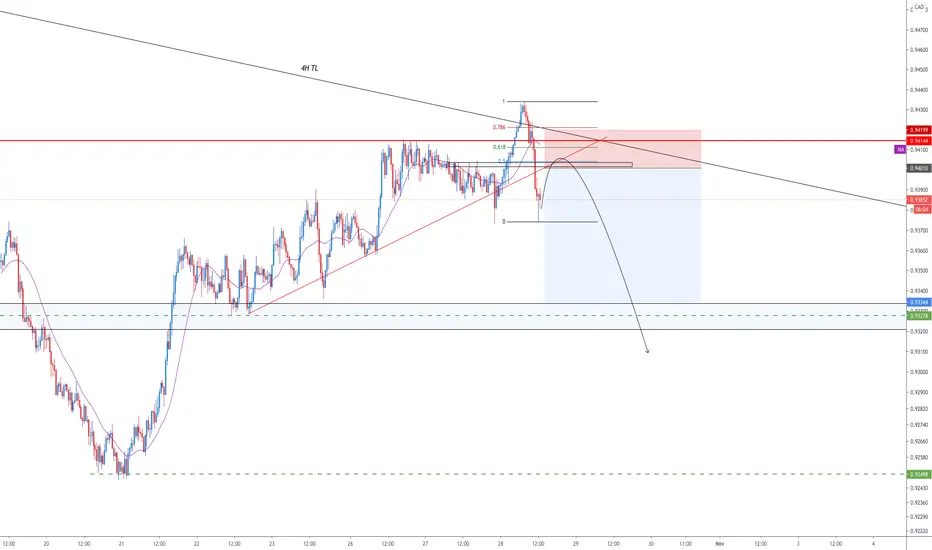
Short on PullbackLooking to go short on a pullback to retest the respectable descending TL in confluence to the previous support area which is now acting as resistance and the 0.618 fib retracement.
Confluence

How I Find Out What Lot Size To Use On Each Trade I Take I Only Risk 1% On Each Trade What Lot Size You Use Matters And Where Your SL Is Matters Too.
Here Is The Link To My Position Size Calculator www.myfxbook.com


Short on Pullback | Strong Zone of Confluence-Major ascending TL's breakout, expecting retest
-0.618 Fib retracement
-Respectable descending TL
-Strong area of previous S&R
-MA50 supporting momentum shift

GBPUSD Buy and Sell set upHello everyone
Here's the latest GBPUSD analysis.As you can see, this is just price action analysis and you should be patient till get right candle stick confirmation.
good luck

SOXX 5smaNotice how the 5sma has been resistance for the SOXX for the past 12 trading days (red oval).
This tells us that short-term, SOXX has to break the 5sma to get out of its current down-trend.
The purple line is the 50sma, which is now also resistance, as we crossed below it, and is now touching the 5sma.

Materials at multi-level supportMaterials sector has been showing relative strength. It is actually 3th in YTD performance, after 1. Technology, 2. Discretionary (Mega-cap lead sectors)
Today it is resting on the 100ema, which has been supportive since march 23rd crash.
This level is also coinciding with early 2020's high, as well as 4 other tests of the support; including a failed breakout, which worked the next time it tried.
OBV has been supportive of the uptrend. (BULL)
RSI showing slight divergence as the last bottom late September has a slightly higher RSI(10) than the current one. (BEAR)
A strong close below $60 would deny the support, and make the chart a short-term bearish one.

Long on Pullback-Major descending TL breakout confirmed, pullback to retest it expected
-0.618 fib retracement
-Strong S&R zone
-MA50 supporting bullish momentum

Short on Pullback & Fundamental Update on JPYTechnicals:
-Respectable descending TL, pullback for a retest expected
-0.618 fib retracement
-Previous support now acting as resistance
-MA50 supporting the bearish trend very well with further downside expectancy
Fundamentals:
Investors started moving their money into "safe haven" currencies (such as the USD & JPY) due to the upcoming election, the fiscal stimulus talks, and the recent European lockdowns. With so much uncertainty across the board, the safest option we have is to continue shorting currency pairs trading against USD & JPY, hence one of the reasons for shorting EURJPY.

Short on PullbackLooking for a pullback towards the respectable descending TL in confluence to the previously broken support area which is now resistance and the 0.618 fib retracement. SMA50 is also supporting the bearish momentum very well. Further downside expected.

Long on Pullback-Descending TL breakout confirmed, expecting a retest
-0.5 fib retracement
-Strong area of support

Pullback Setup | Strong Zone of Confluence-Ascending TL breakout, retest expected
-0.5 fib retracement
-Minor resistance area
-50MA
USDCAD Buy set upHello everyone
Here's the latest USDCAD analysis.As you can see, this is just price action analysis and you should be patient till get right candle stick confirmation.
good luck

Short on PullbackLooking for a pullback to retest the respectable descending TL in confluence to the 0.618 fib retracement, previous area of support (which is now resistance),and the 50MA which is supporting the bearish momentum very well for the moment. Further downside expected.

Short on Pullback-Ascending TL breakout, expected retest
-0.5 fib retracement
-Strong S&R area
-MA50 supporting momentum

Long on Pullback-Descending TL breakout, retest expected
-0.5 fib retracement
-Respectable ascending TL
-Previous resistance now acting as support
-SMA50 momentum shift

Gold Long Idea with Confluence AnalysisGold has been in a downtrend for about two months now. It formed a Rising Wedge Pattern which deceived a lot of Traders to go long. The bears are still in control. The Support of the Wedge has been broken and retested, so we should be expect a downward movement soon.
Pivot Analysis shows that Gold is still Strongly Bearish. Gold is also below the 100 SMA and 200 SMA on both 1-Hour Chart and 4-Hour Chart. The next buying area based on Confluence is in the Green Circle in the Chart, where we have Three Types of Supports. So when price gets there, we should prepare to buy.
We also have a Void that has also formed with a Quasimodo Fakeout Pattern too, So if price goes up to fill that void, we should prepare to sell at the the Red Circle at the top of the Chart near the Weak Resistance.
But for now, we focus on the Green Circle for a Buy as this is more likely to happen.
As usual we enter with a tight stop loss to reduce our risk, in case the market reverses and changes direction. Don't forget to use good risk management too. Cheers!!

Back testing My Kingdom Strategy Part 3Part 3 I Go Into Why I Use The 1000 Ma For My Strategy As Well With All My Confluences.

TL Breakout | Long on Pullback SetupLooking to enter longs on a pullback to retest the recently broken descending TL in confluence to the 0.5 fib retracement, previous area of S&R, and the MA50 which is now shifting momentum.

Long on Pullback Setup-Descending TL breakout, bullish momentum confirmed
-Respectable ascending TL, expecting to create another LH
-0.5 fib retracement|
-Previous resistance now acting as support
-50MA shift

Breakout Confirmation | Long on Pullback Setup-Descending TL breakout, retest expected
-0.618 fib retracement
-Minor support area

Short on Pullback-Ascending TL breakout, approaching retest
-Previous area of S&R
-0.5 fib retracement
-MA50 supporting bearish momentum with further downside expectancy

Long Opportunity on Pullback-Ascending TL, another LH expected
-0.618 fib retracement
-Previous area of S&R
-MA50 indicating early momentum shift
