GBP/USD Longs
Looking at this pair for BUYS this week.
Broke my counter trend line and target this week can be 1.3500's
Be on the lookout for Buys this week.
Confluence

audusd abcd patter on strong weekly zone. Market seems to be heading towards weekly zone where we have a fib channel and fib extension confluence. good for a swing opportunity with low risk.

XAUUSD SHORT TRADE FOR ABOUT 650 PIPSA short opportunity for a solid profit reward ratio of about 1:5
Confluences of short term supply zone + head and shoulders pattern breakout + 4H TF trendline touch for our solid entry Zone.
Keep your eyes on divergences to make sure for more conservative traders on this opportunity.
Happy Trading month to all.

NZD/JPY Bearish Bat formed on daily chartGood evening everyone I hope your all having a good week so far, here we have the NZD/JPY on the daily chart having formed a Bearish Bat, this is an ideal selling opportunity.
This has a risk reward ratio of over 1:2
Added confluence and RSI has strengthened my position here giving me more confidence the New Zealand Dollar will drop against the Japanese Yen.
The ratios for a valid bat pattern are:
B: 0.382 - 0.50
C: 0.382 - 0.886
D: 1.618 - 2.618
Final X to D: 0.886
I hope you all have a good week and weekend ahead, if you have any questions feel free to connect with me on trading view, or drop a comment below,
Thank you

USD/JPY Pending Trend ReversalGood Afternoon,
Looking to short USD/JPY after completing a rebound near resistance/trend line illustrated above. Please keep in mind pattern shall change should price create higher highs. Look for confirmation to enter, I also advise you to facilitate this trade on a lower time frame for a better entry. Please execute with your own due diligence.
Thanks,
Trade Wisely

Daily Long Opportunity on GoldGold has came back down to the 100 SMA on the Daily timeframe which is also in confluence with a support level. On the weekly timeframe, a bullish hammer has formed and to make this trade even better, in terms of oscillators, gold is oversold. TP for me is the previous weekly high and my stop will be just under the weekly bullish hammers low.

Possible long setup on USDCAD?A few confluences that are giving me a long bias. We have the weekly ascending trend line being respected, higher highs and higher lows, and price stalling around the 61.8% Fibonacci. Also have 2 confluences for the target of 1.40000 being the monthly high and falls in the line with the -27% Fibonacci.
Please feel free to share your thoughts. Thanks.

USDJPY Short: Watch for Gartley CompletionHey traders, looking for price action near the potential retest of this bearish breakout line. Also, we have a potential Gartley completion at the same level. This confluence could mean heavy resistance and a reversal toward completion of the larger TF triangle.


$spy looking for pullback swing after breakout-long term time frame is showing defined uptrend with stagnant trend strength. Looking at oscillators for clues
-intermediate term time frame is showing defined uptrend and strong breakout out of resistance area of 242.2x
-int. term time frame showing price action getting extended and breaking minor upward trend line coinciding with rsi bearish divergence and macd crossing downward
-looking for a short-term pullback for consolidation and continuation on uptrend
-looking for price to pullback to 1st target 243.47 which is the .236 retracement level on the shorter time frame and 242.92 which shows there is a minor support area
and maybe possibly pullback into 242.2x area
-looking for a quick downside play for an option trade

Potential Bullish PushBullish Cypher on the 4H TF
Addition confluence w/ trendline
Bullish Engulfing on the Daily TF
Anticipating a break of Major Half-point to test Quarter point
Potential Bearish Butterfly pattern set up for the retrace
Anticipating another push up for a HH after completing Butterfly Pattern from 61.8 - 88.6 Fib level

Bearish GartleyBearish Gartley formation based on the Daily TF
Reversal off major half-point
Bearish engulfing confirmation on the Daily TF
Target 1 @ next quarter point
Target 2 @ next quarter point

amba - advanced confluence possible long and short eyes on earnings next week there is a good chance for some long and short trades here. price has dropped pre earnings and bounced nicely off the 61.8% retracement and trading above its moving averages. a positive earnings report and we could enter long trades with targets around ab=cd, bat completetion where we can look for short.

USDJPY CONFIRMS SUPPORT OFFERS REENTRY FOR LONG TRANSITIONUSDJPY TESTED NEW HIGHS YESTERDAY. AND THEN RETETSTED PREVIOUS DAYS LOW FOR SUPPORT CONFIRMATION. THE RISK IS NOW GONE. STOPS IN PROFIT

EUR/USD, Bearish "Bat Pattern" @ Confluence of ResistanceA bearish Bat pattern is seen in the EUR/USD Daily time frame with a confluence of trend line and horizontal line. May be this is the time for this pair to close the retail gap created during the French Election.

targets for USDJPY (if you go or stay short)USD JPY = On 4 hour chart we will see a important support on 111.900. If we look at the past of the price, this level made many confluence points. Also we have a cluster matching the 0.382 fibo retracement and 161.8 fibo extension on down movement as we see on the chart. I think this level is very important to pay attention.

Targets EURUSD (if you go or stay long)EURUSD = If the price breaks the resistance between 1.10 and 1.10230, may could expand to fibo ext levels 50% and 61.8%. This fibo levels match with confluence points (blue lines crosses in 1.1070 and 1.1120), causes a price block for reaching next levels. Also, matches with the top line of the ascending channel, being able to find a strong sell interest. But, if the price is rejected in 1.10 and 1.10230 zone, the downside movement to the bottom of channel will be start and fill the gap.


Short GBPCAD key Fibo level and RSI confluencePrice has hit a key 423.6 resistant Fibo level which I believe will push lower to the horizontal resistance turn support at the level 1.75294. RSI is trending lower at a high overbought level and along with Stock trending down. Price may be pressured downwards to the key horizontal level. Confirmation on H4 shows downward pressure.

Bearish Cypher Bat (1hr) Butterfly (daily) CompletionsHere we have 3 patterns all completing relatively close together. I will be looking to take this short as soon as my entry rules are met. The patterns finish at a decent level of resistance if you look back on higher time frames. We also almost have an overbought signal on the daily rsi as well as bearish divergence on the smaller time frames. Trade safe everybody,


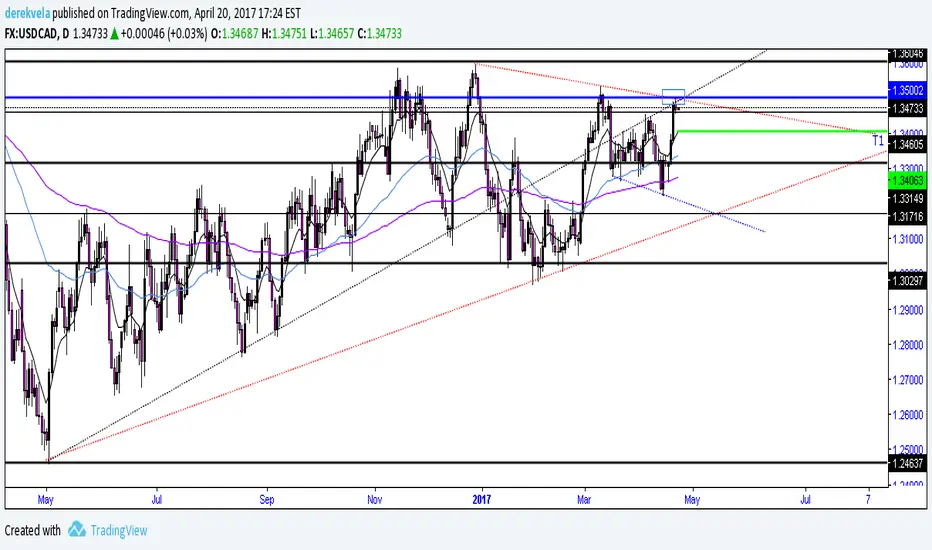
A lot of confluence with 1.3500 whole number levelMultiple trend line confluence with 1.3500 as strong resistance level. Could drop all the way down to 1.3171 area where we have an expanding triangle. We also have a bearish shark which I didnt draw on the chart with the 88.6 being in confluence with the 1.35
AUDUSD 2618 / Bearish Bat We have had a 2618 happen which was my initial reason for entry. this also tied with a possible completion of a abcd pattern at previous highs which gives us the 1.618 fib extension at a monthly key level.
When I was looking at the Daily time frame we have had our impulse leg down, 50% fib and also a strong 618 retracement from the recent push upwards. All of this again gives further confluence with the 886 level right at the previous daily highs and Key level
