AUDJPY Wave Count: Upcoming Rally Toward Bat CompletionHey traders! AUDJPY has moved sideways since the last update, and the wave count has been updated to a combination correction from an ABC simple zig-zag. I like a short from bat completion levels toward the completion of the 3-wave ((e)) at the completion of the final leg of the triangle. If the triangle completes, I will be looking for an aggressive long position toward trendline resistance. Updates to come as the tide rolls, happy trading
Confluence

AUDCHF Short setupThere's a confluence of structure here that supports the likelihood of a reversal.
1) trend resistance
2) (bear) pennant
3) At this price level, around R2 weekly pivot. there have been reversals in the past (see left)
If we get a break of this pennant structure, short this all the way down so monthly S1 which seems to act like a magnet.

EURAUD Long: Posible Triangle Breakout & EW CountHey Traders! We have a potential completion of the sideways correction on EURAUD. That means we'll be looking for big gains on the long side unless the invalidation level is violated. If price drops below the invalidation level, I'll be expecting further bearish movement to complete ((E)). Otherwise, this pair could have legs throughout the next couple of weeks. Stay tuned. I like this trade soon after market open and I'll be posting if I take a position.

GBP/USD - LONGAdjusted long entry after we didn't see the break of the 61.8% fibonacci as shown on previous post. Will now be looking to enter long on the rejection of the TL.
Let me know your thoughts.... breakout or reversal?

AUDUSD Short: Drop The Bass!Hey traders! A crab is complete on the 1H in addition to (possibly) the corrective wave structure. The bearish impulse suggests a potential turning point, so any price action above the beginning of the drop will invalidate the trade; hence Sl is placed at this level. ALSO, this reversal is occuring in a special zone, the wave-(ii) s/r zone, which adds to the probability of reversal here. Happy trading!

EURUSD Short: More Left In The TankFrom the count of ones and twos in series, and a lesser number of threes and fours, this wave count suggests another drop is coming. In addition to the EW count, we have a nice bearish bat complete at near the invalidation level, meaning YES! High R/R potential. If the count is invalidated I will update with a correction. SL is placed above the invalidation level.

EURAUD LongLong from 1.4775
Fib confluence to the PIP with 618 retracement and fib inversion 1.27.
The trend is up and we are also at previous structure

GBPUSD Long Analysis & Bullish Bat PatternMy viewpoint is long near long-term low structures
We have some fib confluence at an inner trend line
The purple horizontal line also represents the 886 fib level and a bat pattern completion
Looks like time to buy, entered in at the 1.618 level.
Will enter other half of position at bat completion

Head & Shoulders/Butterfly C-D leg ConfluencesThese are some of my favorite trades. Trades with tons of confluence if you do not know what confluence is, its basically extra confirmation. My first reason to take this trade was based on a head and shoulders pattern on the daily chart. On the last leg of the head and shoulders it retraced to the 61.8 which is a major fib level for an AB=CD trade. And it formed a double top at that 61.8 level. And on top of that confluence it is the end of a B-C leg of a Bullish butterfly. My entry will be at current market value. Also this trade gives us a great risk reward. These are the trades i put heavy lot sizes on. With that being said good luck and good trading.

AUDNZD Big Drop Coming - Sell at G Point & CypherWave count suggests a big drop is coming. In addition to the end of corrective wave E we have a cypher completing at the same level. As always, waiting for the bearish impulse and pullback before selling with a tight stop behind base of the impulse. Weekend gap provides T1 and T2 is lower at the 1.272 extension of E-F. This setup will yield a huge R/R with over 130 pips of potential profit! Happy Trading

USDJPY Bat: Buy the ReboundHey traders! USDJPY is nearing the completion of a bat pattern. The wave pattern is predicted to complete near the base of wave-i-of-v-of-1, so a stop can be tightly placed below point X of the bat. Also, the TP can be placed at the top of wave-1 which coincides with the top of the bullish channel. This way, we maximize our R/R ratio and get out of the trade immediately if the wave count is invalidated.

USDJPY EW: Bearish 5-0 Pattern to Complete Wave-2USDJPY has completed a 5-wave impulse and is currently in a corrective structure. A 5-0 pattern is a great way to get in on this wave-c-of-2. See related idea for previous structure. Happy Trading!

GBPUSD Bearish Analysis !I am short GBPUSD in the red rectangle structure zone just above the 618 pullback, we have some trendline confluence.

USDJPY Elliott Wave: Short to Bat CompletionHey Traders! Here is an update on USDJPY. Another bearish actionary wave indicates a double zig-zag correction. Pinbar resistance presents an optimal entry with a tight R/R. Unless 101.443 is broken I will be long toward a long wave-3 if/when this short follows through to completion. I will update as waves complete. Happy Trading!

GBPJPY Confluence of both Bearish Cypher and Butterfly Pattern An excellent confluence of the two patterns that occur simultaneously in GBPJPY Short with two trades one for each pattern and stops above X of the Cypher. Targets you decide whats best for this one...

Major Confluence for AUDJPYAUDJPY has made a strong push up but is running into a bit of a confluence area. Might be a good time for a short as price runs into heavy resistance, 61.8 retracement, and a major bearish trendline.

EURGBP Long: EW Expanding Triangle to GartleyHey traders, potential expanding triangle here to complete potential Gartley pattern and continue the correction. The stop is tight, any drop below "e" could mean a deeper correction. Happy Trading!

Pound/$ ShortExpecting a lower move (adding to my current position due to the MA + Price Action rejection
1:3.35 risk/reward

NZDUSD Potential 2618 TradeThe double top at the top of the chart has in fact finally reversed price as bears took control of the market
The neckline has been broken
Will now wait to see a retest of previous structure levels in the potential reversal zone (green rectangle)
Look at price action for shorting opportunities here
The 618 retracement would be most ideal, but it was a pretty strong impulse move, we might only make it to the 382 neckline/trendline level.
Of course there exists the possibility that this impulse move is not done yet, in which case this entire setup is invalid. The move could be consolidating right now for a small flag, and then continue to push down.
Wait for the perfect moment to place your orders, patience is key.
Happy trading to all.

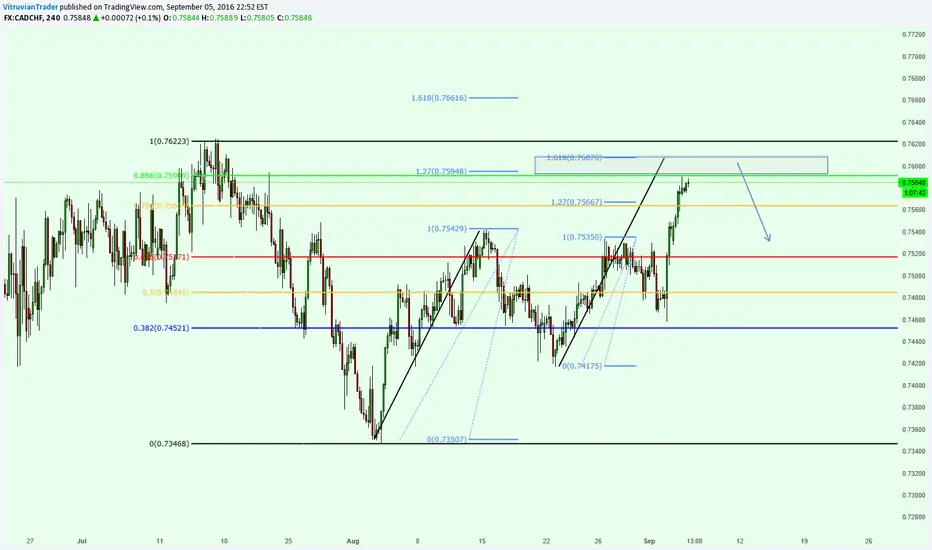
CADCHF AB=CD ShortAB=CD with Fibonacci confluence
Also a Gartley completion at an 886 Fib level (green line)
USDJPY: Selling at todays Pivot near 50% and 38.2% Fib levelUSDJPY: Selling at todays Pivot near 50% and 38.2% Fib level

USDJPY: Bearish BatHi Traders,
Hope you have had a good week of trading so far.
Here is a bearish bat pattern setup on USDJPY, H1 timeframe.
Entry: 100.800
Stop loss: 101.050
1st Target: 100.500
2nd Target: 100.300
Remember to leave a like if you found this idea useful. It's always appreciated.
Luke

Long trade based on confluence of factorsWe are in this position because of the break above a previous structure and retracement back into a resistance come support zone. The pinbar candle signalled the entry, We have a 2360 fib level from a previous swing and we are trading in the short term trend direction. Probability suggests we will lose this trade but the risk reward makes it worthwhile.
