Long Consolidation. 2110 - Saudi Cable
Closed at 169 (29-01-2026)
Getting Momentum. Took Support from 124 - 125.
Long Consolidation.
Currently there is a resistance zone from 170 - 177
Breaking Out from 178 - 180 with Good Volumes
may result in an upside move towards 314 - 315.
However, this is on a bigger tf.
Consolidation

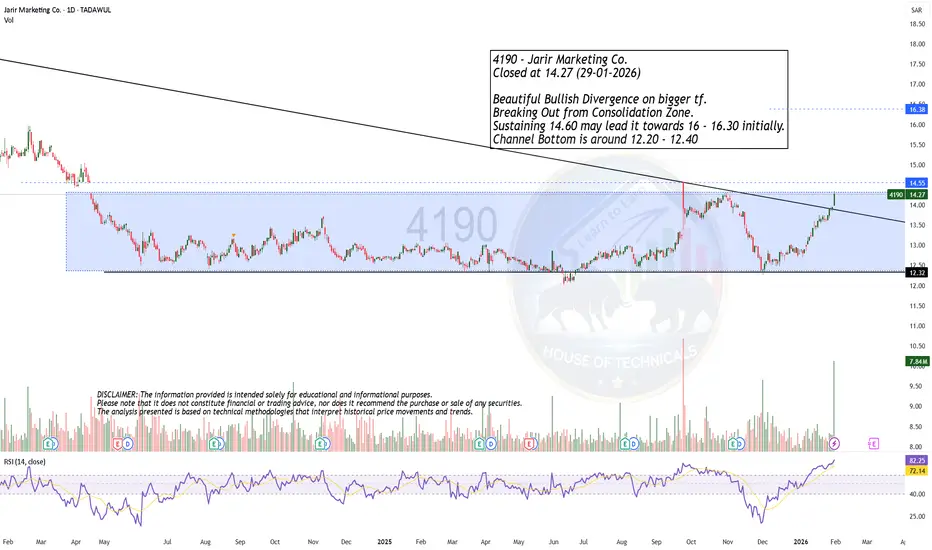
Beautiful Bullish Divergence on bigger tf.4190 - Jarir Marketing Co.
Closed at 14.27 (29-01-2026)
Beautiful Bullish Divergence on bigger tf.
Breaking Out from Consolidation Zone.
Sustaining 14.60 may lead it towards 16 - 16.30 initially.
Channel Bottom is around 12.20 - 12.40
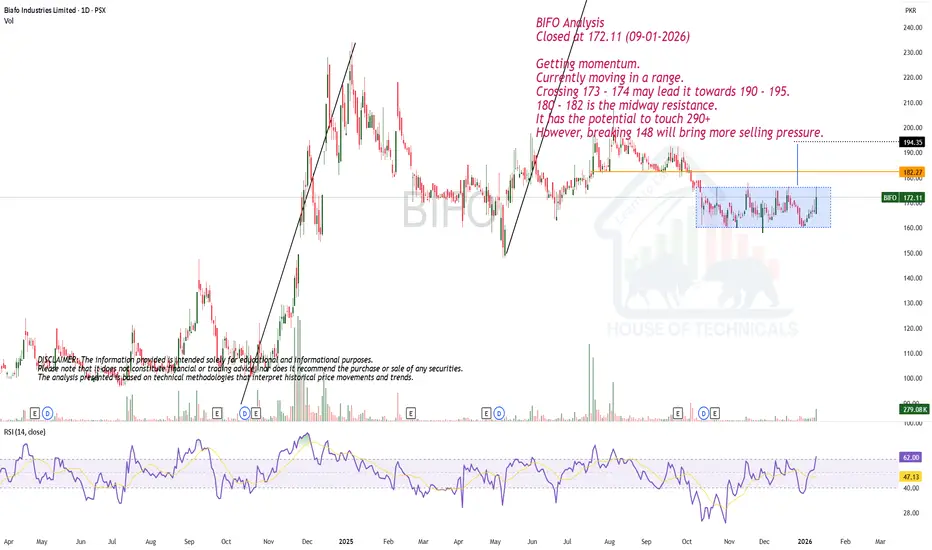
Getting momentum.BIFO Analysis
Closed at 172.11 (09-01-2026)
Getting momentum.
Currently moving in a range.
Crossing 173 - 174 may lead it towards 190 - 195.
180 - 182 is the midway resistance.
It has the potential to touch 290+
However, breaking 148 will bring more selling pressure.
EURUSD - Retest of support at 1.170 on a bullish trendFX:EURUSD is in a bullish trend phase and is forming a correction to retest the key psychological support level. Bulls may influence the situation...
The dollar has fallen sharply due to economic problems, which has triggered a rise in the euro, which is trying to stay above 1.170.
After rallying and updating the interim high to 1.1768, the currency pair entered a correction phase and is testing 1.170, an important technical and psychological support level.
Support levels: 1.1700, 1.1672, 1.1685
Resistance levels: 1.1763, 1.1804
A false breakdown and the bulls holding the price above 1.170 could form a reversal pattern and give a chance for growth within the local bullish trend
Best regards, R. Linda!

Currently in a Consolidation Box & at Channel Bottom.PREMA Analysis
Closed at 38.95 (22-01-2026)
Currently in a Consolidation Box & at Channel Bottom.
Also there is Strong Trendline support around 38 - 39.
If this level is sustained, we may witness an upside towards 42 - 43 initially.
The Uptrend will only start once it crosses & Sustained its previous Resistance
around 44.

USDCHF - Anticipating the Price to Bounce off Weekly SupportThe image provided displays a technical analysis chart for the USD/CHF (US Dollar/Swiss Franc) currency pair on a weekly timeframe, showing price consolidation within a triangle pattern.
Chart Analysis and Trading Strategy 📊
The chart indicates the following key technical elements and a potential trading bias:
Currency Pair: USD/CHF. 💴
Pattern: The price action is consolidating within a "Triangle" or symmetrical triangle pattern, characterized by converging trendlines (lower highs and higher lows). This generally indicates a period of market indecision before a potential breakout.
Key Levels: 🎯
Weekly Resistance: A resistance zone is marked near the upper boundary of the triangle. A breakout above the resistance area (around 0.8145 according to recent analysis) would confirm a strong upward movement.
Weekly Support: A support area is indicated near the lower boundary of the triangle (around 0.7865). A break below this support would invalidate the bullish scenario and suggest further decline.
Indicated Bias: The annotation "LOOK FOR LONGS" suggests a bullish bias, anticipating that the price will bounce off the lower trendline/support and eventually break out to the upside. Other recent analyses on the pair also suggest a potential for recovery after testing key support levels. ⬆️

AAVEUSDT - Bear market. Breakdown of support at 162.0BINANCE:AAVEUSDT is testing the support of the range amid a market decline. Bulls are reversing their positions due to weakening fundamentals. Focus on support at 162.0
Bitcoin is falling due to the deterioration of the fundamental background. The altcoin market is reacting aggressively and entering a short zone. AAVE is breaking out of the range, and if it closes below 162.0, the decline may intensify
A pre-breakout base is forming relative to 162.0. Before the fall, a retest of the local liquidity zone at 165.9 is possible. However, closing below the support at 162.0 will be a signal for a further decline to 157.0 - 148.0.
Support levels: 162.0, 157.23, 148.06
Resistance levels: 165.9, 169.1
The price breaking out of the range suggests readiness for further movement. A breakout of support indicates that the movement will be downward. Closing below 162.0 could trigger a sell-off to 157 - 148 - 145.
Best regards, R. Linda!

XAUUSD (GOLD) – 1-Day Timeframe Tradertilki Swing AnalysisMy friends, greetings,
I have prepared a swing analysis for XAUUSD-Gold on the 1-day timeframe and would like to share it with you.
Currently, my best buy entry point in this swing analysis is at the 4224.00 level. When price reaches this level, I will open a buy position.
My targets:
TP1: 4307.00
TP2: 4485.00
TP3: 4712.00
My stop level will be at 3979.00. 📊
Risk reward ratio: 2,00
This is not a scalping analysis, but a long-term daily swing analysis. While scalping signals may hit targets within the same day, swing analysis targets can take longer to reach. I wanted to explain this clearly for friends who may not know.
My friends, I share these analyses thanks to each like I receive from you. Your likes increase my motivation and encourage me to support you in this way.✨
Thank you to all my friends who support me with their likes.❤️
Respect and love. 🙏

USDJPY - The correction may be over. Bullish trend The Japanese yen continues to weaken amid a strong dollar and due to the actions of the Bank of Japan. The currency pair may continue its bullish trend...
The global trend is upward. As part of the correction, the currency pair is testing support at 157.76 and forming a long squeeze. The reaction from the bulls is aggressive, and a breakout of the wedge resistance will provide an opportunity for growth.
The dollar is in an upward trend (locally), and this maneuver is supporting the currency pair against the backdrop of a globally weak Japanese yen.
Resistance levels: 158.185, 158.855
Support levels: 157.76, 157.38
If the bulls keep the price above the 157.76-158.0 zone, the market will have good potential and strong support to continue growing towards 158.8-159.5.
Best regards, R. Linda!

GOLD - A long squeeze of support could trigger growthFX:XAUUSD continues to consolidate, Friday's long squeeze (false breakdown) of support provides an opportunity for growth amid geopolitical issues...
The dollar is strengthening against the backdrop of Thursday's economic data and Trump's geopolitical actions, but against this backdrop, gold is behaving quite cautiously and looks quite strong.
Trump said that tariffs on eight European countries could rise to 25% if Greenland is not sold to the US - more tariffs and an escalation of the trade war could lead to a strong market reaction.
In the new trading week, we are awaiting Trump's speech (high volatility possible), US GDP, Core PCE, and PMI. The data may set the medium-term tone for the market...
Resistance levels: 4593, 4621, 4639
Support levels: 4581, 4561, 4550
The long squeeze has shifted the market imbalance towards buyers. Locally, we are seeing consolidation in the 4581-4593 zone. A close above 4593 or a retest of 4581 could trigger further growth within the current trend
Best regards, R. Linda!

Seems like struggling to breakout from a Consolidation Box.AGP Analysis
Closed at 220.70 (16-01-2026)
Seems like struggling to breakout from a Consolidation Box.
Crossing & Sustaining 221 - 222 with Good Volumes may lead
it towards 250+
However, 230 is a mid-way resistance.
But it should not break 208 otherwise, we may witness more
selling pressure.
Channel bottom is around 170 - 173 which seems bit unrealistic.

XAUUSD – 4H Consolidation Before BreakoutGold is trading in a tight consolidation range after a strong bullish impulse. Price is forming a symmetrical triangle, indicating volatility compression.
Key levels:
Resistance: 4,630 – 4,650
Support: 4,580 – 4,595
Outlook:
Bullish breakout above 4,630 may push price toward 4,680–4,700.
Bearish breakdown below 4,580 can lead to 4,540–4,520.
Plan:
Wait for a clear 4H close outside the range.

GBPJPY - The hunt for liquidity within a bullish trendFX:GBPJPY is testing key areas of interest amid an upward trend as part of a deep correction. Fundamentally, the pound is stronger than the yen...
The Japanese yen continues to decline for economic reasons related to the Bank of Japan. Against this backdrop, the pound is strengthening. Focus on the 211.59 - 212.0 zone, where the battle for position is most likely to take place. If the bulls manage to break through 212, the currency pair could return to an upward trend.
The currency pair is forming a fairly deep correction, but there is no break in the trend structure. A retest of the 0.6-0.7 Fibonacci zone and a retest of the consolidation boundary within the bullish trend have been formed.
Resistance levels: 212.08, 213.01
Support levels: 211.59, 211.31
A false breakout and the market holding above the key support zone could give buyers a chance to resume the uptrend after the correction ends.
Best regards, R. Linda!

GOLD - The battle for 4600 within the great consolidation...FX:XAUUSD is testing the 4581 zone as part of a correction, forming an intermediate bottom and consolidating above 4600, indicating a confident bullish trend.
PPI showed growth in November, retail sales exceeded expectations, and the unemployment rate fell to 4.4% in December, which slightly reduces the likelihood of an early easing of Fed policy, putting pressure on gold.
Geopolitics: Tensions between the US and Iran, as well as around the independence of the Fed. Risks are high...
Today, data on US unemployment benefit claims will be released. High figures could reinforce fears of an economic slowdown and support gold.
The short-term correction in gold is due to strong data from the US, but the upward trend remains influenced by geopolitics and pressure on the Fed. Weak employment data could bring the price back to record levels.
Resistance levels: 4612, 4630, 4643
Support levels: 4600, 4581, 4561
Consolidation is forming against the backdrop of a bullish trend. The market is likely to test 4581-4561 as part of profit-taking or correction before continuing to grow. However, if the bulls keep the price above 4600, growth may begin earlier...
Best regards, R. Linda!

SOLANA - The battle for resistance 145. The bulls have a chanceBINANCE:SOLUSDT.P breaks resistance and tries to stay above key levels. The fundamental background for cryptocurrencies is gradually improving. What can be expected in the short and medium term?
The crypto market has received support amid progress in US regulatory initiatives: the Digital Asset Market Clarity Act has been submitted for consideration, which increases regulatory predictability and attracts institutional capital. Progress in regulation is laying the foundation for sustainable growth in the crypto market by attracting institutional capital.
Bitcoin is strengthening against the backdrop of positive news related to market regulation and is moving into a local bullish trend. Against this backdrop, SOL is breaking through consolidation resistance and attempting to stay above 143.5 - 144.7...
Resistance levels: 156.5, 160.0
Support levels: 144.7, 143.5, 142. 0
If the bulls manage to keep SOL above the key support zone of 143.5 - 144.7 after breaking through resistance and a reversal pattern forms, a rally to 155 - 160 can be considered.
Best regards, R. Linda!

GOLD - Consolidation ahead of news. ATH retestFX:XAUUSD is trading around $4630, pretty close to its all-time high, but since the session opened, the price has jumped a lot because of the aggressive bull market, which could lead to a correction. News ahead...
US inflation (CPI) slowed in December, and the market expects 2-3 Fed rate cuts in 2026, which exceeds the regulator's forecasts. Protests in Iran and threats of possible intervention by the US; tensions surrounding the independence of the Fed (investigation into Powell); and the tense situation in Eastern Europe are creating geopolitical risks.
• US PPI data will be released today.
• Higher inflation figures may temporarily support the dollar and limit gold's growth.
• Traders are also awaiting the Supreme Court's decision on Trump's tariffs, with a 72% probability of cancellation. If this is confirmed, the market may react strongly...
Resistance levels: 4630, 4650, 4675
Support levels: 4600, 4577
Technically, the ideal scenario would be to wait for a correction, for example to 4605-4600, or to the support level of the trading range to form an ideal entry point. But against the backdrop of an aggressive market, bulls are likely to push the price up from the 4630 zone...
Best regards, R. Linda!

GBPNZD - Ascending triangle on an upward trendFX:GBPNZD has moved into consolidation amid an uptrend and is forming another bullish structure. Focus on trigger 2.340
The global trend for the currency pair is bullish. Against the backdrop of the main trend, consolidation is forming in the form of an ascending triangle, which is generally a fairly strong bullish conglomerate. If resistance is broken, consolidation may move into a distribution phase
After the short squeeze, a weak reaction is forming and the market is quickly returning the price to the resistance level of 2.340. Closing above this level could trigger a rally to 2.35.
Resistance levels: 2.34, 2.355
Support levels: 2.338, 2.336
Before the resistance is broken, a long squeeze of local support may be triggered. However, a quick retest of resistance and a close above the level may trigger distribution towards 2.355.
Best regards, R. Linda!

ETHEREUM - Retest resistance before a possible declineBINANCE:ETHUSDT is trading within the range of 3050-3150, with a local and global bearish trend. The market is still waiting for positive drivers, and until they appear, it is possible to trade within the channels...
Against the backdrop of a global downtrend, Bitcoin is forming a bullish wedge/ascending triangle, which in the current circumstances I consider to be a consolidation pattern before a possible liquidation and decline to 80-75K, which in general could trigger a decline across the entire market. Ethereum is forming a trading range against the backdrop of a local downtrend.
Focus on trading boundaries, namely resistance at 3150
After a short squeeze and a price decline to 3060, a liquidity pool of 3060-3050 (area of interest for MM) has formed below the local level
Resistance levels: 3150 - 3181
Support levels: 3083, 3056, 3000
A retest of 3150 and a lack of momentum may confirm the dominance of bears in the market, which in turn may form a false breakout of resistance and a reversal to the zone of interest and liquidity pool 3050.
Best regards, R. Linda!

a long consolidation / sideways box.CEPB Analysis
Closed at 37.48 (12-01-2026)
a long consolidation / sideways box.
Crossing 40 - 41 with Good Volumes &
sustaining it may lead the price towards 59 - 60.
Otherwise, it may continue its sideways movement, with
a Channel Bottom around 21 - 22.

GOLD - Consolidation near 4600. Breakout or correction?FX:XAUUSD has updated its ATH to 4600. A local range is forming, with growth potential, against the backdrop of escalating geopolitical risks and concerns about the independence of the Fed, which remain.
Trump's consideration of military operations in Iran amid internal unrest and the tense situation in the Russia-Ukraine conflict (emergency UN Security Council meeting) create geopolitical risks.
Questions for the Fed: A criminal investigation has been launched against Chairman Powell, heightening concerns about pressure on the central bank's independence.
US employment data (NFP) for December (+50K) was weaker than expected, supporting expectations of Fed policy easing. Attention is shifting to December inflation data (CPI), which will assess the likelihood of a rate cut in March (current probability ≈30%).
The correction may continue, but the combination of risks and soft monetary policy creates medium-term support for further growth.
Resistance levels: 4600, 4625, 4650
Support levels: 4561, 4550, 4517
Since the opening of the session, gold has exhausted its intraday ATR reserve, which creates additional opportunities for consolidation or correction, within which the market may test key support zones, such as the previous ATH, before continuing to grow. A long squeeze of the specified support may provide the market with liquidity for further growth. However, an aggressive market could trigger a breakout of 4600 without correction...
Best regards, R. Linda!

USDJPY - Consolidation may turn into upward distribution FX:USDJPY is storming the resistance zone of the current consolidation. Focus on 157.88, a breakout of the current border could trigger an upward movement...
The Japanese yen is testing the intermediate bottom, hinting that the currency is preparing to continue falling. Against the backdrop of a weak yen and a strong dollar, the currency pair may continue its upward trend.
Retesting resistance, the reaction from the bears is weakening, and the bulls are trying to keep the price above 157.88. If there is no reaction (pullback), then growth may continue from the 157.15 - 157.88 zone, provided that the price closes above the level.
Resistance levels: 157.88
Support levels: 157.15, 156.18
Technically, against the backdrop of an uptrend, consolidation is forming, within which the market is not updating local lows, but is gradually contracting towards resistance at 157.88. There is a high probability of a breakout (possibly after a slight correction to local support). Nearest targets: 160.0 - 161.5
Best regards, R. Linda!

Silver LiningSilver is sitting at a key decision area right now. After a clean push higher, a pullback, and then another leg up, structure still looks bullish. Price has been holding above the rising moving average and continues to make higher lows, which is usually a good sign for continuation.
That said, we are now pushing directly into a major resistance zone. This lines up with the prior high and the 0.0 fib level from the last move. Areas like this are where price often pauses, chops around, or rejects before making its next real move. This is not a spot where I want to guess direction. This is a spot where I want to wait for confirmation.
If this move is going to continue higher, I want to see price hold above the moving average, keep pullbacks shallow around the 23.6 to 38.2 fib zone, and then break and hold above current highs with expanding volume. If that happens, it would suggest another leg higher is likely.
On the other hand, if price can’t get through this area, I’ll be watching for rejection wicks, failed breakout attempts, and a loss of the moving average. That would open the door for a deeper pullback into the fib retracement zone, potentially toward the 38.2, 50, or even 61.8 levels. I’ll also be watching RSI for signs of momentum fading rather than focusing on the absolute reading itself.
RSI is elevated but not extreme. In strong trends, it can stay high longer than most people expect, so I care more about divergence, structure, and failure signals than the raw number. Volume has been expanding on pushes and contracting during consolidation, which is healthy. The next real expansion out of this range should give us direction.
Bottom line, this is not a place to predict. Price is compressing at resistance, and the next real move should come from either a breakout or a clear rejection. Until that happens, this is range behavior, and patience is key. Let price show its hand.

GOLD - Storm 4475 ahead of the news. NFP aheadFX:XAUUSD is stabilizing at 4475 in a state of consolidation. However, ahead lie US employment data and the Supreme Court's decision on Trump's trade powers...
Fundamentals:
60K new jobs are expected to be created in December, unemployment may fall to 4.5%, and wage growth to 3.6% y/y. As for the Supreme Court, it will decide whether Trump can impose tariffs without Congress' approval (IEEPA law).
The market also continues to expect 2-3 interest rate cuts in 2026. Geopolitical tensions are supporting demand for defensive assets.
Today, the market is waiting for NFP. Strong data will lower expectations of Fed easing, strengthen the dollar, and put pressure on gold (to $4300), but weak NFP data will reinforce bets on rate cuts and support gold (to $4550). The court's decision on tariffs will affect trade policy and the dollar.
Resistance levels: 4475, 4500, 4525
Support levels: 4460, 4442, 4427
A breakout and consolidation above 4475 could open the way to 4500, a breakout of which could trigger a rally to 4525-4550, but given the volatility of the news, the market may test the support zone before a possible rise.
Best regards, R. Linda!
