Contains image

EURUSD My Opinion! BUY!
My dear followers,
I analysed this chart on EURUSD and concluded the following:
The market is trading on 1.1644 pivot level.
Bias - Bullish
Technical Indicators: Both Super Trend & Pivot HL indicate a highly probable Bullish continuation.
Target - 1.1658
About Used Indicators:
A super-trend indicator is plotted on either above or below the closing price to signal a buy or sell. The indicator changes color, based on whether or not you should be buying. If the super-trend indicator moves below the closing price, the indicator turns green, and it signals an entry point or points to buy.
Disclosure: I am part of Trade Nation's Influencer program and receive a monthly fee for using their TradingView charts in my analysis.
———————————
WISH YOU ALL LUCK

USDJPY: Selling the Pullback into Supply (Macro Divergence)⚡ Macro Thesis: Monetary divergence is now confirmed. The Fed has cut rates (weakening support for the dollar), while the market expects a "hawkish" move from the Bank of Japan next week. This is compressing the yield spread, making shorting USD/JPY the key trade of the moment.
📊 Technical Setup (H1/H4): After the strong post-FOMC bearish momentum, the price is undergoing a natural technical retracement (Pullback). We are not selling the breakout, but rather the "best price" in the supply zone.
Structure: The H4 trend is bearish (Lower Lows, Lower Highs).
Entry Zone: The price is re-entering the 156.20 - 156.40 area. This zone coincides with:
The 0.5 - 0.618 Fibonacci level (Golden Pocket).
A previous H1 supply zone.
The previous support breakout area (Flip Zone).
🎯 Plan: We are waiting for a rejection reaction (wick/upper shadow) in this area to enter short towards the lows.
Entry: 156.20 - 156.40
Stop Loss: 157.10 (Above the last H1 relative high).
Target: 153.50 (Macro Support).
⚖️ Risk/Reward: ~1:2.5
Happy trading!
Sic Parvis Magna

USDJPY Massive Short! SELL!
My dear subscribers,
My technical analysis for USDJPY is below:
The price is coiling around a solid key level - 156.42
Bias - Bearish
Technical Indicators: Pivot Points Low anticipates a potential price reversal.
Super trend shows a clear sell, giving a perfect indicators' convergence.
Goal - 155.63
About Used Indicators:
By the very nature of the supertrend indicator, it offers firm support and resistance levels for traders to enter and exit trades. Additionally, it also provides signals for setting stop losses
Disclosure: I am part of Trade Nation's Influencer program and receive a monthly fee for using their TradingView charts in my analysis.
———————————
WISH YOU ALL LUCK

AUDCHF Trading Opportunity! BUY!
My dear followers,
I analysed this chart on AUDCHF and concluded the following:
The market is trading on 0.5331 pivot level.
Bias - Bullish
Technical Indicators: Both Super Trend & Pivot HL indicate a highly probable Bullish continuation.
Target - 0.5345
Safe Stop Loss - 0.5323
About Used Indicators:
A super-trend indicator is plotted on either above or below the closing price to signal a buy or sell. The indicator changes color, based on whether or not you should be buying. If the super-trend indicator moves below the closing price, the indicator turns green, and it signals an entry point or points to buy.
Disclosure: I am part of Trade Nation's Influencer program and receive a monthly fee for using their TradingView charts in my analysis.
———————————
WISH YOU ALL LUCK

Bank of America Flirts with HistoryBank of America has plodded higher for months, and now it’s flirting with history.
The first pattern on today’s chart is the $55.08 level. It was the previous all-time high from 2006, before the global financial crisis. BAC suffered a 95 percent drawdown from that peak and has now returned to the same historic line. That could keep traders on guard for a potential breakout.
Second, the megabank has made a series of higher lows while staying above its rising 50-day simple moving average. Is an intermediate-term uptrend in effect?
Next, MACD is rising and the 8-day exponential moving average (EMA) is above the 21-day EMA. Those patterns may reflect short-term bullishness.
Finally, BAC is an active underlier in the options market. That could help traders take positions with calls and puts.
TradeStation has, for decades, advanced the trading industry, providing access to stocks, options and futures. If you're born to trade, we could be for you. See our Overview for more.
Past performance, whether actual or indicated by historical tests of strategies, is no guarantee of future performance or success. There is a possibility that you may sustain a loss equal to or greater than your entire investment regardless of which asset class you trade (equities, options or futures); therefore, you should not invest or risk money that you cannot afford to lose. Online trading is not suitable for all investors. View the document titled Characteristics and Risks of Standardized Options at www.TradeStation.com . Before trading any asset class, customers must read the relevant risk disclosure statements on www.TradeStation.com . System access and trade placement and execution may be delayed or fail due to market volatility and volume, quote delays, system and software errors, Internet traffic, outages and other factors.
Securities and futures trading is offered to self-directed customers by TradeStation Securities, Inc., a broker-dealer registered with the Securities and Exchange Commission and a futures commission merchant licensed with the Commodity Futures Trading Commission). TradeStation Securities is a member of the Financial Industry Regulatory Authority, the National Futures Association, and a number of exchanges.
Options trading is not suitable for all investors. Your TradeStation Securities’ account application to trade options will be considered and approved or disapproved based on all relevant factors, including your trading experience. See www.TradeStation.com . Visit www.TradeStation.com for full details on the costs and fees associated with options.
Margin trading involves risks, and it is important that you fully understand those risks before trading on margin. The Margin Disclosure Statement outlines many of those risks, including that you can lose more funds than you deposit in your margin account; your brokerage firm can force the sale of securities in your account; your brokerage firm can sell your securities without contacting you; and you are not entitled to an extension of time on a margin call. Review the Margin Disclosure Statement at www.TradeStation.com .
TradeStation Securities, Inc. and TradeStation Technologies, Inc. are each wholly owned subsidiaries of TradeStation Group, Inc., both operating, and providing products and services, under the TradeStation brand and trademark. When applying for, or purchasing, accounts, subscriptions, products and services, it is important that you know which company you will be dealing with. Visit www.TradeStation.com for further important information explaining what this means.

Eli Lilly May Be OversoldEli Lilly surged last month, and now it’s pulled back.
The first pattern on today’s chart is the 50 percent retracement of the advance. That may suggest its direction is pointing higher. Prices have also stabilized at the psychologically important $1,000 level.
Second, the 50-day simple moving average (SMA) had a “golden cross” above the 200-day SMA in early November. That could reflect a bullish long-term uptrend.
Third, the 8-day exponential moving average (EMA) has remained above the 21-day EMA. That may reflect a bullish short-term uptrend.
Finally, stochastics have dipped to an oversold condition.
TradeStation has, for decades, advanced the trading industry, providing access to stocks, options and futures. If you're born to trade, we could be for you. See our Overview for more.
Past performance, whether actual or indicated by historical tests of strategies, is no guarantee of future performance or success. There is a possibility that you may sustain a loss equal to or greater than your entire investment regardless of which asset class you trade (equities, options or futures); therefore, you should not invest or risk money that you cannot afford to lose. Online trading is not suitable for all investors. View the document titled Characteristics and Risks of Standardized Options at www.TradeStation.com . Before trading any asset class, customers must read the relevant risk disclosure statements on www.TradeStation.com . System access and trade placement and execution may be delayed or fail due to market volatility and volume, quote delays, system and software errors, Internet traffic, outages and other factors.
Securities and futures trading is offered to self-directed customers by TradeStation Securities, Inc., a broker-dealer registered with the Securities and Exchange Commission and a futures commission merchant licensed with the Commodity Futures Trading Commission). TradeStation Securities is a member of the Financial Industry Regulatory Authority, the National Futures Association, and a number of exchanges.
TradeStation Securities, Inc. and TradeStation Technologies, Inc. are each wholly owned subsidiaries of TradeStation Group, Inc., both operating, and providing products and services, under the TradeStation brand and trademark. When applying for, or purchasing, accounts, subscriptions, products and services, it is important that you know which company you will be dealing with. Visit www.TradeStation.com for further important information explaining what this means.

December MM Exposure & Positioning GEX VEX CEX DECEMBER Exposure read SP:SPX AMEX:SPY
Positioning: upward drift 7000
GEX: Easy to slip quickly up to a hard rally to 7000
VEX: if IV drops further they start buying 6950 adding fuel to the rally up
CEX: this just looks like constant delta hedging
🎯Target right now 6950 we will overshoot to 7000 MM will sell and it will drop down according to these positions

ETH Loaded: One More High or Bull Trap?
BINANCE:ETHUSDT COINBASE:ETHUSD recent price action strongly resembles an leading diagonal: the structure is stretched, but the local price action remains bullish. The market is currently trading between the Q1 and Q2 VWAP bands, which supports the idea of another upward push.
If the scenario is correct, ETH should take out the previous local high around 3,446 and deliver a final upside burst into the 3,400–3,450 zone in the near term.
Invalidation: a break below the 3,145 local low. This would negate the diagonal structure and require a reassessment of the bullish outlook.

LRC Showing Renewed StrengthLRC - movement is observed within the bullish flag pattern
We have exited the liquidity zone after a false breakout
It is now more likely that the movement will continue within the pattern to its upper boundary according to Fibonacci levels
Full breakdown with levels and graphs on the website

USDJPY 30Min Engaged ( Bullish Volume Reversal entry Detected )⚡Base : Hanzo Trading Alpha Algorithm
The algorithm calculates volatility displacement vs liquidity recovery, identifying where probability meets imbalance.
It trades only where precision, volume, and manipulation intersect —only logic.
✈️ Technical Reasons
/ Direction — LONG / Reversal 155.170 Area
☄️Bullish momentum confirmed through strong candle body.
☄️Structure shifted with higher-low near key demand base.
☄️Volume expanding confirms order-flow alignment upward.
☄️Buyers reclaimed imbalance with sustained clean break.
☄️Algorithm detects rising momentum under low liquidity.
⚙️ Hanzo Alpha Trading Protocol
The Alpha Candle defines the day’s real control zone — the first battle of momentum.
From this origin, the Volume Window reveals where the next precision strike begins.
⚙️ Hanzo Volume Window / Map
Window tracked from 10:30 — mapping true market behavior.
POC alignment exposes institutional bias and breakout potential zones.
⚙️ Hanzo Delta Window / Pulse
Delta window monitors real buying vs. selling power behind each move.
Tracks volume aggression to expose who controls the candle — buyers or sellers.
When Delta aligns with Volume Map, momentum becomes undeniable.

INTERVIEW: EXCAVO View 12/12/25In my previous post, I invited you to ask any questions you had about the current market, the cycle structure, Bitcoin dominance, altcoins, timing, and everything in between.
You asked - and here are the detailed answers.
This is the continuation of our interview series.
I have taken every question from the comments, grouped them under your usernames, and provided full, transparent explanations based on my current market view.
Let's dive in.
@just5
Q:
Why do you say the bear market started in November? If it started earlier, why not in October?
Where does the 126k top come from?
Why is Bitcoin dominance so high?
Why haven't many altcoins (ETH, SOL) broken their previous highs? How far can they fall?
Your analysis is based on past cycles and fractals. Do you admit you can be wrong?
A:
I do not define the beginning of a bear market strictly by the date of the absolute top. For me, the trigger is the structure on the weekly timeframe. The formal high was reached in October, but the signal that confirmed the start of the bear phase was the first strong red weekly candle, which appeared in November. That is why I mark November as the beginning of the bear market.
The 126k level is not something random - the market simply traded there (around 126,250 USD depending on the exchange). So the level itself is not in question.
As for Bitcoin dominance - it is very simple. We have one main instrument in the market: BTC. It defines the weather for the entire crypto market.
When BTC rises, some alts rise and others lag.
When BTC falls, everything falls - especially assets with weaker liquidity or fundamentals.
Historically, people traded a lot of alt/BTC pairs. Many even believed altcoins were created mainly to accumulate more BTC. Today this logic still works: liquidity and attention gravitate toward Bitcoin, which naturally leads to high dominance.
Regarding ETH and SOL: I honestly expected ETH to break its previous ATH. On SOL, I have written a separate idea (I will attach the link) where, back when ETH was around $1700 and SOL was around $150, I already said that between these two I prefer ETH because cycles matter. Above $200-250 on SOL and $4900-5000 on ETH there is a large liquidity cluster. The market will eventually go there, but the question is when. This expectation kept many people in top altcoins without taking profit.
How far can altcoins fall?
My baseline scenario is a 50-60% correction from their peaks, and that is the minimum. Crypto cycles often surprise with deeper drawdowns.
Regarding the fractal and cycle approach - yes, my view is based on previous cycles. But of course, I admit that I can be wrong. If I am wrong, I will acknowledge it publicly. TradingView does not allow deleting ideas, everything stays visible, so everyone can judge my track record objectively.
@louistran_016
Q:
If the 41% drop (126k -> 75k) happened in 2 months, why would the move to 60k take another 10 months?
Is the 60k downside target too high?
Is September 2026 too late for a market bottom?
If the previous bottom in 2022 was at the 100-month EMA (around 16k), should not the next bottom be around 44k?
A:
I never said the drop to 60k must take 10 months. The chart is not obligated to move like "stick down -> stick up". We have only two axes: price and time.
The market can:
drop quickly,
then consolidate,
then spend months accumulating before the next move.
Even if we hit 60k in 3 months, it does not mean the market will immediately reverse. Accumulation can take time.
The 60k target is indeed a "high" bottom for a bear market because it is only about a 50% correction from the peak. I do not exclude deeper scenarios: 60-65-70% drawdowns are normal for crypto. But even 60k is a much better long-term buying zone than 90-100k or current prices.
September 2026 is not "too late" in my view. It aligns well with the classical cycle structure: distribution -> decline -> depression -> accumulation.
Regarding the 44k idea based on the 100-month EMA:
It is absolutely possible. I do not rule it out. But tactically, I first target the 60-64k zone and then will reassess whether deeper levels become realistic.
@ikkie
Q:
Many people are calling this a bear market. Is that a bad sign?
A:
What I actually see is many influencers publicly questioning whether this is a bear market because they did not exit in time, and now it is hard for them to admit it to their audiences.
The fact that many people call it a bear market is completely normal. The real question is not how people label the market, but what you do with your money.
Being out of the market is also a position, sometimes the best one.
When price enters a transition phase, staying flat can be a very strong decision.
@luaselene
Q:
What about ETH?
A:
ETH has a large liquidity zone above $4900-5000. I expect this region to be taken in one of the future bullish phases, but not in the near future. More realistically, this is a 2026-2027 story. Within the current part of the cycle, I do not expect ETH to sustainably break the ATH.
@mpd
Q:
I expect a retest of 100k before a crash to 35k. Thoughts?
A:
A very realistic scenario.
A retest of 100k is the perfect psychological trap:
it attracts the last wave of euphoric buyers,
it loads the market with long positions (usually with leverage),
and then the market can wipe them out with a deeper drop, even toward your 35k target.
Crypto loves this pattern: round number -> FOMO -> leverage -> liquidation.
@KoDPrey
Q:
Why should the drop to 70k lead to a long correction instead of being a quick liquidity sweep before a move to 150-200k?
Why do you think this cycle repeats previous ones?
Can BTC dominance reach 70% in a bear market?
Aren't we in the middle of a bull market?
If you were wrong on PORTAL longs, can you also be wrong about the entire cycle?
A:
I do not think the drop to 70k must be a simple wick with an instant reversal. Historically, Bitcoin cycles include a depression phase where people lose hope, liquidity gets washed out, and even long-term holders capitulate.
After this phase, a move toward 150-200-250k makes much more structural sense.
A simple "drop -> instant all-time-high" scenario resembles the old "supercycle" meme. Possible? Maybe. Likely? In my view - not now.
This cycle is indeed different:
almost no broad altseason,
many more participants, institutions, and countries involved,
much more infrastructure that can liquidate traders' positions,
more derivatives, more leverage, more points of failure.
But Bitcoin's macro-cycle structure is still fractally consistent.
The shapes and speeds change - the logic does not.
Can Bitcoin dominance hit 70%?
Yes. In crypto anything is possible. I consider this scenario totally realistic, even within a bear market.
Are we in the middle of a bull market?
In my view - no. I do not think we are anywhere near the middle of a bull run.
Regarding PORTAL: yes, I was wrong. And not only there, I have been wrong many times. But even with those mistakes, I closed my positions, exited both spot and margin, and avoided much deeper drawdowns.
Of course I can be wrong about the cycle. I am sharing my view, not claiming infallibility. My win rate is far from perfect, and every idea remains public on TradingView. Anyone can check them later.
@houari14
Q:
What do you think about the USDT Dominance index (USDT.D)? Is it reliable?
A:
Honestly, I barely use USDT.D in my analysis. Yes, it shows whether market participants prefer sitting in stablecoins or taking risk, but for me it is not a primary metric.
I focus more on:
BTC price,
market structure,
dominance of BTC itself,
volume behavior,
and how major altcoins react.
@anatta_
Q:
How far can BTC fall in this bear market?
How long will the bear market last?
If BTC holds 80-85k for a few months, can it start a new bull cycle?
A:
I expect at least a 50% correction from the top. Realistically, 60-65-70% drawdowns are absolutely possible. More than 75% I do not consider my baseline, but in crypto nothing is impossible.
Regarding duration:
My estimation is that the bear market should end toward late 2026. Around September 2026 I expect a major bottom, a zone where long-term accumulation becomes attractive.
If BTC holds 80-85k for a few months, yes, theoretically it could trigger a new bullish phase, especially if a strong new narrative appears. But I am not betting on that scenario. I prefer staying out of the market until the cycle structure becomes clear.
@tommayhew
Q:
Is there a connection between the recent Cloudflare security incident and the crypto drop?
A:
The timing was surprising, and it is natural to link the two events. But at this moment I do not see solid evidence that the incident caused the market drop. Maybe more information will appear later, but for now I treat it as a coincidence rather than a catalyst.
@simplejoe1
Q:
We already have ETFs and a pro-BTC U.S. president. Could this be the absolute top?
A:
ETFs and a pro-Bitcoin president do not automatically guarantee continuous growth, nor do they define the market top.
The president also has:
his own memecoin, check how its chart looks,
his own crypto-investing fund, check its token too.
These examples show that one person, even the U.S. president, does not determine the entire market. The market is bigger and more complex than a single headline.
Best regards,
EXCAVO
Uranium Energy1.) Other 3 in high
2.) Not 3×1-2 (blue AT forecast) but a B (golden forecast), which is also likely to exceed.

Closing Price Exploitation and Gaps Across Regions1. What Is Closing Price Exploitation?
Closing price exploitation refers to strategic actions taken by market participants—often large institutions, hedge funds, or algorithmic traders—to influence or take advantage of the closing price of a market. The closing price is a benchmark for:
Portfolio valuation
ETF/Index calculation
Mutual fund NAV
Margin requirements
Options settlement (for some markets)
Technical analysis (candles form based on closing price)
Because the closing price is so influential, it becomes a target for potential manipulation or strategic trading.
1.1 Why the Closing Price Matters
The closing price is considered the most important price of the trading day. It represents:
The final consensus of value
The point where liquidity peaks
A reference for next day’s sentiment
The price used by analysts and chartists
Any move near the close can change the market’s perception and technical structure.
1.2 How Exploitation Happens
Marking the Close
Large players place aggressive buy or sell orders in the last few minutes to push the closing price toward a desired level.
Example: A fund wants its quarterly report to show strong performance, so it pushes up prices of its holdings near the close (window dressing).
Exploiting Low Liquidity
In many markets, liquidity thins out near the close.
Even moderate orders can shift prices significantly.
High-frequency traders (HFTs) also exploit thinning order books to trigger stop-losses or manipulate closing auctions.
Taking Advantage of Index Rebalancing
Index funds must buy or sell assets at the close when weights change.
Smart money trades ahead of index funds, capturing profitable price moves.
Closing Auction Strategies
Some markets use auction mechanisms for the final trade.
Traders exploit mispricing during this auction by submitting large imbalance orders.
Influencing Options Expiry
In markets where options settle based on closing prices, aggressive buying/selling near expiry can shift settlement prices, generating profits on derivatives positions.
1.3 Who Performs Closing Price Exploitation
Hedge funds
HFT firms
Proprietary trading desks
Market makers
Large institutional investors
Retail traders rarely benefit from such strategies because they lack capital and execution speed.
2. Price Gaps Across Global Regions
Because different markets open and close at different times, prices across regions rarely move in a smooth, continuous way. Instead, they often show gaps caused by offshore developments.
2.1 What Is a Price Gap Across Regions?
A regional gap occurs when the price of an asset jumps or drops between the previous region’s close and the next region’s open due to:
Overnight news
Economic data releases
Commodity price moves
FX volatility
Geopolitical events
Market sentiment arising in other time zones
2.2 How Time Zones Create Gaps
Financial trading follows a global cycle:
Asia opens first (Japan, China, India)
Europe opens next (UK, Germany, France)
US opens last
When US markets close, Asia is still inactive. During the hours Asia is offline:
US equities move
Commodities like crude oil trade overnight
Bond yields react to news
Forex markets continue 24/5
When Asia opens again, prices adjust suddenly, creating a gap up or gap down.
2.3 Examples of Regional Gaps
US closes strong → Asia gaps up
If NASDAQ rallies 2% at night, markets like Nikkei, Hang Seng, or Nifty may open with a positive gap.
Europe experiences a crisis → US gaps down
Events like Brexit-related shocks caused large pre-market gaps in US indices.
Oil shocks → Middle East markets gap
Crude oil futures trade almost non-stop. Sudden spikes cause Gulf markets to open sharply higher.
US tech earnings → Global tech sector gaps
Apple, Google, or Tesla results released after US close impact Asia and Europe the next morning.
2.4 Categories of Gaps
Globally, gaps can be classified as:
Common gaps – small, frequent gaps due to routine overnight flow
Breakaway gaps – large gaps signaling trend reversals or breakouts
Runaway gaps – mid-trend, caused by strong momentum
Exhaustion gaps – appear at the end of strong moves, often reversing soon
Across regions, breakaway gaps and runaway gaps are more common because global news often triggers sharp repricing.
3. Why Gaps Occur More in Some Regions Than Others
Different exchanges have different characteristics:
3.1 Asia Has More Gaps
Because Asia reacts to both US and Europe overnight moves, Asian markets frequently open with big adjustments.
3.2 Europe Has Mid-Cycle Gaps
Europe reacts to Asia’s early moves and anticipates US market openings.
3.3 US Has Fewer Opening Gaps
Although US markets gap as well, they trade after-hours through futures, reducing the magnitude of opening shocks.
4. How Traders Exploit Price Gaps Globally
Professional traders use regional gaps as profitable opportunities.
4.1 Futures Arbitrage
Futures on indices (like Nifty, DAX, Nikkei, S&P 500) trade almost 24 hours.
When spot markets open with gaps, traders exploit:
Spot–futures discrepancy
Mispriced options
Imbalance in global cues
4.2 ADR vs. Local Stock Arbitrage
Many global companies have ADRs listed in the US.
Example: Tata Motors, Infosys, HDFC Bank.
ADR moves overnight in the US
Local shares in India gap up/down next morning
Arbitragers exploit the difference
4.3 Currency Influence
If INR/USD, EUR/USD, or JPY/USD moves sharply overnight:
Stocks sensitive to FX (IT, exporters) show gaps
Traders position for pre-market moves based on FX indicators
4.4 Commodities and Global ETFs
Gold, crude oil, natural gas, and global ETFs trade almost 24/7.
Their overnight fluctuations cause:
Gaps in commodity-dependent equities
Gap-up/gap-down opening in resource-heavy markets
5. Risks of Closing Price Exploitation and Global Gaps
Both phenomena introduce risks.
5.1 False Signals for Retail Traders
Closing price manipulation can make a stock appear bullish or bearish falsely.
5.2 Stop-Loss Hunting
Gaps can trigger stop-losses instantly at open, causing slippage.
5.3 Overreaction and Volatility
Markets may overreact to overnight news during open, leading to rapid reversals.
5.4 Liquidity Shock
Gaps often occur during low liquidity, amplifying price distortions.
6. How Traders Protect Themselves
Avoid placing tight stop-losses overnight
Track global futures (SGX GIFT Nifty, Dow Futures, DAX Futures)
Observe ADR movements
Watch commodity and FX trends
Monitor geopolitical calendars
Use options hedging (protective puts or strangles)
Conclusion
Closing price exploitation and regional gaps are inherent features of a globally interconnected financial system. The closing price is a key benchmark, making it vulnerable to strategic manipulation. Meanwhile, regional gaps arise naturally due to time zone differences and continuous global market flow.
OPEC Price Manipulation and Market Instability1. What Is OPEC and Why Does It Matter?
OPEC is a cartel of major oil-producing nations including Saudi Arabia, UAE, Iraq, Iran, Kuwait, Venezuela, and others. Together, OPEC members control:
Around 40% of world crude oil production
Nearly 80% of global proven oil reserves
Because oil is still the world’s most important energy resource, OPEC’s decisions have the power to shift global prices dramatically. Their strategy is simple: coordinate output to influence the supply side of the market. Since oil demand is relatively inelastic (people still need fuel, heating, transport), small changes in supply can create major price swings.
2. How OPEC Influences or “Manipulates” Oil Prices
OPEC does not directly set the market price. Instead, it manipulates supply, which indirectly manipulates price. The key tools include:
a) Production Cuts
When oil prices are falling due to weak demand or excess supply, OPEC often reduces output. By removing millions of barrels per day from the market, they tighten supply and push prices upward.
Example: In 2020 during the pandemic, OPEC+ cut nearly 10 million barrels/day to stop a price collapse.
b) Production Increases
When prices rise too sharply, OPEC can increase production to cool the market. However, OPEC often avoids aggressive increases because higher prices benefit member revenues.
c) Verbal Intervention (“Jawboning”)
Sometimes OPEC doesn’t act immediately but simply signals cuts or increases. Markets react instantly to statements from the Saudi oil minister or OPEC’s monthly outlook, causing speculative price moves.
d) Strategic Collaboration Through OPEC+
Since 2016, OPEC has partnered with other major producers such as Russia, forming OPEC+. This expanded group controls nearly 50% of global production, giving it even more power to influence prices.
The combination of coordinated supply management, strategic announcements, and alliances is often described as price manipulation, especially by countries that rely on OPEC oil.
3. Why OPEC Engages in Price Manipulation
OPEC’s actions are not random—they serve long-term and short-term goals:
a) Stabilizing Member Revenues
Oil exports are the backbone of many OPEC economies. Budget planning depends on a stable oil price range.
b) Preventing Price Crashes
Uncontrolled production could trigger price wars and economic instability.
c) Maintaining Political Leverage
Oil is a geopolitical tool. Countries with strong influence in OPEC—especially Saudi Arabia—use production control to strengthen their global bargaining power.
d) Supporting Long-Term Investment
Oil exploration and refining require billions in investment. Producers need predictable price ranges to justify projects.
While these goals benefit OPEC members, they can create volatility and uncertainty for consuming nations.
4. How OPEC Contributes to Market Instability
Although OPEC claims to promote market stability, its actions often do the opposite. Instability arises from several mechanisms:
a) Sudden Production Announcements
Unexpected production cuts or increases can cause immediate price shocks. Traders, speculators, and governments react instantly, amplifying volatility.
b) Geopolitical Tensions Among Members
Internal conflicts—such as tensions between Saudi Arabia and Iran or production disputes with Iraq—create unpredictable output behavior.
c) Dependency of Major Economies
Countries like India, China, Japan, and many European nations depend heavily on imported oil. Any OPEC action impacts:
Inflation
Currency value
Fiscal deficit
Energy costs
Stock markets
This dependency magnifies global instability.
d) Speculation in Oil Futures
When OPEC signals a supply cut, speculators rush into long positions in crude futures, pushing prices even higher. When OPEC signals oversupply, short sellers dominate. This creates price swings disconnected from fundamental supply-demand realities.
e) OPEC vs. Non-OPEC Rivalry
The rise of U.S. shale oil has challenged OPEC’s dominance. OPEC responses—like flooding markets to bankrupt shale producers (2014-2016)—cause multi-year instability.
5. Historical Examples of OPEC-Driven Instability
1) 1973 Oil Embargo
OPEC cut exports to the U.S. and Western Europe during the Yom Kippur War. Oil prices quadrupled, leading to global recession.
2) 2014 Price War
Saudi Arabia increased production aggressively to weaken U.S. shale producers. Oil prices crashed from $110 to $30, destabilizing markets worldwide.
3) 2020 Pandemic Crash
Disputes between Russia and Saudi Arabia led to overproduction during collapsing demand. Oil prices fell to historic lows (even negative in futures markets).
Each of these events shows how OPEC’s decisions can reshape the global economy.
6. Impact on Global Markets and Economies
a) Inflation
Higher oil prices directly increase transportation, manufacturing, and utility costs. Inflation rises globally, leading to higher interest rates.
b) Currency Volatility
Oil-importing countries see their currencies weaken when oil becomes expensive. Oil-exporting nations experience the opposite.
c) Stock Market Fluctuations
Sectors such as aviation, shipping, chemicals, manufacturing, and logistics react instantly to oil price changes.
d) Impact on GDP Growth
High oil prices slow global economic growth, reduce consumer spending, and increase production costs.
e) Fiscal Stress for Importing Nations
Countries like India face larger trade deficits when oil prices surge.
7. Is OPEC’s Price Manipulation Always Negative?
Not necessarily. Some analysts argue that OPEC actually prevents extreme instability.
Positive Roles
Prevents supply gluts
Maintains long-term price stability
Supports investment in oil infrastructure
Avoids destructive price wars
However, the challenge is that OPEC decisions are often politically motivated rather than economically balanced.
8. The Future of OPEC and Market Stability
As renewable energy adoption grows and electric vehicles expand, OPEC’s long-term dominance may weaken. Yet in the near future (2025–2040), oil will remain a core energy source. Hence:
OPEC will continue influencing prices
Market volatility will persist
Geopolitical tensions will amplify supply risks
Additionally, climate policies, U.S. shale production, and technological advances will shape future oil dynamics.
Conclusion
OPEC’s influence over global oil markets is undeniable. Through coordinated production strategies, strategic alliances, and political motivations, it often manipulates supply in ways that impact global prices. While OPEC claims to stabilize the market, its actions frequently generate uncertainty, volatility, and economic stress for oil-importing nations and financial markets.
Understanding OPEC’s behavior is essential for policymakers, traders, and investors who seek to navigate global market instability—because in the world of energy, a single announcement from OPEC can reshape the global economy within minutes.

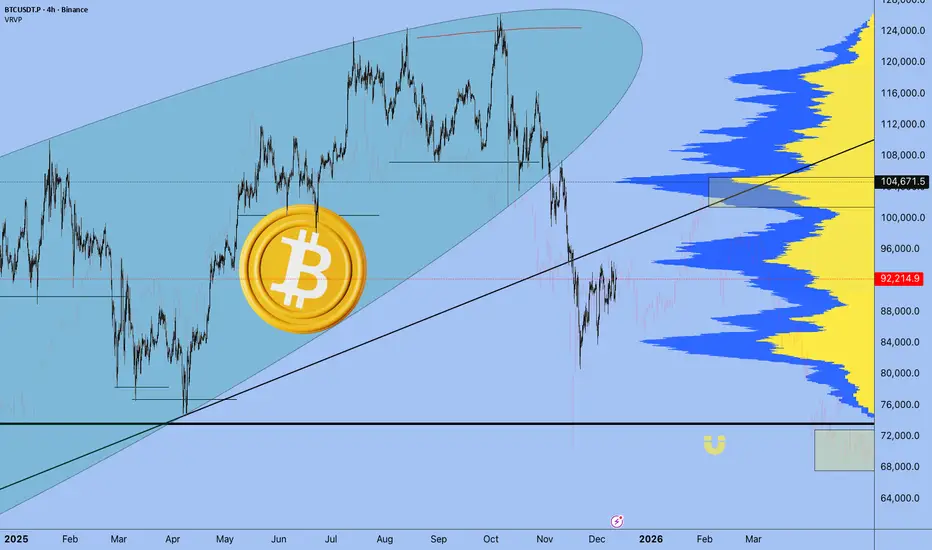
BTCUSD Q1,Q2 2026 ForecastHello traders,
Structure on the BTC weekly is showing a clear distribution pattern:
I think BTC already topped at $126K for this bull cycle indeed. The BOS is a clear confirmation of bearish trend continuation.
Current weekly bounce is approaching a weekly FVG around the 96k area. BTC will seek liquidity before continuation.
If price tags that imbalance and fails to show strength, the next logical draw becomes the weekly demand block at 76k–80k range.
Bias: Expecting a possible short-term bullish push into the weekly FVG → followed by continuation down.
Good Luck
Please drop a like and share your thoughts, traders

Global Supply Chain Sequence Explained1. Raw Material Extraction and Sourcing
The supply chain begins with the extraction or harvesting of raw materials. These materials include:
Minerals (iron, copper, lithium)
Agricultural goods (wheat, cotton, soybeans)
Energy resources (oil, natural gas)
Forest products (timber, pulp)
Companies may source these materials from multiple countries to minimize cost, access better quality, or diversify risk. For example, lithium may come from Chile, cobalt from Congo, rubber from Thailand, and cotton from India. Sourcing decisions are influenced by prices, geopolitical relationships, trade policies, and environmental conditions.
Once extracted, raw materials are shipped to processing facilities through bulk cargo vessels, freight trains, or trucks.
2. Processing and Primary Manufacturing
The next stage is converting raw materials into usable inputs. This includes:
Oil → Plastics
Cotton → Yarn
Iron ore → Steel
Timber → Paper or fiberboard
Processing plants may be located in countries with:
Cheap labor
Access to natural resources
Established industrial infrastructure
Favorable tax policies
For instance, Southeast Asia and China are major hubs for primary manufacturing due to large skilled labor forces and efficient logistics.
Processed materials are then shipped to secondary or final manufacturing units, often across borders.
3. Component Manufacturing and Assembly
Most modern products consist of many components, each produced in specialized factories. A smartphone alone may have:
Chips from Taiwan
Screens from South Korea
Batteries from China
Cameras from Japan
Software from the U.S.
This stage involves:
CNC machining
Electronics fabrication
Chemical processing
Textile weaving
Automotive parts production
Manufacturers build components based on specifications provided by global brands. These components then move to assembly plants where the final product is built.
Global manufacturing hubs like China, Vietnam, India, Mexico, and Eastern Europe dominate this stage due to strong infrastructure and large workforce availability.
4. Global Transportation and Logistics
After components or assembled goods are ready, they need to move across borders. This involves:
Modes of Transport
Sea Freight
Cheapest and widely used for large volumes (containers, bulk cargo).
90% of world trade moves by sea.
Air Freight
Fastest but expensive. Used for electronics, perishables, and urgent shipments.
Rail Freight
Popular for trade between Europe–Asia via the Silk Route.
Road Transport
Essential for last-mile connectivity.
Shipping Containers
Standardized containers have revolutionized trade by allowing goods to seamlessly transition between ships, trucks, and trains. This intermodal system cut costs and reduced damage.
Ports and Customs
Goods pass through:
Export customs clearance
Transshipment hubs
Import customs clearance
This stage is heavily influenced by:
Trade regulations
Duty structures
Geopolitical relations
Port congestion
Documentation accuracy
Delays at customs can disrupt entire supply chains.
5. Warehousing and Distribution Centers
Once goods arrive in the destination region, they are stored in warehouses or distribution centers. These facilities perform:
Sorting and grading
Packaging or repackaging
Inventory management
Barcode/label printing
Quality checks
Modern warehouses use automated robots, RFID scanners, and data analytics for efficient operations.
Distribution centers are usually strategically located near major highways, ports, or airports to enable fast delivery to wholesalers, retailers, and online consumers.
Large companies like Amazon, Walmart, Flipkart, and Alibaba operate highly sophisticated fulfillment centers with AI-driven inventory systems.
6. Sales, Marketing, and Demand Management
This stage involves analyzing customer demand and planning inventory accordingly. Companies use:
Forecasting models
Market research
Data analytics
ERP systems
Accurate demand forecasting helps avoid:
Overstocking (causes high storage cost)
Stockouts (lost sales)
Production inefficiencies
Retailers and global brands rely on digital tools to align supply with changing consumer preferences.
7. Retail and Last-Mile Delivery
Finished goods are finally delivered to retailers, wholesalers, e-commerce warehouses, or directly to consumers. This involves:
Retail distribution networks
Online marketplaces
Courier services
Local transportation
Last-mile delivery is often the most expensive and time-consuming part of the supply chain, especially in urban areas with traffic congestion or rural areas with poor infrastructure.
E-commerce companies solve this through:
Micro-fulfillment centers
Hyperlocal delivery partners
AI route optimization
Cash-on-delivery logistics
8. After-Sales Services and Returns
The supply chain doesn’t end with delivery. After-sales activities include:
Warranty repairs
Return management
Replacement of defective products
Customer support
The reverse movement of goods—known as reverse logistics—is crucial for electronics, fashion, and e-commerce. Returned products may be:
Refurbished
Recycled
Resold
Disposed of responsibly
Efficient reverse logistics reduces waste and enhances customer satisfaction.
9. Recycling and Circular Supply Chains
As sustainability becomes a global priority, many companies now close the loop by recycling products. Examples:
Plastics → Recycled granules
Electronics → Recovered metals
Paper → Recycled pulp
Batteries → Reused chemicals
Circular supply chains reduce environmental impact and dependence on raw materials. Governments in Europe, the U.S., and Asia also push for extended producer responsibility (EPR) policies.
10. Digital Technologies Connecting the Supply Chain
Modern global supply chains increasingly rely on digital solutions for transparency and efficiency. Key technologies include:
Blockchain → Secure tracking of shipments
IoT sensors → Real-time temperature and location monitoring
AI & Machine Learning → Demand forecasting, route optimization
Robotics & Automation → Smart warehouses
Cloud platforms → Integrated supply chain management
Big data analytics → Reducing waste and cost
These technologies allow companies to respond faster to disruptions.
11. Risks and Disruptions in the Global Supply Chain
Global supply chains face many risks:
Geopolitical tensions (trade wars, sanctions)
Natural disasters (floods, earthquakes, pandemics)
Port congestions
Labor strikes
Currency fluctuations
Inflation in shipping costs
Regulatory changes
Events like COVID-19, the Suez Canal blockage, and U.S.–China tensions showed how vulnerable global trade systems can be. Companies now diversify suppliers and build resilient, multi-country networks.
Conclusion
The global supply chain sequence is a complex network involving raw materials, manufacturing, global transportation, warehousing, distribution, retail, and reverse logistics. Supported by modern technologies, each stage plays a vital role in ensuring products move efficiently from one part of the world to another. As globalization advances and digital transformation accelerates, supply chains are becoming smarter, faster, and more interconnected than ever before—yet they remain sensitive to global risks and require continuous adaptation.

Global Trade Costs, Inflation, and Interest Rates1. Global Trade Costs: What They Are and Why They Matter
Global trade costs refer to all expenses involved in moving goods or services from one country to another. These costs end up affecting product prices, competitiveness, and economic growth.
A. Components of Trade Costs
Transportation Costs
Shipping, aviation, trucking, rail freight
Fuel prices
Port handling and container charges
Insurance on cargo
When fuel prices rise or there is a shortage of containers (like after COVID-19), transportation costs shoot up sharply.
Tariffs
Governments impose taxes on imported goods. Tariffs can protect domestic industries but increase prices for consumers.
Non-Tariff Barriers (NTBs)
These include:
Quality standards
Product certifications
Customs procedures
Import quotas
Environmental and safety regulations
NTBs often add delays and compliance costs.
Exchange Rate Fluctuations
If a country’s currency weakens, its imports become more expensive; if it strengthens, imports become cheaper.
Political and Geopolitical Risks
War, sanctions, tensions between countries
Trade agreements collapsing
Piracy risks on shipping routes
These uncertainties raise risk premiums and insurance costs.
Logistical Efficiency
Countries with strong ports, roads, and customs technology have far lower trade costs.
B. Impact of High Trade Costs
Higher export and import prices
Reduced competitiveness in global markets
Lower consumer choices
Slowdown in global supply chains
Inflationary pressure, especially in import-dependent countries
Thus, trade cost is not just an economic number—it is a powerful driver behind global price movements.
2. Inflation: The Price Level That Affects Everyone
Inflation is the rate at which the general price level of goods and services rises over time. When inflation increases, money loses value, and purchasing power declines.
A. Major Causes of Inflation
Demand-Pull Inflation
When demand is higher than supply (e.g., festival season, economic boom), prices rise.
Cost-Push Inflation
When the cost of production increases—due to higher raw material prices, trade costs, or wages—producers raise prices.
Imported Inflation
Many countries depend on imports for food, energy, metals, or electronics.
If global trade costs increase or the currency weakens, import prices rise and inflation increases.
Supply Chain Disruptions
Events such as pandemics, geopolitical conflicts, and natural disasters break supply chains and reduce availability, leading to higher prices.
Monetary Factors
When central banks print too much money or keep interest rates too low, prices tend to rise.
B. Effects of Inflation
Reduced purchasing power
Higher cost of living
Lower savings value
Increased business uncertainty
Wage-price spiral
Pressure on governments and central banks to intervene
Moderate inflation is normal, but high inflation or hyperinflation can destabilize entire economies.
3. Interest Rates: The Financial Lever Controlling Inflation
Interest rates are the cost of borrowing money. Central banks (like the Federal Reserve, ECB, RBI, etc.) adjust interest rates to stabilize economic growth and inflation.
A. How Interest Rates Work
When interest rates rise:
Loans become expensive
Businesses reduce investments
Consumers cut spending
Savings become attractive
Economy slows
Inflation typically falls
When interest rates fall:
Borrowing becomes cheaper
Investment and consumption rise
Economy grows
If demand grows too fast, inflation increases
Interest rates are the primary tool used by central banks to fight inflation.
4. How Global Trade Costs, Inflation, and Interest Rates Interact
These three forces are deeply interconnected, and one change triggers reactions in the others.
A. High Trade Costs → Higher Inflation
When trade costs rise due to fuel surges, war disruptions, or container shortages:
Transportation becomes expensive
Imports cost more
Raw materials become pricier
Companies pass these costs to consumers
This leads to cost-push inflation, especially in developing countries dependent on imported commodities.
Examples:
Oil price increases raise transportation costs globally.
War in major shipping routes slow down container movement and raise freight rates.
B. Inflation → Higher Interest Rates
When inflation rises above a country’s target (usually 2–6%), central banks increase interest rates to cool the economy.
This is called monetary tightening.
Why?
Higher interest rates reduce demand in the economy and slow down price growth.
C. Higher Interest Rates → Higher Trade Costs
When interest rates rise globally:
The cost of financing ships, warehouses, and inventory increases
Multinational companies borrow less
Currency values fluctuate
Emerging markets face capital outflows
Trade slows, increasing per-unit shipping costs
Thus, interest rate hikes indirectly increase global trade costs.
D. Higher Interest Rates → Stronger Domestic Currency
This reduces imported inflation because foreign goods become cheaper.
But if a strong currency hurts export competitiveness, trade volumes may decline.
5. The Global Cycle: How One Factor Creates a Chain Reaction
A typical cycle looks like this:
Trade costs rise due to global disruptions.
This causes imported inflation.
Central banks respond by raising interest rates.
Higher interest rates:
slow down demand
reduce inflation
increase borrowing cost
Businesses cut production or trade volumes, which eventually lowers global trade costs again.
This balancing cycle is what keeps global markets stable over time.
6. Why These Factors Matter More Today
Global markets face many new challenges:
Fragmenting supply chains (“China+1” diversification)
Geopolitical tensions
Climate-related disruptions
Volatile energy prices
Uncertain global monetary policies
All these factors make the interaction between trade costs, inflation, and interest rates more unpredictable. Investors, traders, and policymakers must track them closely to anticipate market movements.
Conclusion
Global trade costs, inflation, and interest rates form a powerful economic triangle that influences every country, company, and consumer in the world. Trade costs shape prices, inflation determines purchasing power, and interest rates regulate economic stability. Their interaction drives global growth cycles, financial markets, and corporate strategies. Understanding this dynamic helps traders, economists, and students decode global market behavior in a clear, structured manner.


> Strong Bullish Candle after Doji but..12-12-2025
Closed at 169864.53
> Strong Candle after Doji.
> Resistance 170000 - 172000
> HL around 168000
> Bearish Divergence

Trade With Real Estate Globally1. What Is Global Real Estate Trading?
Global real estate trading means buying, selling, leasing, or investing in property across international borders. This includes:
Direct property purchases (homes, villas, commercial buildings, land).
Indirect investments such as Real Estate Investment Trusts (REITs).
Development partnerships with foreign builders.
Short-term rentals (Airbnb-style international properties).
Institutional investments where large funds buy foreign property portfolios.
The goal is to generate returns through:
Capital appreciation
Rental income
Diversification
Currency gains
Access to emerging market opportunities
2. Why Investors Trade Real Estate Globally
a. Higher Returns in Foreign Markets
Real estate returns vary widely from country to country. For example:
Dubai and UAE offer high rental yields (6%–10%).
European capitals give stable appreciation over time.
The U.S. offers powerful mortgage systems with low interest.
Investors chase these global advantages.
b. Diversification Against Domestic Risk
If one country faces inflation, recession, or political issues, the investor’s global property helps balance the risk. For example, an Indian investor with U.S. REITs is less affected by Indian market fluctuations.
c. Stronger Currency Gains
Buying property in a stronger currency like USD, AED, EUR, or GBP can increase overall wealth. When the home currency depreciates, global property appreciates in value.
d. Investment Visas & Residency Benefits
Many countries offer residency or citizenship on property purchase:
Portugal Golden Visa
Greece Residency by Investment
UAE 10-year Golden Visa
Turkey Citizenship by Property
This makes global real estate even more attractive.
e. Digitalization & Transparency
Earlier global real estate trading involved huge paperwork and physical visits. Today:
Virtual property tours
Online documentation
International real estate platforms
Global developers
have made the process fast and transparent.
3. Types of Global Real Estate Investments
a. Residential Properties
These include apartments, villas, condos, holiday homes, etc. Investors prefer:
Dubai
London
Singapore
New York
Australia
because of high demand and liquidity.
b. Commercial Properties
These include office buildings, retail shops, warehouses, and logistics centers. Commercial investment is popular because it offers:
Higher rental yield
Long-term leases (5–10 years)
Corporate tenants
Markets like the UAE, USA, Germany, and Netherlands are top choices.
c. Industrial Real Estate
Warehouses, fulfillment centers, manufacturing parks are booming due to:
E-commerce expansion
Supply chain globalisation
Countries like China, India, Vietnam, and Mexico attract global industrial investors.
d. Hospitality Real Estate
Hotels, resorts, service apartments—these gain from tourism growth. Investors choose places like:
Maldives
Thailand
Bali
Dubai
for hospitality trading.
e. REITs (Real Estate Investment Trusts)
REITs allow investors to buy shares of global property portfolios without owning physical buildings. They offer:
Low investment entry
High liquidity
Professional management
Examples: U.S. REITs, Singapore REITs, Dubai REITs, Indian REITs.
4. Key Drivers of Global Real Estate Trade
a. Economic Growth
Countries with fast-growing GDP naturally attract property investors. More jobs = more housing and commercial demand.
b. Urbanization
Cities expanding create strong real estate opportunities in:
Infrastructure
Residential
Transportation-linked developments
c. Foreign Direct Investment (FDI) Policies
Countries encouraging foreign investment—like UAE, Singapore, Portugal—get massive global capital in their property markets.
d. Tax Benefits
Countries offer:
Lower property tax
Zero capital gains tax
Tax-free rental income
This motivates global investors.
e. Currency Strength
Properties in strong-currency countries are seen as wealth preservers. Investors diversify to protect against local currency inflation.
5. Risks in Global Real Estate Trading
Like any investment, global property trading also has risks:
a. Currency Risk
If the foreign currency weakens, property returns fall when converted back.
b. Legal and Regulatory Challenges
Different countries have:
Different ownership laws
Restrictions on foreigners
Complex registration rules
Investors must understand these rules before buying.
c. Political and Economic Uncertainty
War, elections, sanctions, recession—these can affect property values.
d. Market Liquidity
Some markets don’t have fast buyers. Selling global property may take time.
e. Management Issues
If buying a property abroad, maintenance and tenant management can be challenging. Most investors hire property managers.
f. Taxation Complexity
Owning property abroad may mean paying taxes in both the foreign country and the home country.
6. How Global Real Estate Trading Works
Step 1: Market Research
Investors research:
GDP trends
Political stability
Rental yields
Transaction costs
Legal regulations
Step 2: Property Selection
They choose:
Residential, commercial, or industrial
Developed or emerging market
High-growth or high-yield area
Step 3: Legal & Documentation
Involves:
KYC
Property agreements
Notary procedures
Taxes
Some countries require local lawyers or brokers.
Step 4: Financing
Options:
Self-funded purchase
International mortgages
Developer financing
Step 5: Rental Management
To earn steady income, investors hire:
Property managers
Rental agents
Facility teams
Step 6: Exit Strategy
Investors must plan when to:
Sell the property
Reinvest in another market
Convert currency profits
7. Best Countries for Global Real Estate Trade in 2025
High-Yield Markets
Dubai (UAE)
Indonesia
Vietnam
Turkey
Stable and Safe Markets
USA
Canada
UK
Germany
Australia
Emerging Opportunity Markets
India
Philippines
Mexico
Saudi Arabia
8. Future of Global Real Estate Trading
Global property trading will grow rapidly due to:
Digital platforms
Blockchain-based property titles
Tokenization (fractional property ownership)
International mobility
Increased foreign investments
Investors will increasingly diversify across countries rather than depending on just one local market.
Conclusion
Global real estate trading has become a powerful way to build wealth, diversify risk, and take advantage of global economic growth. It offers opportunities in residential, commercial, industrial, and hospitality segments, supported by rising urbanization, open investment policies, and financial globalization. While it brings risks like legal challenges, currency fluctuations, and management issues, the rewards—high returns, global diversification, and strong-currency appreciation—make it a preferred choice for smart investors.

Risk in the International Market1. Currency Exchange Rate Risk
One of the biggest risks in global markets is foreign exchange risk. When two countries conduct trade or an investor buys foreign assets, the value of the investment depends on exchange rates.
For example:
If an Indian company exports goods to Europe and the Euro weakens against the Rupee, the exporter may receive less money.
If an investor buys US stocks and the USD depreciates, the value of their investment falls in their home currency.
Exchange rate movements are driven by global demand and supply, interest rates, central bank policies, inflation, and geopolitical news. Even small fluctuations can cause huge changes in profitability.
2. Global Economic Risk
Economic health differs across countries. Some are growing rapidly, while others may be in recession. International markets are deeply connected, so a slowdown in one major economy can affect the entire world.
Examples:
A recession in the US often impacts global demand, stock markets, and commodity prices.
Slowdown in China reduces global industrial metal demand, affecting exporters like Australia, Brazil, and Africa.
Global economic risk includes:
Inflation spikes
Interest rate hikes
Unemployment rises
Lower GDP growth
Shifts in global trade patterns
International investors must monitor economic indicators across multiple countries to assess risk properly.
3. Geopolitical and War Risk
Geopolitical tensions, wars, territorial disputes, sanctions, and diplomatic conflicts cause high volatility in international markets. These events can disrupt trade routes, supply chains, and commodity prices.
Recent examples include:
Russia–Ukraine war impacting oil, gas, wheat, and nickel prices.
US–China trade war affecting global technology and semiconductor supply.
Middle East tensions pushing crude oil prices higher.
Even a single geopolitical headline can trigger sharp market movements. Investors closely track global political developments to manage this risk.
4. Regulatory and Compliance Risk
Each country has its own laws, financial regulations, tax structures, environmental rules, and trade policies. Companies operating internationally must comply with multiple legal frameworks, and sudden regulatory changes can bring financial losses.
Examples:
A country increasing import duty on electronics can hurt global manufacturers.
Sudden changes in foreign investment rules can impact multinational projects.
New data protection laws can affect IT and cloud-based businesses.
Regulatory risk requires businesses to stay updated with international laws and maintain strong compliance teams.
5. Interest Rate and Monetary Policy Risk
Central banks around the world, such as the US Federal Reserve, European Central Bank, RBI, or Bank of Japan, control interest rates and monetary policy. Their decisions directly impact global markets.
When interest rates rise:
Borrowing becomes expensive
Foreign investors move money to safer, higher-yield economies
Stocks and commodities may fall
When interest rates fall:
Markets often rally
Borrowing increases
Economic growth improves
International traders must monitor global central bank announcements because they influence currencies, bonds, equities, and commodities across the world.
6. Political Risk
Apart from wars or conflicts, routine political activities also influence global markets. These include:
Elections
Government instability
Policy changes
Nationalization of industries
Corruption or administrative inefficiency
Political uncertainty discourages foreign investment. A country with stable governance attracts more international capital, while a politically unstable regime increases risk.
7. Commodity Price Volatility Risk
Many countries rely heavily on global commodities such as crude oil, natural gas, gold, wheat, corn, copper, and more. Price fluctuations in these commodities affect economies, companies, and international trade.
For instance:
Rising oil prices hurt oil-importing countries like India.
Falling metal prices hurt metal exporters like Chile or Brazil.
Weather events (like El Niño) affect global food supply and prices.
Commodity risk is heavily influenced by global supply-demand trends, weather patterns, geopolitical events, and currency fluctuations.
8. Supply Chain and Logistics Risk
International trade depends on complex supply chains involving ports, ships, trucks, customs, warehouses, and multiple stakeholders. Any disruption can create massive financial losses.
Key supply chain risks include:
Pandemic-related lockdowns
Port congestion
Freight rate spikes
Strikes or labour shortages
Natural disasters
Cyberattacks on logistics systems
The COVID-19 pandemic highlighted the vulnerability of global supply chains, causing worldwide shortages of chips, medicines, and essential goods.
9. Technological and Cybersecurity Risk
The digital nature of global markets increases cybersecurity threats. Hackers, cyber-criminals, and state-sponsored attacks can disrupt banking systems, trading platforms, and corporate networks.
Risks include:
Data theft
Ransomware attacks
Online fraud
Trading system failures
Intellectual property theft
Companies trading globally must invest heavily in cybersecurity to protect sensitive data and maintain investor trust.
10. Cultural and Operational Risk
Operating in different countries means dealing with different cultures, languages, work ethics, and consumer behaviour. Misunderstanding local customs or market expectations can cause financial setbacks.
Examples:
Marketing strategies that work in the US may not work in Japan.
A product popular in Europe may not suit Indian tastes.
Local negotiation styles may differ widely from global norms.
Companies must adapt to local cultures through proper research, staffing, and training.
11. Credit and Payment Risk
When trading internationally, companies face credit risk because foreign buyers may delay payments, default, or go bankrupt. Cross-border legal recovery is often difficult and time-consuming.
This risk is managed through:
Letters of credit
Bank guarantees
Trade insurance
Advance payment agreements
But even with these measures, international transactions remain riskier than domestic ones.
12. Environmental and Climate Risk
Climate change and environmental laws increasingly affect international trade. Natural disasters disrupt transportation, production, and supply chains.
Examples:
Floods damaging manufacturing hubs
Heatwaves reducing agricultural output
Cyclones halting port operations
Environmental regulations also force companies to upgrade technology or pay penalties, adding to operational costs.
Conclusion
The international market offers enormous opportunities but also exposes participants to a wide range of risks—including currency fluctuations, geopolitical tensions, economic shocks, regulatory changes, and supply chain disruptions. Successful global investors or businesses must constantly monitor global trends, diversify exposures, use hedging tools, and maintain strong compliance and risk-management systems. Mastering these risks is essential to sustaining growth and profitability in a highly interconnected world.

Stable coin dominance leaving accumulation range. Crypto doomed?Stable coin dominance appears to be towards the end of an accumulation range. This could prove to be a signal that CRYPTOCAP:BTC CRYPTOCAP:ETH and other cryptocurrencies are about to fall even more.
Alternatively, there's a scenario where we could say this is a re-distribution area. I'll post that one below.
So what to expect? Well... if we follow the PA as projected on this chart above, it's bearish for crypto. If we follow PA that resembles the prediction on the chart below, then it would be bullish for crypto.
Best thing would be to wait on the sideline to wait for some confirmation.
