CHF-JPY Will Keep Growing! Buy!
Hello,Traders!
CHFJPY retraced into a horizontal demand area after a clear bullish leg. SMC structure suggests continuation toward the supply area as liquidity above equal highs gets targeted. Time Frame 4H.
Buy!
Comment and subscribe to help us grow!
Check out other forecasts below too!
Disclosure: I am part of Trade Nation's Influencer program and receive a monthly fee for using their TradingView charts in my analysis.
Contains image

ZKML – Downside Pressure Builds📉 The triple top near $0.30 marked a firm ceiling for the year, and since then, price has drifted sideways to lower.
🔻 As long as any upcoming bounce stays corrective below the October peak at $0.20, the structure favors another leg down.

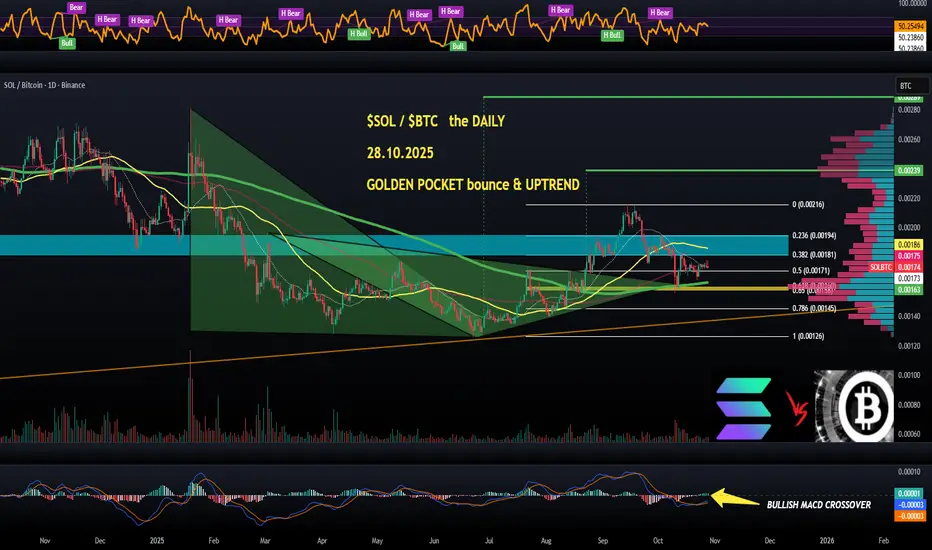
$SOL/$BTC (DAILY): GOLDEN POCKET bound and UPTRENDCRYPTOCAP:SOL vs CRYPTOCAP:BTC looks ripe on the WEEKLY, so let's zoom in on the DAILY for a better idea.
First of all, the 200 MA, the green upcurving KEY moving average, has held as additional support level in confluence with the GOLDEN POCKET.
We saw a good bounce and now it looks ready for some WAVE 3 explosive action, as soon as the imnediate resistance is overcome.
BULLISH MACD crossover, this chart should become super bullish once above the yellow 50 MA, my main short-term momentum boundary of sorts.
Beyond the TA, I also expect a usual SELL-THE-NEWS added selling pressure after the SOLANA #etf has gone live today.
Regardless, if the charts signal BULLISHNESS, I will take my LONG set-up above $206 (hopefully not before the FOMC, I would rather avoid new positions in the lead-up to FED'S decision tommorow.
👽💙
USDCAD FREE SIGNAL|LONG|
✅USDCAD after tapping into the refined 4H demand level, price shows a bullish rejection candle, suggesting a potential long setup targeting the next short-term high. Smart money likely accumulating below liquidity pools.
—————————
Entry: 1.3944
Stop Loss: 1.3931
Take Profit: 1.3958
Time Frame: 4H
Setup Risk: High
—————————
LONG🚀
✅Like and subscribe to never miss a new idea!✅

XAU/USD Completing Wave Y: Final Dip Before RallyGold has completed its major 5-wave rise and is now finishing a corrective W-X-Y pattern. The recent drop looks like the final leg of this correction, meaning sellers are getting weaker. Price may show a small bounce up and then one last dip to complete the correction. After that final drop, a strong new uptrend is expected to start again. In short: correction ending soon, last dip big bullish move ahead.
Stay tuned!
@Money_Dictators
Thank you :)

EUR-USD Clear Rejection! Buy!
Hello, Traders!
EURUSD After a deep rejection from the horizontal demand area, price shows bullish intent with a clean break of short-term structure. Expect continuation toward the target zone. Time Frame 4H.
Buy!
Comment and subscribe to help us grow!
Check out other forecasts below too!
Disclosure: I am part of Trade Nation's Influencer program and receive a monthly fee for using their TradingView charts in my analysis.

Making the swap worked. Even with the quite market When trading tired I can mistakes, choosing the wrong forecast 2 days ago was a result of that
Thankfully as time passes Option B proves to be correct which means the AI models are still calling the future of price action before it happens!

Breaking: Paypal ($PYPL) Gearing for A 500% Breakout PayPal Holdings, Inc. (NASDAQ: NASDAQ:PYPL ) a fintech company is set for a 500% breakout amidst bouncing off of support point setting sail for $300 zone.
As of the time of writing, the stock is up 8% with the RSI at 49, there is more room to capitalize on the low buying pressure.
In recent news, the company is integrating its wallet into OpenAI’s ChatGPT.
Beyond that headline-grabbing news, PayPal’s third-quarter earnings results, released before the market opened, revealed some puts and takes. Several key metrics, such as overall account growth, remained in single-digit territory, with some areas of acceleration in other parts of the business.
About PYPL
PayPal Holdings, Inc. operates a technology platform that enables digital payments for merchants and consumers worldwide. It operates a two-sided network at scale that connects merchants and consumers that enables its customers to connect, transact, and send and receive payments through online and in person, as well as transfer and withdraw funds using various funding sources, such as bank accounts, PayPal or Venmo account balance, consumer credit products, credit and debit cards, and cryptocurrencies.

$SOL/$BTC (WEEKLY): BULLISHNESS brewing, MONEY WAVE next?CRYPTOCAP:SOL or CRYPTOCAP:BTC in the upcoming weeks and months, mid-term thesis. Last checks before I pull the trigger on SOLANA long (above $206, as per my previous posts).
So the WEEKLY chart first, these alt vs btc are my reliable, additional foundations in high-probability trading set-ups.
Important to note that SOLANA corrected for 15 months between MARCH 24 and JUNE this year, and since late JUNE we saw a big reversal (DOUBLE BOTTOM) followed by a local top last month. HIGHER HIGH after EQUAL LOWS, bullish.
Last 5-6 weeks, Solana has been correcting, hit a common retracement level called the GOLDEN POCKET, which suggests that the correction could be marked as WAVE 2.
In this case, WAVE 3, my favourite MONEY WAVE, up next. HIDDEN BULLISH divergence flashing makes this much more likely as well.
The light-blue box overhead is resistance, once above, I think SOL will absolutely rip up.
Need a look into smaller timeframes, but this WEEKLY is showing some serious BULLISHNESS brewing.
👽💙

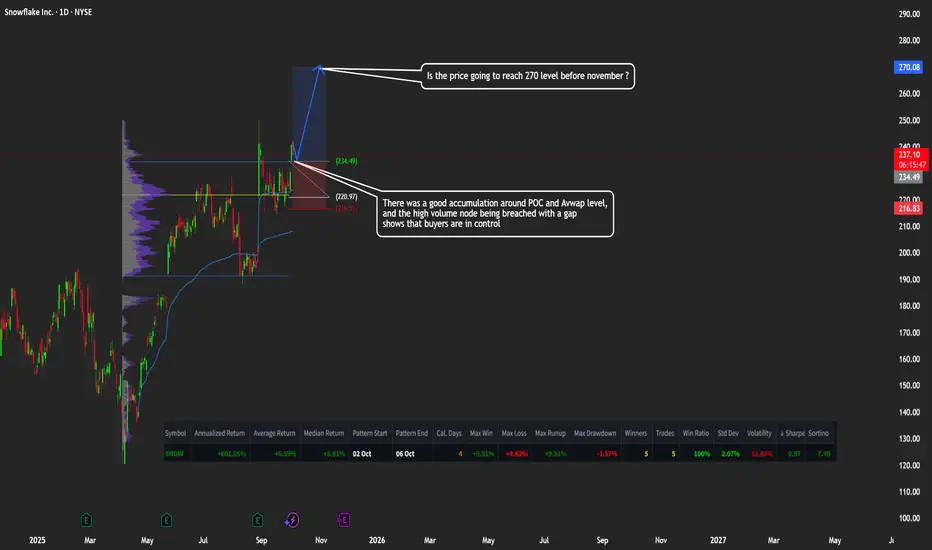
SNOW: Snowflake Headed to $270?🚀 Snowflake Ready for Takeoff? $270 Before November?
Caption:
SNOW has shown strong accumulation around the POC and VWAP levels, with buyers taking control after breaking through the high-volume node with a gap. 📈
Momentum could push the price toward $270 in the coming weeks.
👉 What do you think — is $270 realistic, or will we see a pullback first?
Litecoin is primed for a massive price explosionI’m thinking we’ll see a big pump on Litecoin. I love this multi-year accumulation pattern. A lot of people don’t realize how held back this coin has been—when it starts pumping, it will be insane.
As always, stay profitable.
- Dalin Anderson

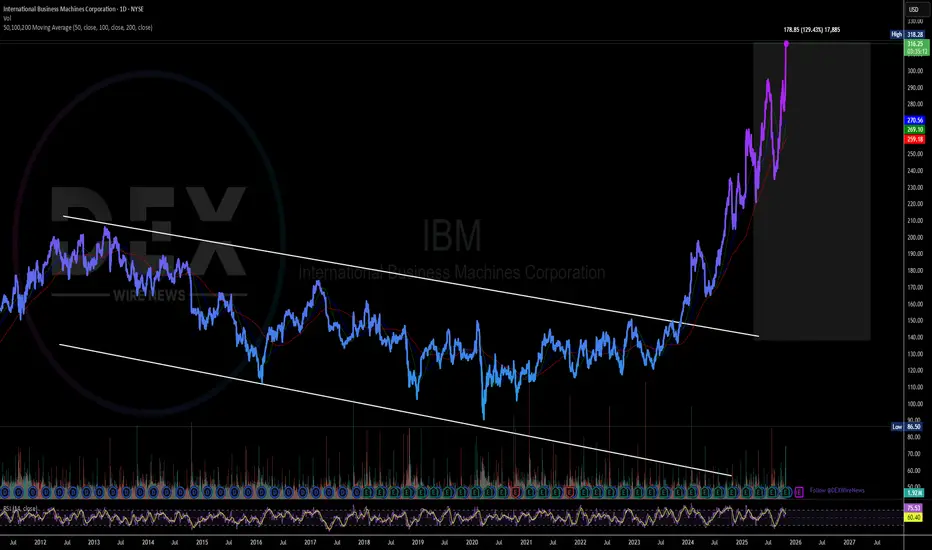
International Business Machines (IBM) Gearing for Breakout Ever since breaking out of a falling wedge on November 2023, International Business Machines (IBM) spike 130% breaking highs after highs.
In recent news, IBM plans to launch a platform that will enable financial institutions, governments and corporations to manage digital assets across various blockchains while meeting their compliance obligations.
The IBM Digital Asset Haven is being developed in collaboration with Dfns, a digital wallet infrastructure provider that has created 15 million wallets for 250 clients, the companies said in a Monday (Oct. 27) press release.
About IBM
International Business Machines Corporation, together with its subsidiaries, provides integrated solutions and services in the Americas, Europe, the Middle East, Africa, and the Asia Pacific. It operates through Software, Consulting, Infrastructure, and Financing segments. The Software segment offers hybrid cloud and AI platforms that allows clients to realize their digital and AI transformations across the applications, data, and environments in which they operate.
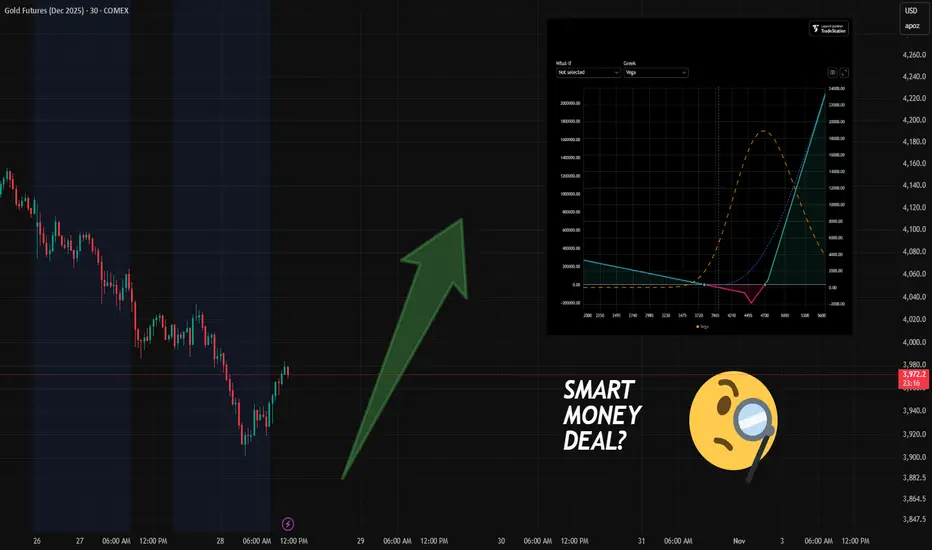
Quiet in FX Options — But Gold Is Heating Up
Over the past 24 hours, major currency options saw little of interest.
In contrast, precious metals — especially Gold — are attracting serious attention.
Let’s break down the key developments:
🔹 Observation #1: A New Bullish (But Hedged) Portfolio Appears
(See risk profile on screenshot.)
A new SMART option portfolio has entered the market:
Bullish bias, but with a built-in hedge — which reduces its predictive value.
If price drops below $3,800, the portfolio starts generating profit for its owner (via the hedge).
Built on the February 2025 futures contract, under an option series expiring in December 2025.
📌 Yes, it sounds confusing — and it is.
Option series expire, but futures live on.
This creates what we call "expiry risk" — a topic for another deep-dive article.
🔹 Observation #2: Put Activity at 3900 (Dec Series)
There’s growing activity in puts at the 3900 strike — moderate bullish positioning or support.
The bullish structure is hedged — not a pure directional bet.
Bearish positioning remains active.
Price has not yet shown signs of moving toward the main long setup.
I’d recommend at least 2–7 days of observation before considering any reversal trades.
📌 And here's why:
It’s rare for price to move immediately toward the target of a large, long-dated portfolio.
More often, there’s a delay of several days — especially when expiry is still far out.
Watch the flow.
Trade only when the edge is clear.
May the data-driven approach be with you!
PYPL cleared gap at $77, creater gap at $71Pypl has closed the gap at $77 but now created a gap at $71. Expect more volatility and a high probability of gap fill.

Mind the gapsNASDAQ:BYND is in the middle of a possible Gamma squeeze. There are chart gaps both above and below current price. Earnings is coming on November 4, look for a major catalyst in either direction. Expect high volatility going forward.

ONDS: Will the momentum continue or will there be profit taking?Technical Analysis
Price Level: Currently at $5.86, up +2.81% on the day.
Trend: Strong bullish momentum since mid-July, with almost parabolic growth.
Measured Move: The annotation notes that the measured move has completed, but the tone ("Higher!") suggests continuation potential.
Supply/Demand Zones:
Discount Zone (Accumulation): Around $1.20 – $2.00.
Equilibrium Zone: Around $3.40 – $4.00 (important support if a pullback occurs).
Premium Zone: Above $7.00 – $8.50, which might act as resistance.
Volume
Noticeable spikes in volume during breakout stages, confirming institutional or speculative participation.
Recent candles show sustained buying pressure with minimal retracement.
Macro View
Stock rallied from sub-$2 levels earlier in the year.
Measured target achieved, but momentum and volume suggest speculative continuation until exhaustion.
Next resistance is in the $7.50–$8.50 premium zone.
Probabilistic Outlook
Bullish case (65%): Continuation towards $7.5–$8.5 zone before exhaustion.
Neutral case (20%): Sideways consolidation in the $5–$6 range.
Bearish case (15%): Pullback to $4.00 support, which is strong previous resistance.

Breaking: TEN Holdings, Inc. (NASDAQ:XHLD) Spike Over 100% TodayThe price of TEN Holdings, Inc. (NASDAQ NASDAQ:XHLD ) broke out of a falling wedge spiking over 100% today during Tuesday early market session.
With buying momentum increasing as seen by the RSI at 88, NASDAQ:XHLD might reclaim the $2 resistance in the short to long term.
In another news, TEN Holdings, Inc. (NASDAQ NASDAQ:XHLD ) recently announces a strategic agreement with V-Cube, Inc., its controlling stockholder and a leader in the global virtual events industry in Japan and Singapore.
TEN Holdings and V-Cube are unifying their respective technologies and expertise to deliver advanced communication and event technology tailored for the North American enterprise market, valued at USD 34.39 billion in 2024 (Grand View Research).
About XHLD
TEN Holdings, Inc. provides event planning, production, and broadcasting services in the United States. The company organize virtual, hybrid, and physical events, including conferences, marketing events, product launches, trainings, and investors and shareholder meetings. Its events are enabled by its Xyvid Pro Platform, an internet-based broadcast platform with interactive engagement tools designed to provide web broadcast audiences with a dynamic, interactive, and engaging virtual event experience.

Will Nucor Start Moving?Steelmaker Nucor has done little for years, but some traders may think it’s ready to start moving again.
The first pattern on today’s chart is the basing pattern between $132 and $140. Prices have broken above that range this week and also crossed the 50-day simple moving average (SMA). That may suggest a period of consolidation has ended.
Second, longer-term moving averages have aligned in a potentially bullish way. The 50-day SMA had a “golden cross” above the 200-day SMA in August and the 100-day SMA rose above the 200-day SMA last month. (See white arrows.)
Third, the 8-day exponential moving average (EMA) just crossed above the 21-day EMA. MACD is also rising. Those signals may be consistent with shorter-term bullishness.
Finally, traders may eye the August peak of $151.32 as a potential trigger for a breakout.
TradeStation has, for decades, advanced the trading industry, providing access to stocks, options and futures. If you're born to trade, we could be for you. See our Overview for more.
Past performance, whether actual or indicated by historical tests of strategies, is no guarantee of future performance or success. There is a possibility that you may sustain a loss equal to or greater than your entire investment regardless of which asset class you trade (equities, options or futures); therefore, you should not invest or risk money that you cannot afford to lose. Online trading is not suitable for all investors. View the document titled Characteristics and Risks of Standardized Options at www.TradeStation.com . Before trading any asset class, customers must read the relevant risk disclosure statements on www.TradeStation.com . System access and trade placement and execution may be delayed or fail due to market volatility and volume, quote delays, system and software errors, Internet traffic, outages and other factors.
Securities and futures trading is offered to self-directed customers by TradeStation Securities, Inc., a broker-dealer registered with the Securities and Exchange Commission and a futures commission merchant licensed with the Commodity Futures Trading Commission). TradeStation Securities is a member of the Financial Industry Regulatory Authority, the National Futures Association, and a number of exchanges.
TradeStation Securities, Inc. and TradeStation Technologies, Inc. are each wholly owned subsidiaries of TradeStation Group, Inc., both operating, and providing products and services, under the TradeStation brand and trademark. When applying for, or purchasing, accounts, subscriptions, products and services, it is important that you know which company you will be dealing with. Visit www.TradeStation.com for further important information explaining what this means.

GOLD 4H CHART ROUTE MAP UPDATE & TRADING PLAN FOR THE WEEKHey Everyone,
Please see our updated 4h chart levels and targets for the coming week.
We are seeing price play between two weighted levels with a gap above at 4173 and a gap below at 4079. We will need to see ema5 cross and lock on either weighted level to determine the next range.
We will see levels tested side by side until one of the weighted levels break and lock to confirm direction for the next range.
We will keep the above in mind when taking buys from dips. Our updated levels and weighted levels will allow us to track the movement down and then catch bounces up.
We will continue to buy dips using our support levels taking 20 to 40 pips. As stated before each of our level structures give 20 to 40 pip bounces, which is enough for a nice entry and exit. If you back test the levels we shared every week for the past 24 months, you can see how effectively they were used to trade with or against short/mid term swings and trends.
The swing range give bigger bounces then our weighted levels that's the difference between weighted levels and swing ranges.
BULLISH TARGET
4173
EMA5 CROSS AND LOCK ABOVE 4173 WILL OPEN THE FOLLOWING BULLISH TARGETS
4264
EMA5 CROSS AND LOCK ABOVE 4264 WILL OPEN THE FOLLOWING BULLISH TARGET
4333
EMA5 CROSS AND LOCK ABOVE 4333 WILL OPEN THE FOLLOWING BULLISH TARGET
4333
EMA5 CROSS AND LOCK ABOVE 4333 WILL OPEN THE FOLLOWING BULLISH TARGET
4422
EMA5 CROSS AND LOCK ABOVE 4422 WILL OPEN THE FOLLOWING BULLISH TARGET
4494
BEARISH TARGETS
4079
EMA5 CROSS AND LOCK BELOW 4079 WILL OPEN THE SWING RANGE
3985
3873
EMA5 CROSS AND LOCK BELOW 3873 WILL OPEN THE SECONDARY SWING RANGE
3741
3632
As always, we will keep you all updated with regular updates throughout the week and how we manage the active ideas and setups. Thank you all for your likes, comments and follows, we really appreciate it!
Mr Gold
GoldViewFX

PERP$PERP has developed a well-defined descending wedge pattern, often signaling a bullish reversal. A breakout from this structure could yield a potential 650% gain from the current price if supported by strong volume and sustained market momentum.

TRUMP$TRUMP has rallied 500% from its bottom and still shows momentum for another potential 500% upside from current levels. Market sentiment remains strong as it represents the personal meme coin tied to the President of the United States, fueling speculative demand.

LQTY$LQTY is trading within a descending channel pattern, showing strong potential for a bullish reversal. A confirmed breakout from the upper trendline could lead to an estimated 400% upside from the current price, supported by improving momentum indicators.

$SOL (DAILY): HIGHER low in, now the $206 KEY TESTA lot of progress in CRYPTOCAP:SOL DAILY chart but still in a no-go zone as I stick to my rigid rules set out in my last analysis, published 8 days ago. What happened since?
GOLDEN POCKET no longer a resistance zone, has been flipped into hard support and potentially my STOP LOSS protective pillow.
HIGHER LOW has been established, now time for a BULLISH market structure change.
Fibanacci-wise, the 0.5 fib level at $206 is in confluence with a horizontal level of resistance, JULY and AUGUST hard rejection levels. I live off confluences of this kind.
Short-term momentum 50 MA (yellow at $212.9 atm) will be the key test of intent in case of a BREAKOUT above $206.
MACD bullish crossover, check.
Volumes are not satisfying, at all. This is a major confirmation for me, always, so it's simple really.
LONG the BREAKOUT above $206 if volumes confirm the move.
FOMC soon, so I would need one more reason to enter, BULLISHNESS against BITCOIN or CRYPTOCAP:ETH and next posts are going to be on that subject.
💙👽
