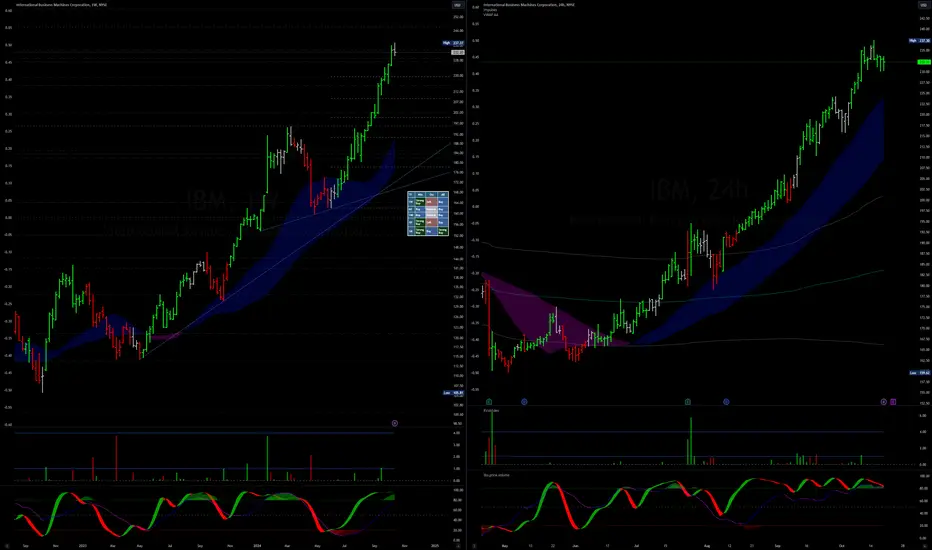
IBM International Business Machines Options Ahead of EarningsIf you haven`t bought IBM before the previous earnings:
Now analyzing the options chain and the chart patterns of IBM International Business Machines prior to the earnings report this week,
I would consider purchasing the 250usd strike price Calls with
an expiration date of 2025-3-21,
for a premiu
Key facts today
Next report date
—
Report period
—
EPS estimate
—
Revenue estimate
—
6.98USD
7.50 BUSD
61.86 BUSD
920.25 M
About International Business Machines Corporation
Sector
Industry
CEO
Arvind Krishna
Website
Headquarters
Armonk
Founded
1911
FIGI
BBG000BLNNH6
International Business Machines Corporation (IBM) is a technology company. The Company operates through five segments: Cognitive Solutions, Global Business Services (GBS), Technology Services & Cloud Platforms, Systems and Global Financing. The Cognitive Solutions segment delivers a spectrum of capabilities, from descriptive, predictive and prescriptive analytics to cognitive systems. Cognitive Solutions includes Watson, a cognitive computing platform that has the ability to interact in natural language, process big data, and learn from interactions with people and computers. The GBS segment provides clients with consulting, application management services and global process services. The Technology Services & Cloud Platforms segment provides information technology infrastructure services. The Systems segment provides clients with infrastructure technologies. The Global Financing segment includes client financing, commercial financing, and remanufacturing and remarketing.

IBM eyes on $230.71: Key support going into EarningsFollowup to my Long Call that got 40% plus (click).
Big Blue has been flying since our entry.
Currently tap dancing on a Genesis fib.
And reinforced by Covid Fib just below.
Earnings tonight will make next move.
If dumps, look for supports below to buy.
If pumps, I will calculate new targets abo

I'm using put options to trade its 3Q earningscopy and paste from Morgan Stanley:
IBM has been on a nearly unprecedented run in the last 3 months, outperforming the S&P 500 by 20 points since 2Q earnings. IBM is now trading at all-time valuation highs on an absolute and relative basis. This momentum has been driven by 3 prevailing bull the
IBM eyes on $163.30 then $158 for possible Bottoms of correctionIBM had the business office monopolized but then lost it.
PC's came and they said "it's a fad, we have TYPEwriters"
AI came and they said "we have Watson, he plays chess"
It has however been in an uptrend with the market.
Retrace is now testing a key support fib at $163.30
If that one fails, we hav

[IBM] Monthly ATH in SeptemberNYSE:IBM close the September trading month by making ATH. Last time it did this was in 2010 & the price kept went ahead for the next 12 months. Would it has the strength to repeat the same history ? let see.
Cherio...

IBM - another break of all time highs possible. IBM - stock broke all time highs last week now looking to retest or break those highs. Stock making a strong bounce of 9 EMA. looking to add calls above $223 for breaking of $225 and $230. Stock is strong on indicators.

IBM, will continue it's LEGACY OF GROWTH! IBM has recorded its 3 straight year of significant price growth since falling to 87.0 level on January 2020 - during the pandemic era. Since then, price has significantly recovered and fundamental growth has been as consistent as ever even in the pandemic years. Yearly Revenues has steadily increas

Is IBM's retreat from China a strategic gamble or a harbinger ofIBM's recent strategic decision to shutter its research and development center in China has sent ripples through the global tech industry. This move, coupled with the exodus of other American tech giants, has ignited a heated debate about the forces shaping the future of business in the world's seco

IBM sell: Wave 1 = Wave 5This is the best time to short IBM at a good risk-reward ratio. The SL is just above today's high. The TP is way below if you can hold.

IBM reaches all-time highs amid strategic shiftsIBM captured significant attention in August 2024, driven by pivotal developments that underscore the company’s strategic realignment and technological innovation. The decision to close its research and development centre in China, which will impact over 1,000 employees, is part of a broader global

See all ideas
An aggregate view of professional's ratings.
Displays a symbol's price movements over previous years to identify recurring trends.
IBM.GY
International Business Machines Corporation 7.125% 01-DEC-2096Yield to maturity
5.92%
Maturity date
Dec 1, 2096
I
IBM5744047
IBM International Capital Pte. Ltd. 5.3% 05-FEB-2054Yield to maturity
5.54%
Maturity date
Feb 5, 2054
I
IBM5744046
IBM International Group Capital LLC 5.25% 05-FEB-2044Yield to maturity
5.50%
Maturity date
Feb 5, 2044
IBM.LD
International Business Machines Corporation 5.6% 30-NOV-2039Yield to maturity
5.29%
Maturity date
Nov 30, 2039
Explore more bonds
Curated watchlists where IBM is featured.


Frequently Asked Questions
The current price of IBM is 214.67 USD — it has decreased by −1.70% in the past 24 hours. Watch International Business Machines Corporation stock price performance more closely on the chart.
Depending on the exchange, the stock ticker may vary. For instance, on NYSE exchange International Business Machines Corporation stocks are traded under the ticker IBM.
IBM stock has fallen by −7.44% compared to the previous week, the month change is a −2.94% fall, over the last year International Business Machines Corporation has showed a 50.96% increase.
We've gathered analysts' opinions on International Business Machines Corporation future price: according to them, IBM price has a max estimate of 260.00 USD and a min estimate of 150.00 USD. Watch IBM chart and read a more detailed International Business Machines Corporation stock forecast: see what analysts think of International Business Machines Corporation and suggest that you do with its stocks.
IBM stock is 1.99% volatile and has beta coefficient of 0.44. Track International Business Machines Corporation stock price on the chart and check out the list of the most volatile stocks — is International Business Machines Corporation there?
Today International Business Machines Corporation has the market capitalization of 197.74 B, it has decreased by −1.30% over the last week.
Yes, you can track International Business Machines Corporation financials in yearly and quarterly reports right on TradingView.
International Business Machines Corporation is going to release the next earnings report on Jan 28, 2025. Keep track of upcoming events with our Earnings Calendar.
IBM earnings for the last quarter are 2.30 USD per share, whereas the estimation was 2.22 USD resulting in a 3.38% surprise. The estimated earnings for the next quarter are 3.80 USD per share. See more details about International Business Machines Corporation earnings.
International Business Machines Corporation revenue for the last quarter amounts to 14.97 B USD, despite the estimated figure of 15.08 B USD. In the next quarter, revenue is expected to reach 17.67 B USD.
IBM net income for the last quarter is −330.00 M USD, while the quarter before that showed 1.83 B USD of net income which accounts for −117.99% change. Track more International Business Machines Corporation financial stats to get the full picture.
Yes, IBM dividends are paid quarterly. The last dividend per share was 1.67 USD. As of today, Dividend Yield (TTM)% is 3.10%. Tracking International Business Machines Corporation dividends might help you take more informed decisions.
International Business Machines Corporation dividend yield was 4.05% in 2023, and payout ratio reached 81.49%. The year before the numbers were 4.68% and 366.80% correspondingly. See high-dividend stocks and find more opportunities for your portfolio.
As of Oct 27, 2024, the company has 305.30 K employees. See our rating of the largest employees — is International Business Machines Corporation on this list?
EBITDA measures a company's operating performance, its growth signifies an improvement in the efficiency of a company. International Business Machines Corporation EBITDA is 14.72 B USD, and current EBITDA margin is 24.09%. See more stats in International Business Machines Corporation financial statements.
Like other stocks, IBM shares are traded on stock exchanges, e.g. Nasdaq, Nyse, Euronext, and the easiest way to buy them is through an online stock broker. To do this, you need to open an account and follow a broker's procedures, then start trading. You can trade International Business Machines Corporation stock right from TradingView charts — choose your broker and connect to your account.
Investing in stocks requires a comprehensive research: you should carefully study all the available data, e.g. company's financials, related news, and its technical analysis. So International Business Machines Corporation technincal analysis shows the sell today, and its 1 week rating is buy. Since market conditions are prone to changes, it's worth looking a bit further into the future — according to the 1 month rating International Business Machines Corporation stock shows the buy signal. See more of International Business Machines Corporation technicals for a more comprehensive analysis.
If you're still not sure, try looking for inspiration in our curated watchlists.
If you're still not sure, try looking for inspiration in our curated watchlists.