WHY Financial Markets Will Always ChangeChange is the only constant in the financial markets.
And that’s why it’s important to stay humble and grounded because everyday is a UNIQUE day to the markets and the pre market movers.
No matter how much experience you have, you can’t get too comfortable with the way things are.
Because we know they won’t stay that way for long.
The markets are like a living, breathing entity—constantly shifting, evolving, and transforming.
And now I want to explain why I believe the markets are ALWAYS changing.
REASON #1: The Fresh Faces of Trading
Continuous flow of new and old traders.
Every day, new traders enter the game while seasoned veterans continue to play.
This constant influx of fresh perspectives creates a dynamic market environment.
New traders bring innovative strategies, emotions, and decision-making processes into the market, while the veterans tweak their systems to keep up with ever-evolving trends.
And so the demand and supply is constantly shifting in new ways – which changes the markets style, moves and algorithms.
End of the day, the market is one big AUCTION as I have told my members for the last 15 years.
They’re influenced by the people who trade in them.
REASON #2: The Never-Ending Stream of New Information
New information – shining on the market
Here’s the thing: the financial markets thrive on information.
New data points, news reports, earnings releases, and economic indicators flow in non-stop, impacting prices and trends at every turn.
Sometimes there is good days with amazing news coming out.
Other days there is catastrophic news.
And then you get the mundane boring days with no reaction.
If a central bank announces an unexpected interest rate cut, or if a company releases disappointing earnings, the market is going to react swiftly.
Even geopolitical events and natural disasters play their part in shaping the direction of markets.
So no matter how much analysis you’ve done, be prepared for the fact that new info can change the game in an instant.
REASON #3: Micro, Macro, and Inner Fundamentals
New micro, macro and inner fundamentals
The fundamentals that underpin market movements are far from static.
On the micro level, individual companies are constantly evolving.
New product launches
Mergers and acquisitions
News and earning reports
Prospects
Leadership changes can all affect a stock’s price.
Zoom out a little, and you’ve got macro fundamentals.
These show the big-picture factors like:
Interest rates
inflation, and
unemployment rates,
All of which influence the broader economy.
REASON #4: Global Economies and World Events
World info from the economies
The financial markets are more interconnected than ever.
What happens in one part of the world now ripples through the rest of the global economy in minutes, not weeks.
A change in China’s trade policy can directly impact European markets.
An unexpected election result in America could influence the South African or UK equities.
REASON #5: The Endless Actions of Traders
Constant actions of traders around the world
Then, of course, we have the daily actions of traders around the world.
Every time a buy or sell order is placed, the market shifts.
I like to think of it as the Stock Market’s Butterfly-Effect.
These actions are a direct result of human behavior—our emotions, analysis, strategies, and even fear and greed.
When traders believe in a trend, they pile on, creating momentum.
But when panic strikes, markets can spiral down in a blink of an eye.
Since traders are constantly reacting to new information, the market flows like an ever-shifting river.
Conclusion
The financial markets are in a constant state of flux.
They will forever change and we need to learn how to evolve, adapt or die trying.
But there is one thing that is inevitable.
The markets will KEEP moving and trending. And for that, we will always be profiting in the medium to long term.
Let’s sum up why the markets will always change…
REASON #1: The Fresh Faces of Trading
Continuous flow of new and old traders.
REASON #2: The Never-Ending Stream of New Information
New information – shining on the market
REASON #3: Micro, Macro, and Inner Fundamentals
New micro, macro and inner fundamentals
REASON #4: Global Economies and World Events
World info from the economies
REASON #5: The Endless Actions of Traders
Constant actions of traders around the world
Contains image

POWERFUL Quote about TradingHere is a quote I want you to write down and hold close to your heart.
Trading is a Game of Focus, Sheer Will, and Unstoppable Determination
Trading is not for the faint-hearted.
It’s a game of focus, sheer will, and the kind of determination that doesn’t back down when the market throws punches.
If you’ve been in the trading world long enough, you know it’s not about making a quick buck.
It’s about holding your ground when the waves get rough and staying in the game even when the winds are blowing against you.
Let’s break this down…
Focus Is Your Superpower
To succeed, you need to zero in on your strategy and trust the process, no matter how loud the noise around you gets.
Focus is what separates a good trader from a great one.
It’s about staying laser-focused on your plan.
Do not get rattled when the market throws a curveball.
If you’re jumping from one strategy to another or chasing every shiny new stock, you’re spreading your energy too thin.
And in trading, scattered focus equals scattered results.
How to Strengthen Your Focus:
Create a daily routine and stick to it. Consistency fuels discipline.
Set specific trading goals for each session.
Block out distractions. Social media can wait.
Review your trades regularly to keep your mind sharp.
Sheer Will Gets You Through the Tough Times
Let’s not sugarcoat it:
There will be rough patches.
Trading will test you.
Your willpower will be stretched like a rubber band, and sometimes it might snap.
But those who make it are the ones who refuse to quit.
There’s a misconception that the best traders are the ones who never lose. Wrong.
The best traders are the ones who keep getting back up.
You will lose trades.
It’s part of the game.
But if you have the will to persist, those losses become your greatest teachers.
Ways to Build Your Willpower:
Start small. Set short-term, achievable goals to build momentum.
Learn from each mistake. Losses are part of the learning curve.
Celebrate your progress, even if it’s slow.
Stay connected with other traders to keep motivated.
Determination is Your Guiding Force
What makes a trader stick to their plan even when everything seems to be going wrong?
Determination.
It’s that relentless drive to keep going no matter what.
It’s about having a clear vision of where you’re headed and refusing to let setbacks derail you.
Determination means playing the long game.
It’s easy to get discouraged after a few losses or slow weeks, but successful traders know that big wins take time.
You’ve got to be in it for the long haul.
Strengthening Your Determination:
Write down your trading goals and review them daily.
Make sure you have checked the US Economic calendar with your trading strat.
Remind yourself of why you started trading in the first place.
Don’t let a losing streak shake your confidence—adjust, don’t abandon.
Stay flexible but committed to your strategy.
Conclusion: Keep Grinding, Keep Growing
Trading is a game of focus, sheer will, and relentless determination.
It’s not easy, but if you can master these qualities, you’ll find yourself ahead of the pack.
Success in trading doesn’t come from luck or overnight gains.
It comes from grinding it out, day after day, with a sharp mind and an unbreakable spirit.
Remember, the markets will test you.
They’ll try to break your focus, test your will, and challenge your determination.
But if you stay committed, keep your focus razor-sharp, and push through the tough times, you’ll come out stronger, smarter, and more successful.
So, what are you waiting for?
Tighten up your focus, flex that willpower, and get ready to tackle the markets with unstoppable determination.

JPMorgan to Accept BTC and ETH as Loan Collateral in 2025In the rapidly maturing cryptocurrency landscape, a prominent Wall Street bank is poised to accept Bitcoin (BTC) and Ethereum (ETH) as collateral for loans by the end of 2025, marking a significant step toward mainstream adoption. This move, building on earlier acceptance of crypto-linked ETFs, allows institutional clients to leverage their digital holdings for financing without selling, freeing up liquidity for other investments. With BTC trading at $116,000 and ETH at $4,500, this integration could unlock billions in lending capacity, bridging traditional finance and crypto. The policy will factor crypto into net worth assessments, placing it on par with stocks or bonds for loan eligibility. This article explores the development, market implications, risks, and trading signals. Position for BTC and ETH's boosted accessibility as collateral.
The Collateral Expansion: From ETFs to Native Crypto
The bank plans to allow BTC and ETH as direct collateral for credit lines, expanding from spot Bitcoin ETFs like those holding billions in AUM. This enables clients to secure loans against crypto without liquidation risks, processing transactions in sub-seconds via blockchain. The policy applies globally, spanning retail to high-net-worth borrowers, and includes custody solutions for safety.
This evolution follows Bitcoin's rally to record highs and a shift in regulatory tone, with Bitcoin and Ethereum viewed as legitimate assets. Experts note it addresses volatility concerns by using conservative haircuts, valuing BTC at 50–70% of market price for loans. On-chain data shows BTC transaction volume up 20%, whale activity +15%, and sentiment 71% bullish, correlating 0.8 with Nasdaq. The move aligns with global trends, like stablecoin integrations, potentially adding $10 billion in lending volume.
Risks include volatility spikes (5–7% dips), but audited reserves and MiCA compliance mitigate depegs. Forecast: $100 billion in crypto-backed loans by 2026, with BTC/ETH dominating 70%.
Market Implications: Liquidity and Adoption Boost
Accepting BTC and ETH as collateral enhances liquidity, allowing holders to borrow without selling, preserving upside potential. This could drive $500 million quarterly inflows, stabilizing markets amid 2.5% CPI inflation. For traders, it facilitates leveraged strategies, with 69% of Bitcoin ETF outflows from redemptions now offset by collateral use.
On-chain metrics highlight resilience: 60% BTC supply unmoved, liquid supply at 3.9 million coins. Sentiment is 71% bullish, as the policy positions crypto as "digital gold," with $4.5 billion weekly ETF inflows providing a floor.
Trading Signals: RSI and MACD
Based on recent trends:
BTC ($116,000): RSI at 57 (neutral-bullish). Bullish MACD (+0.15)—target $120,000 (3.5% upside). Fibonacci support at $115,000, resistance at $117,400. On-chain: volume +20%.
ETH ($4,500): RSI at 58. Bullish MACD (+0.12)—target $5,200 (15% upside). Support at $4,200, resistance at $4,760.
Overall: RSI 57–58 signals longs for 3.5–15% gains. Risks: volatility (5–7% dip); hedge with USDC.
How to Trade Collateral Crypto
Monitor RSI >60 for entries (e.g., BTC at $115,000), track ETF inflows ($4.5B weekly), and allocate 20% to BTC/ETH, hedging with USDC at RSI >70. Watch for policy rollout.
Conclusion: Crypto Collateral Dawn
The bank's BTC and ETH collateral acceptance signals mainstream integration, unlocking lending liquidity. RSI 57–58 and bullish MACD suggest 3.5–15% upside—buy for the adoption wave.
What’s your crypto collateral strategy? Comment below!
#CryptoCollateral #BTCETH #CryptoLending #BTC #TradingSignals

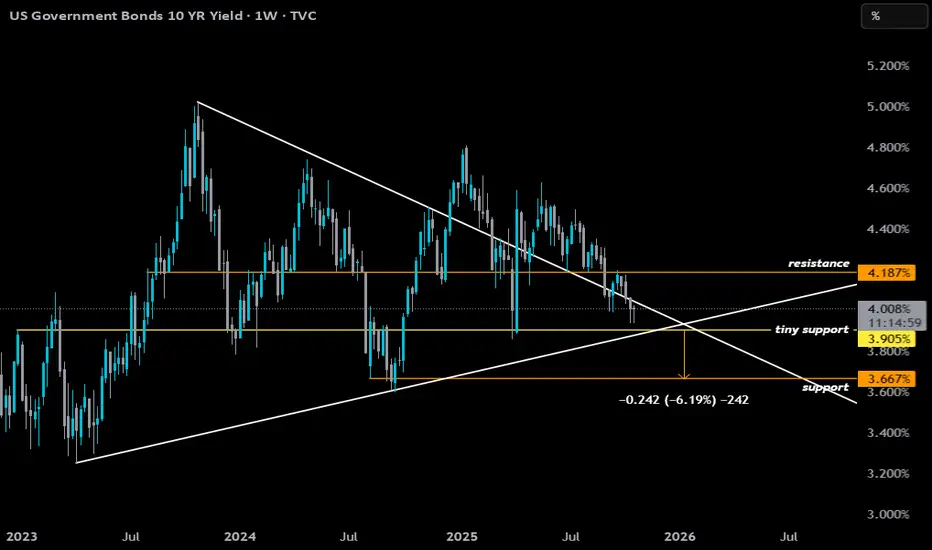
The Refi Setup: 10-Year Yield Compression📉 10-Year Yield Compression = Refi Setup
The 10Y is coiling inside a descending wedge around 4.00%, signaling upside exhaustion.
A break below 3.90% → 3.66% is the key trigger — that’s the rate-relief zone.
Macro backdrop (credit stress, weak growth, liquidity preference) tilts odds downward.
Yield compression = rate repricing = higher refi probability.
🧭 Key Levels
4.18% → Resistance ceiling
3.90% → Battleground (break = downside momentum)
3.66% → Breakdown confirmation
Measured move projects ~35–40 bps lower toward 3.65% — enough to reprice mortgage spreads .
💡 Refi Mechanics
10Y ↓ → 30Y mortgage rates ↓
4.00% = ~5.8% avg mortgage
3.65% = ~5.35% avg mortgage
Even a 40–50 bps drop can spark a refi wave, as millions cross their break-even line.
Falling yields = faster prepayments → servicers buy Treasuries → more yield compression → positive feedback loop for lower rates.
1000 USD: Coffee Bull Market Overview: Prices set to DOUBLE ☕ Coffee (Arabica, ICE “KC”) — Outlook to 2026
Where we are: Nearby Arabica trades ~405–410 US¢/lb after a parabolic 2025 on weather stress, thin deliverable stocks, and policy shocks. The Dec ’25 contract is ~400 ¢/lb.
Big picture 2025/26: Official global production is pegged at a record ~178.7 M bags (robusta-led) versus ~169.4 M bags consumption; ending stocks remain tight near ~22.8 M. Inside that headline, arabica is the pinch point: Brazil’s arabica is down year over year on heat/drought, and multiple private houses flag an arabica deficit on the order of ~–8.5 M bags for 2025/26.
________________________________________
🤖 1) Brazil 2025 flowering & 2026 crop execution (↑ to 9.5/10)
Why it matters: Brazil is the swing producer for arabica; 2026 outcomes hinge on Sep–Oct 2025 flowering and the trees’ carryover stress from 2024–25 dryness/frost. Local co-ops in Cerrado report frost-related damage with six-figure bag impacts to 2026 potential.
What we’re seeing: The latest national estimate cuts 2025 output to ~55.2 M bags total (arabica ~35.2 M), confirming a weaker arabica “off” year. Talk of a “super 2026” has faded unless rains arrive and stick through flowering and early fruit set.
Why 9.5/10? A missed flowering or poor fruit set is the cleanest path to a 2026 arabica shortfall big enough to rip futures.
________________________________________
🌍 2) U.S. 50% tariff on Brazilian coffee (new 9.0/10)
Why it matters: The U.S. typically imports ~8 M bags from Brazil. A 50% tariff (effective Aug 6, 2025) distorts flows, inflates U.S. landed costs, and channels more hedging into NY “KC,” structurally supporting futures. Brazil trade groups directly linked August’s vertical move to the tariff shock.
Why 9.0/10? If the tariff persists into 2026, basis stays elevated and retail prices remain sticky even if global aggregates look “adequate.”
________________________________________
🧭 3) EU Deforestation Regulation (EUDR) go-live (↑ 8.8/10)
Why it matters: Traceability/geolocation rules begin Dec 30, 2025 for large/medium operators (SMEs Jun 30, 2026). Compliance temporarily shrinks “eligible” supply and reprices differentials.
Why 8.8/10? Early-2026 could see EU-grade shortages, wider diffs, and higher KC via arbitrage.
________________________________________
📉 4) Exchange (ICE) certified stock drawdown (↑ 8.5/10)
Why it matters: Deliverable supply amplifies squeezes. Arabica certified stocks ~0.67–0.78 M bags in early September—thin for the season.
Why 8.5/10? With low float, any weather or logistics hiccup can air-pocket futures into blow-off spikes.
________________________________________
🌡️ 5) ENSO/La Niña watch & Brazil rainfall tail-risk (holds 8.0/10)
Why it matters: La Niña-skewed patterns risk ill-timed rain (flower knock-off) or too-little rain (poor fruit set) in Minas Gerais during Sep–Oct. Early September dryness was flagged; late-September storms are pivotal.
Why 8.0/10? The timing of rain matters as much as totals; a mis-timed pattern is enough to dent 2026 yields.
________________________________________
🇻🇳 6) Vietnam robusta recovery vs. water stress (↑ 7.8/10)
Why it matters: Robusta tightness forced blend shifts. A rebound toward ~31 M bags in 2025/26 would cap KC via spread relief; persistent water stress/tree fatigue would keep robusta tight, forcing arabica to carry the world.
Why 7.8/10? Binary swing factor: a real rebound cools spreads; a miss extends the squeeze into 2026.
________________________________________
🏛️ 7) Policy & trade fragmentation beyond U.S. tariffs (↑ 7.5/10)
Why it matters: Frictions and exemptions remain fluid. Retaliation or parallel measures could redirect flows to EU/Asia, move basis, and distort origin diffs.
Why 7.5/10? The tariff is already biting; add-ons would compound tightness.
________________________________________
💵 8) FX (BRL) & producer selling (↑ 7.0/10)
Why it matters: A stronger BRL curbs farmer selling; a weak BRL unleashes hedges and pressures KC. Policy/inflation noise keeps BRL volatile.
Why 7.0/10? Not first-order, but magnifies weather/policy shocks.
________________________________________
🏭 9) Demand elasticity & substitution (holds 6.8/10)
Why it matters: 2025 sticker shock clipped demand by roughly –0.5%. 2026 could stabilize if prices plateau; if retail rises further (tariffs/EUDR), more down-trading or substitution (robusta/other beverages) caps upside.
Why 6.8/10? A genuine headwind to the $10/lb path unless supply breaks further.
________________________________________
🚢 10) Logistics, certifications & differentials (new 6.5/10)
Why it matters: Tight washed/tenderable pools, evolving ICE rules/diffs, and shipping bottlenecks can widen basis and squeeze deliverables.
Why 6.5/10? Secondary, but adds fuel to any fundamental spark.
________________________________________
📈 11) Spec positioning & financial flows (↑ 6.5/10)
Why it matters: 2025’s run featured panic buying in a low-float market. Another weather scare + thin stocks invites CTA/momentum flows through round-numbers.
Why 6.5/10? Not fundamental—but can yank KC vertically.
________________________________________
🧪 12) “Record global production” optics vs. arabica reality (new 6.0/10)
Why it matters: The record headline is robusta-led. Inside, Brazil arabica declines and exporters stay cautious. The market trades the arabica bottleneck, not the aggregate.
Why 6.0/10? This optics gap sustains volatility—bulls can still win if arabica under-delivers.
________________________________________
Updated Catalyst Scorecard
Rank Catalyst Score
1 Brazil 2025 flowering → 2026 crop 9.5
2 U.S. 50% tariff on Brazil 9.0
3 EU EUDR (Dec 30, 2025 start) 8.8
4 Low ICE certified stocks 8.5
5 ENSO/La Niña rainfall risk 8.0
6 Vietnam robusta recovery risk 7.8
7 Wider trade policy fragmentation 7.5
8 FX (BRL) & selling behavior 7.0
9 Demand elasticity/substitution 6.8
10 Logistics, diffs & certification frictions 6.5
11 Spec/CTA flows 6.5
12 “Record crop” optics vs arabica bottleneck 6.0
________________________________________
📊 Supply–Demand Snapshot — Why Arabica Is the Pinch Point
• World 2025/26: Production ~178.7 M; consumption ~169.4 M; ending stocks ~22.8 M (still lean).
• Brazil arabica: ~40.9 M (down ~2.8 M YoY); robusta records elsewhere (Brazil/Indonesia); Vietnam recovery penciled near 31 M.
• Private balance: Arabica deficit ~–8.5 M for 2025/26 (vs ~–5.5 M in 2024/25).
• ICE plumbing: Certified arabica ~0.67–0.78 M bags and trending lower → thin deliverables, higher tail-risk premia.
________________________________________
🔍 Recent Headlines You Should Know
• KC spiked toward/above $4/lb in early 2025 on panic buying, weather, and policy shocks.
• “Record global crop” headlines coexist with lower Brazil arabica and tight ending stocks.
• U.S. 50% Brazil tariff (Aug 6, 2025) credited with a ~30% surge in August.
• EUDR deferred to Dec 30, 2025 for large/medium operators; compliance scramble into 1H26.
• Early-Sep 2025 Minas dryness kept flowering risk live; markets watching late-Sep showers.
________________________________________
🎯 Street & Agency Views (as of Sep 2025)
• Early-2025 consensus had end-2025 ~$2.95/lb, expecting mean reversion. The market disagreed post-tariffs.
• One multilateral outlook saw >50% y/y up in 2025, then –15% in 2026, assuming supply normalization and Colombia recovery.
• Several trade houses continue to highlight a widening arabica deficit into 2025/26.
Takeaway: Consensus expects some 2026 cooling, but policy + compliance + arabica weather can overwhelm “aggregate surplus” narratives.
________________________________________
🧭 Pathways to 1,000 ¢/lb in 2026 (Aggressive Target)
We’re already near 400 ¢. To reach $10/lb, the market needs a stack of arabica-specific shocks that persist into 2026:
1. Brazil under-delivers in 2026: Patchy/failed flowering (Sep–Oct ’25) and/or heat during fruit set reduce yields; 2026 arabica ≤ ~38–40 M.
2. Tariffs persist through 2026: U.S. 50% duty remains in force, lifting U.S. basis and rerouting flows; fewer tenderable lots into ICE.
3. EUDR friction bites in 1H26: Non-compliant lots stranded; compliant premiums surge; differentials widen and pull KC higher.
4. Certified stocks < ~500k bags: Roaster drawdown + limited grading/tendering triggers backwardation and squeeze mechanics.
5. Vietnam misses rebound: Water stress or tree fatigue keeps robusta tight; arabica must carry blends globally.
6. Pro-cyclical flows: Thin deliverables + headlines = momentum/CTA accelerants through round numbers (500 → 700 → 900 → 1,000).
Probability assessment: Not the base case, but plausible if two or more of (1–4) coincide while financial flows amplify. Call it ~20–25% conditional on Q4’25 weather and policy staying restrictive.
________________________________________
🧮 Scenario Framework (NY Arabica, nearby; end-2026)
• Bull (30%) — Squeeze: Brazil 2026 < 40 M; tariff persists; EUDR tight; certifieds < 0.5 M; Vietnam under-shoots.
Price: 800–1,000 ¢/lb (blow-off spikes possible above 1,000 on transient squeezes).
• Base (50%) — Elevated & volatile: Brazil 2026 ~41–44 M; tariff partially eased or offset; EUDR frictions fade by 2H26; Vietnam rebounds.
Price: 450–650 ¢/lb with episodic spikes on weather or logistics.
• Bear (20%) — Normalization: Strong Brazil flowering → 2026 ≥ 45 M; tariff rolled back; EUDR compliance smoother; certifieds rebuild > 1.2 M; demand softens.
Price: 280–420 ¢/lb (vol still above pre-2024 norms).
________________________________________
🗓️ Watchlist & Timeline (what to track)
• Sep–Oct 2025: Brazil flowering windows (Minas/Cerrado/N. São Paulo). Look for rain onset, follow-up, and heat bursts.
• Nov–Dec 2025: Fruit set confirmation; disease incidence; updated 2026 potential.
• Dec 30, 2025: EUDR go-live (large/medium operators).
• Q1–Q2 2026: Compliance bottlenecks, EU diffs, tenderable quality flows into ICE.
• All 2025/26: Tariff status, BRL swings, certified stock trajectory, Vietnam water/harvest updates.
________________________________________
⚠️ Risk Matrix (what flips the call bearish)
• Timely rains in Sep–Oct 2025 and mild temps → robust fruit set; Brazil 2026 ≥ 45 M.
• Tariff rollback or broad exemptions reduce U.S. basis support.
• Vietnam outperform (> 31 M) relieves spreads; Indonesia robusta stays strong.
• Certified stocks rebuild > 1.2 M bags by mid-2026.
• Demand destruction accelerates (retail fatigue, substitution), capping upside.
________________________________________
📌 Positioning Lens (informational, not advice)
• Drivers of upside convexity: Brazil weather into October, policy stickiness (tariff/EUDR), and certified stock path.
• Tell-tales of a squeeze: Steepening backwardation, diffs blowing out for compliant washeds, and rapid certified draw alongside rising exchange open interest.
• Tell-tales of normalization: Strong flowering reports, improved grading pass-rates, certified rebuilds, and easing EU compliance premia.
________________________________________
Bottom Line
• The base case remains elevated and volatile into 2026, not automatic mean reversion.
• A credible path to 1,000 ¢/lb exists if Brazil’s 2026 arabica disappoints, policy frictions persist, EUDR pins EU-grade supply, and certifieds fall sub-0.5 M, with CTA flows doing the rest.
• Conversely, timely Brazil rains, tariff relief, and a clean EUDR transition cap the rally and pull prices toward the high-$3s/low-$4s.

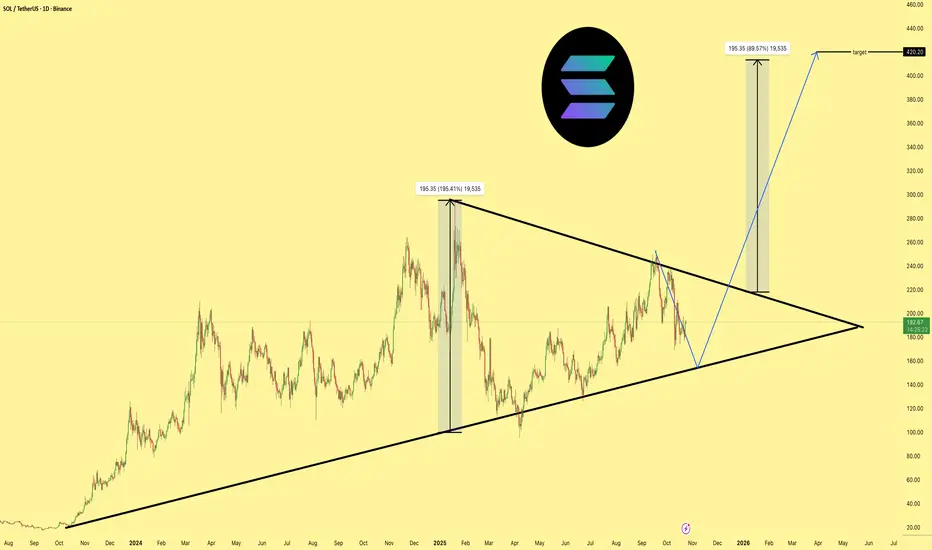
SOLCRYPTOCAP:SOL target remains $420, but there’s still room for a dip toward the $150 zone before the next leg up. Placing limit orders between $130–$160 is a smart move to DCA into your spot position. This strategy helps smooth out volatility and gives you a strong average entry.
ETHCRYPTOCAP:ETH is showing two clear setups right now, one being a symmetrical triangle and the other an ascending channel. Both point to strong bullish momentum building. I’m leaning toward a breakout scenario where ETH surges and taps $9000 with ease once momentum kicks in.

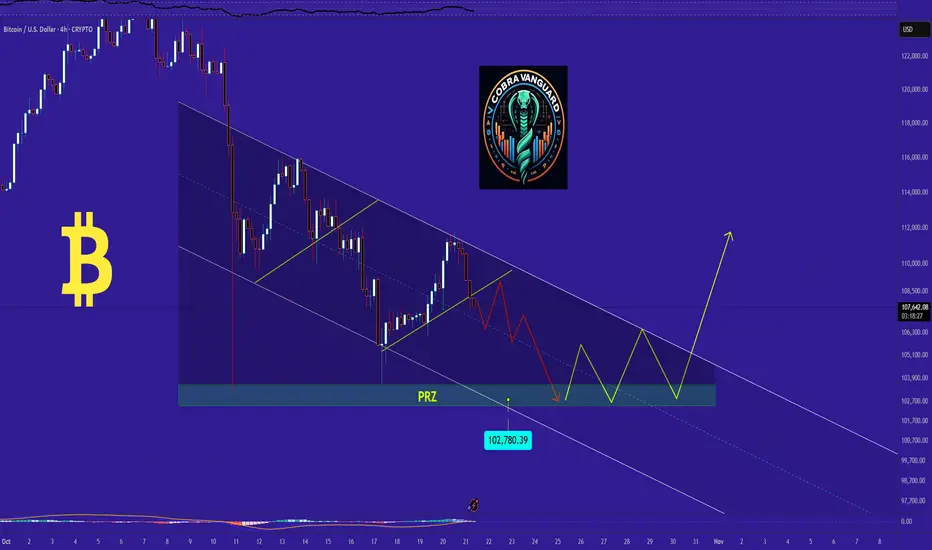
bitcoin Analysis (Update)As I mentioned earlier, the price has reached the bottom of the channel and completed the final bearish wave. I'm hopeful that Bitcoin will respect the technical setup and begin a bullish wave from here.
!!! However, Bitcoin might surprise everyone and break the channel structure.so we need to wait for confirmation, which I believe will become clear by next week .
Follow us for upcoming updates and market insights.
PREVIOUS ANALYSIS

EUR ASIAH Resistance lineQuick 1:1 R2R position, DXY still on overall bullish Bias, the resistance line is exhausted though but tempting to enter

bitcoin Analysis (Update)I believe the price could drop below $103000 and reach the PRZ (Potential Reversal Zone), from which it may start to rise. Additionally, it seems the price is forming a triangle pattern. If this pattern completes, a breakout above the triangle resistance—or the channel—could lead to a strong upward move.
EURCAD: Another Trend Line Based Opportunity 🇪🇺🇨🇦
EURCAD may continue rising after a test of a solid
rising trend line on a daily.
A formation of a double bottom pattern accompanied by
a bullish Change of Character on an hourly time frame
indicates a strong buying interest.
Goal - 1.6305
❤️Please, support my work with like, thank you!❤️
I am part of Trade Nation's Influencer program and receive a monthly fee for using their TradingView charts in my analysis.

Lingrid | GOLD Consolidation Period Following Retracement ?OANDA:XAUUSD is pulling back after a failed retest of the 4,380 resistance zone, showing weakness at the upper boundary of the market structure. The market forms a descending correction within a potential consolidation phase following pullback, staying below the downward trendline. Price may attempt a rebound toward upper zone of consolidation at 4,135 before another wave up if momentum remains neutral. Overall, gold reflects a temporary correction inside a broader upward trend.
⚠️ Risks:
A sustained break below 4,000 would shift short-term sentiment back to bearish.
Unexpected shifts in US inflation or bond yields could spark sell off gold.
Thin liquidity may trigger false breakouts within the consolidation range.
If this idea resonates with you or you have your own opinion, traders, hit the comments. I’m excited to read your thoughts!

NZDJPY: Important Breakout 🇳🇿🇯🇵
NZDJPY broke and closed above a significant horizontal
resistance cluster on a daily.
There is a high chance that the market will go higher soon.
Expect a bullish continuation to 88.3 level.
❤️Please, support my work with like, thank you!❤️
I am part of Trade Nation's Influencer program and receive a monthly fee for using their TradingView charts in my analysis.

USDJPY - BULLISH MOVE!Hello traders,
On Tuesday 7 Oct, the USDJPY broke the resistance level (150.917 - 149.790).
This key level becomes new support!
So, I expect a bullish move🚀
_____________
TARGET 1: 153.000🎯
TARGET 2: 154.660🎯

FAB -ADX- Positive Earnings Surprise
After April downtrend, FAB bottomed out near 11.78 AED and started a clean, impulsive rally breaking structure highs.
Recent correction appears to be a classic ABC zig-zag, retracing to a key demand zone around 15.44–15.96 AED.
Price now showing reversal signs with bullish engulfing and breakout from a local descending trendline.
Earnings:
EPS Beat: 0.463 vs 0.42 est (+9.98%)
Revenue Beat: 9.34B vs 8.79B est (+6.22%)
Positive earnings surprise supports bullish momentum.
Demand Zone: 15.44–15.96 AED – price bounced cleanly from this zone.
Supply Zone: 19.20–22.60 AED – layered TPs based on recent structure.
Trade Setup:
Entry: 17.04 AED (breakout confirmation)
Stop Loss: 15.96 AED (below demand zone)
Take Profits:
TP1 (1:1): 18.16
TP2 (2:1): 19.48
TP3 (3:1): 20.38
TP4 (4:1): 21.48
TP5 (5:1): 22.60
Risk/Reward: Max 5:1
Potential Profit: +26.32%
Risk & Trade Management
Max Capital Risk: 1–3% of portfolio.
Consider scaling out:
50% at TP2
25% at TP3
25% left to run toward TP4–TP5.
Reassess if price stalls at 18.50–19.00 (previous swing high zone).
Elliott Wave
Possible Wave 2 correction just completed.
Current price action suggests start of Wave 3 – typically most explosive.
⚠️ Disclaimer
This trade idea is for educational purposes only. Not financial advice. Do your own analysis before trading. Always use risk management.
"The goal of a successful trader is to make the best trades. Money is secondary." – Alexander Elder
#FAB #ADX #SwingTrade #BreakoutSetup #SupplyDemand #EarningsBeat #ElliottWave #TechnicalAnalysis #RiskReward #TradeSmart #HeikinAshi

Lingrid | USDJPY Weekly High Rejection - Potential Sell SignalFX:USDJPY reached the weekly high, showing bearish divergence after an extended rally inside the upward channel. Price is now hovering near the 153.000 level, where prior highs align with weakening momentum. A rejection here could trigger a pullback toward the 152.000 mid-channel support, marking the next liquidity pocket. The 153.000 area acts as the key pivot where bears may regain short-term control before a potential rebound.
⚠️ Risks:
Breakout above 153.000 would invalidate the pullback outlook and invite new buying pressure.
Broader dollar strength could lift the pair beyond resistance.
Weakening yen fundamentals might limit downside follow-through.
If this idea resonates with you or you have your own opinion, traders, hit the comments. I’m excited to read your thoughts!

EURGBP FRGNT Daily ForecastQ4 | W43 | D24| Y25 | UPDATE📅 Q4 | W43 | D24| Y25 |
📊 EURGBP FRGNT Daily Forecast UPDATE
🔍 Analysis Approach:
I’m applying Smart Money Concepts, focusing on:
Identifying Points of Interest on the Higher Time Frames (HTFs) 🕰️
Using those POIs to define a clear trading range 📐
Refining those zones on Lower Time Frames (LTFs) 🔎
Waiting for a Break of Structure (BoS) for confirmation ✅
This method allows me to stay precise, disciplined, and aligned with the market narrative, rather than chasing price.
💡 My Motto:
"Capital management, discipline, and consistency in your trading edge."
A positive risk-to-reward ratio, paired with a high win rate, is the backbone of any solid trading plan 📈🔐
⚠️ Losses?
They’re part of the mathematical game of trading 🎲
They don’t define you — they’re necessary, they happen, and we move forward 📊➡️
🙏 I appreciate you taking the time to review my Daily Forecast.
Stay sharp, stay consistent, and protect your capital
— FRNGT 🚀
FX:EURGBP

AUDUSD FRGNT Daily Forecast -Q4 | W43 | D24| Y25 |📅 Q4 | W43 | D24| Y25 |
📊 AUDUSD FRGNT Daily Forecast
🔍 Analysis Approach:
I’m applying Smart Money Concepts, focusing on:
Identifying Points of Interest on the Higher Time Frames (HTFs) 🕰️
Using those POIs to define a clear trading range 📐
Refining those zones on Lower Time Frames (LTFs) 🔎
Waiting for a Break of Structure (BoS) for confirmation ✅
This method allows me to stay precise, disciplined, and aligned with the market narrative, rather than chasing price.
💡 My Motto:
"Capital management, discipline, and consistency in your trading edge."
A positive risk-to-reward ratio, paired with a high win rate, is the backbone of any solid trading plan 📈🔐
⚠️ Losses?
They’re part of the mathematical game of trading 🎲
They don’t define you — they’re necessary, they happen, and we move forward 📊➡️
🙏 I appreciate you taking the time to review my Daily Forecast.
Stay sharp, stay consistent, and protect your capital
— FRNGT 🚀
OANDA:AUDUSD

Lingrid | BTCUSDT Buying Opportunity In Sideways Market OKX:TONUSDT recently rebounded from the support zone after completing a range breakout and forming an ABC corrective move near the $2.0 mark. Price structure remains compressed between the descending resistance and rising trendline, hinting at a potential bullish recovery setup. A sustained above $2.10 could signal continuation toward $2.22. The bullish scenario builds from the ongoing rebound phase within the structure break above current range zone.
⚠️ Risks:
Rejection from $2.10 may invalidate the breakout structure.
Broader crypto weakness could cap upward momentum.
Failure to sustain above the trendline may shift bias back to bearish continuation.
If this idea resonates with you or you have your own opinion, traders, hit the comments. I’m excited to read your thoughts!


Hellena | SPX500 (4H): LONG to resistance area of 6777.Price made a sharp and strong move to the 6503 level, making wave “4” quite large, but this move did not break the structure.
I think that now the price is in the big wave "5" and middle wave "2".
I think that there will be an upward movement with the purpose to renew the maximum of the wave "3" of higher order.
Therefore, I expect the price in the resistance area of 6777.
Fundamental context
After the sharp drop, the market quickly recovered — investors are once again turning to risk assets amid growing expectations of upcoming Fed rate cuts.
Inflation data came out under control, and corporate earnings have been stronger than expected, boosting confidence in the U.S. economy.
With the dollar losing momentum and bond yields easing, the S&P 500 now has room to extend its move upward toward the resistance area near 6777.
Manage your capital correctly and competently! Only enter trades based on reliable patterns!

DU Earnings Play - Potential Uptrend after Q3 Profit RisesPrice has been in a strong bullish uptrend from late 2023 into mid-2025, respecting ascending trendlines and breaking out from multi-month accumulation zones.
It peaked aggressively near 11.25 AED, followed by a sharp corrective drop (likely Wave A of an Elliott correction).
Currently consolidating in a tight range, possibly forming a re-accumulation base.
Earnings Insights
Q3 Profit: AED 732.1M vs 719M YoY – a solid beat.
Q3 Revenue: AED 3.87B vs 3.59B YoY – steady growth.
CAPEX: AED 492M – indicates continued infrastructure investment.
Sentiment: bullish based on earnings
Breakout Potential: Bullish break from current consolidation could signal New impulse Wave upward.
🎯 Trade Setup
Entry: 9.19 AED (Breakout of consolidation range)
Stop Loss: 8.87 AED (Below demand zone)
Take Profits:
TP1 (1:1): 9.51
TP2 (2:1): 9.83
TP3 (3:1): 10.05
TP4–7: Up to 10.70 (full retrace)
Risk/Reward: Ranges from 1:1 to 7:1
Risk Management
Max Risk: 1–3% of total trading capital.
Trade Management
Consider moving Stop Loss to Break Even (BE) once TP1 (1:1) is hit.
Trail SL below higher lows if breakout confirms.
Scale out at each TP level or use 50/25/25 rule: 50% at TP1, 25% at TP2, 25% runners.
"Amateurs think about how much money they can make. Professionals think about how much money they could lose." – Jack Schwager
⚠️ Disclaimer
This analysis is for educational purposes only. It does not constitute financial advice. Always conduct your own due diligence and consult with a licensed financial advisor before making any investment decisions.
#DU #DFM #SwingTrade #TechnicalAnalysis #BreakoutTrade #SupplyDemand #ElliottWave #RSI #RiskManagement #HeikinAshi #UAEStocks #EarningsPlay #DubaiMarket

GBPNZD: Pullback From Trend Line 🇬🇧🇳🇿
GBPNZD may bounce from a strong rising trend line on a daily.
The price formed an inverted head and shoulders after its test
and violated its neckline this morning.
I expect a pullback to 2.3215
❤️Please, support my work with like, thank you!❤️
I am part of Trade Nation's Influencer program and receive a monthly fee for using their TradingView charts in my analysis.
